
World Cup Arbitrage Bible
- Core Viewpoint: This article systematically elaborates on the scientific methodology of World Cup predictions and trading. The core lies in converting the emotions and narratives of football matches into quantifiable probability models (such as Poisson distribution, Elo ratings, Bayesian updates), identifying pricing biases based on market pricing, and leveraging disciplined execution (order books, Kelly Criterion, stop-loss) and systematic reviews to gain a long-term advantage, rather than just predicting a single champion.
- Key Elements:
- Model Upgrade: From basic Poisson distribution for predicting goals, to the Dixon-Coles correction for low-scoring areas, Bayesian hierarchical models for handling small-sample noise in national teams, and further to xG/xT for quantifying game processes, gradually approaching true probabilities.
- Path Asset: The expansion of the 2026 World Cup to 48 teams introduces a mechanism where third-placed teams in the group stage can advance, turning championship contracts into "path assets." Traders need to focus on the cascading effects of group rankings and the relative strength of group halves on qualification probabilities.
- Market Trading: Models provide a fair probability (fair p), but actual trading must incorporate the order book (bid/ask spread, depth) and the Kelly Criterion for position sizing to avoid losses due to slippage or overconfidence.
- Strategy Examples: The article lists trading logics for specific scenarios such as path mispricing (group stage results altering the difficulty of a bracket), process reversal (scoreline diverging from xG), and motive trading (changes in incentives during the third round of group stage matches).
- Minimum Viable System: It is recommended that traders start with a minimal closed loop of following 8 teams, establishing baseline probabilities, recording trades, and conducting reviews. This helps to gradually train their sense of probability and execution discipline, rather than jumping straight to complex models.
Original author: @MrRyanChi, Founder of @insidersdotbot
Prologue
It has been quite a while since my last article. During this time, I have been researching various new strategies while tirelessly refining our trading terminal, insiders.bot. The World Cup is the ultimate "put your money where your mouth is" moment – a true test of whether our product can offer strategies accessible to the general public, enabling everyone to achieve successful trading through the event.
Therefore, this article will deconstruct all the strategies that have proven effective for trading in World Cups throughout history. These are the very strategies that have inspired the features of our current product version.
What excites me most about the new insiders.bot isn't just fast order execution, but how it consolidates information usually scattered across multiple screens: smart money signals, order books, TP/SL, instant copy trading, filterable data, and an AI Agent you can query in natural language.
The World Cup is the perfect scenario to illustrate this. It’s a mainstream event, everyone has an emotional stake. It’s also a low-scoring sport where a tiny variable can alter the entire narrative. A missing striker, a red card, a deflected shot with 0.08 xG, a third-place team's goal difference – any of these can shift championship probabilities, qualification odds, and market prices simultaneously.
So, back to strategy. This article isn't about telling you "who will win." Honestly, no one can say for sure.
I want to dismantle something else: When the World Cup becomes a price in a prediction market, how do we break emotions down into variables, compress variables into probabilities, and put those probabilities before the market for judgment?
In a nutshell: Scientifically predicting the World Cup isn't about foreseeing a single future. It's about laying out all possible futures on the table, pricing them, and executing your plan with discipline.
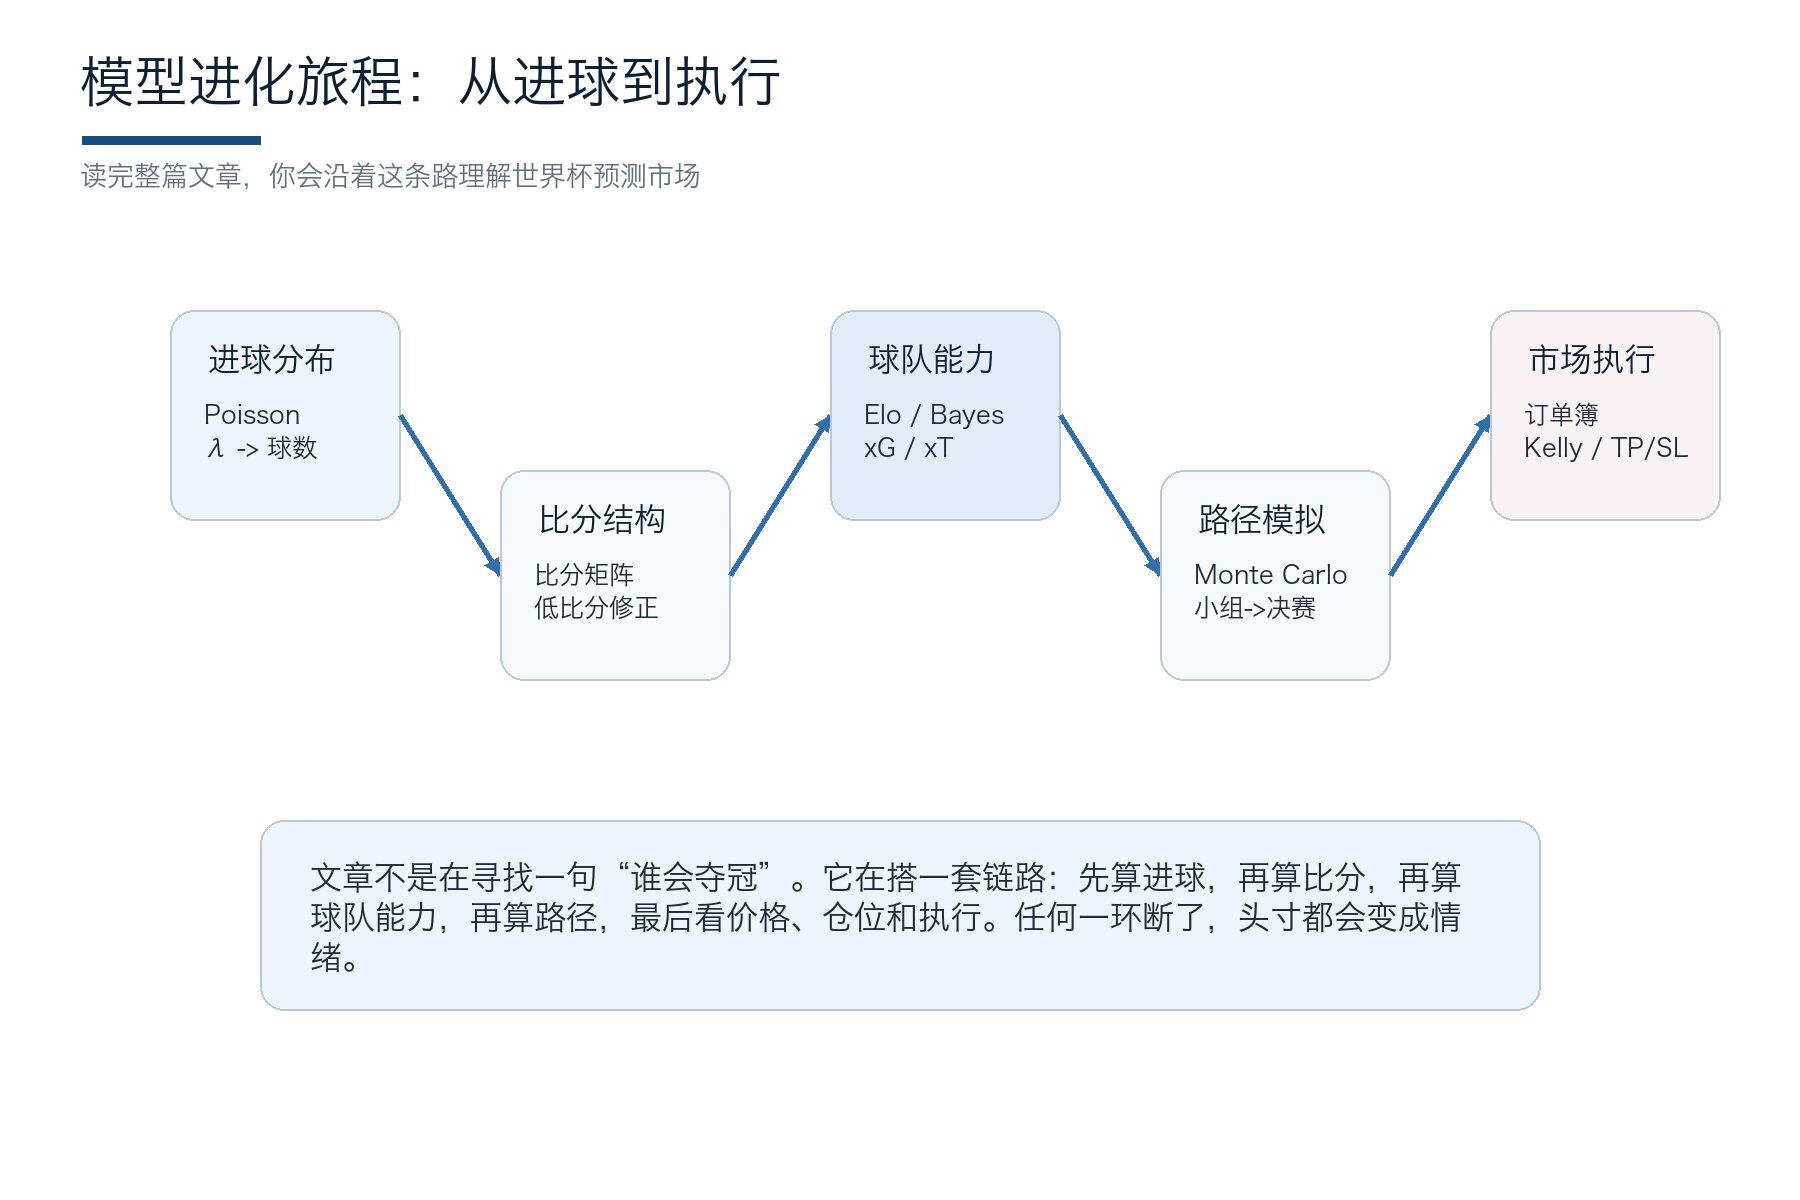
This article will take you on a journey through history, tracing the evolution of strategies from a century ago to the present, allowing you to absorb the essence of each.
Initially, people just asked: How many goals does a team typically score? Enter Poisson, which turned the "feeling of strength" into a goal distribution.
Soon, they realized averages weren't enough; scorelines have structure. Thus, Score Matrices, Dixon-Coles, Bivariate Poisson, and Skellam continued to dissect football more finely.
Later, the question shifted from "How many goals will be scored in this match?" to "How strong is this team really?"
Subsequently, Elo, Bradley-Terry, and ordered logit provided a long-term strength baseline. Bayesian hierarchical models taught us that with limited national team samples, we shouldn't be overly swayed by a single big win or an upset. xG, xT, and VAEP reopened the process behind the scoreline, revealing chance quality, ball progression, and action value.
Finally, models must enter the market. Machine learning and ensembles combine diverse information. Monte Carlo simulations repeatedly run group stages, knockout rounds, and path scenarios. The order book tells you if a theoretical price can be realized. Kelly criterion and TP/SL determine if you survive until the final. Reading on, you'll find this article isn't asking "who will win," but rather: Where do probabilities come from? Why do prices move? How should trades be executed and reviewed?
With this roadmap, each subsequent section is no longer an isolated concept. We don't start with formulas. Instead, we first place the World Cup from an emotional spectacle back into the price system of the prediction market. Only by understanding what a contract price represents can our later discussions about goals, paths, and positions avoid becoming pure technical self-indulgence.
1. First, View the World Cup as a Probabilistic Asset
Let's shift perspective first: The World Cup is, of course, full of emotion, national narratives, and legendary farewells. But a prediction market cares about only one thing: whether the current price correctly expresses the probability of a specific future event occurring.
1.1 Why 2026 is Special: Expanded Format Turns the Championship Market into a Path Asset
The 2026 World Cup expands from 32 to 48 teams. There are 12 groups of four. The top two from each group and the eight best third-place teams advance to the Round of 32. The champion will need to play 8 matches. In the official FIFA format document, these numbers look like mere organizational arrangements. From a trading perspective, they mean an expanded state space, increased path dependency, and a higher number of market re-evaluations (FIFA World Cup 2026).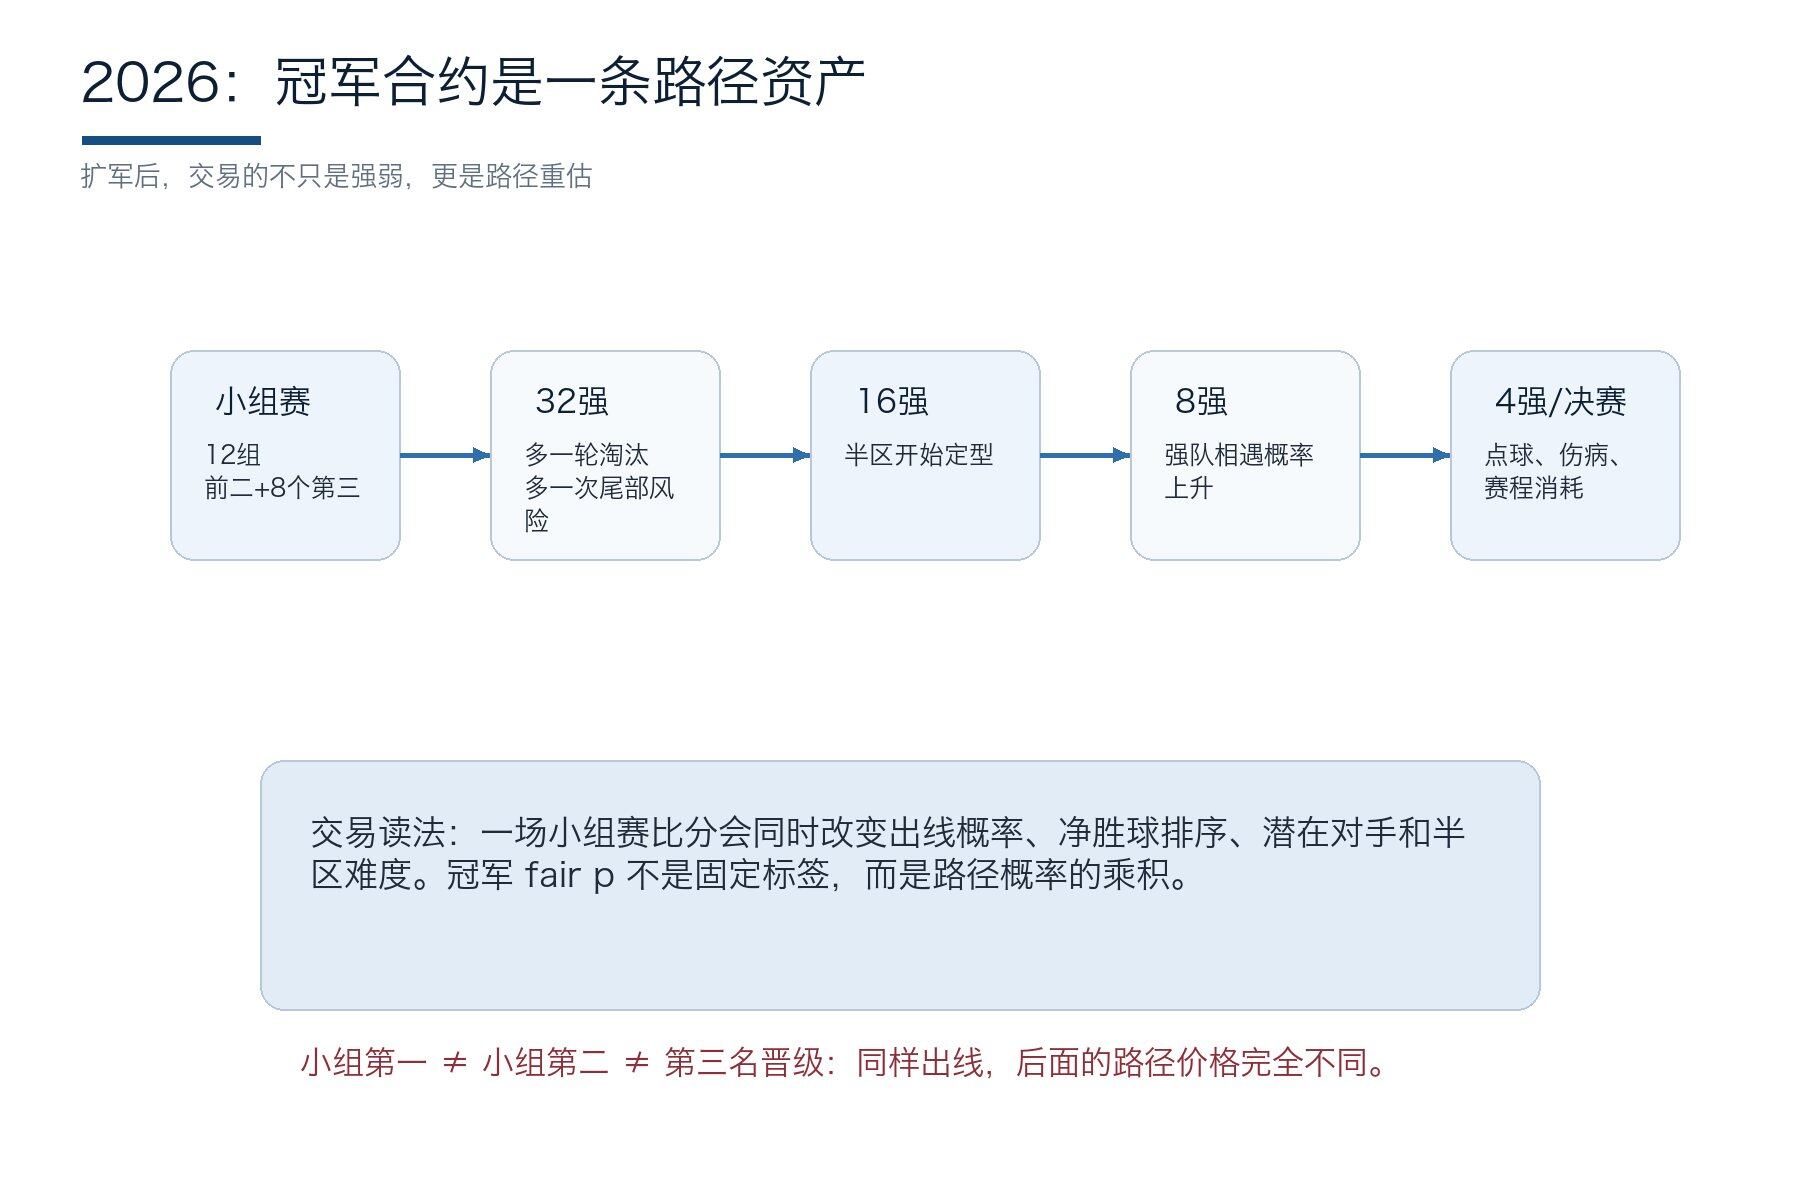
In past World Cups, many strong teams could secure a relatively clear knockout path just by稳稳 winning their group.
The third-place advancement mechanism in 2026 will turn the final round of the group stage into a complex payoff table.
- A team might not need to win, just lose by a small margin.
- A team might have already qualified but still needs to compete for a specific bracket spot.
- A team might look like they're in third place, but due to results in other groups, their actual advancement probability is changing rapidly.
This is crucial for prediction markets. A championship contract isn't about single-game win probability; it's about path probability. Winning the title can be roughly expressed as: Group stage advancement probability × product of knockout round advancement probabilities. One more game means one more chance for a red card, penalty, injury, weather, referee's decision, or tactical mismatch. A strong team's advantages accumulate, but so do its risks.
Therefore, the correct trading target for the 2026 World Cup isn't just "who will be champion," but the path itself: group stage advancement, bracket strength, third-place qualification, avoiding strong opponents, knockout stage penalty risks, and travel schedule fatigue. The market will give a total price before the tournament and continuously re-price the path during the games.
So, a trader's job is to identify which path's price is severely undervalued before the re-pricing happens.
1.2 Practical Reference
Consider a format example. Suppose a strong team's pre-tournament championship price is 12%. They win their first match 1-0 against a weaker team. The market might just interpret this as "securing three points." But if another favorite in the same group loses unexpectedly, the strong team's probability of finishing first, avoiding the strong half of the bracket, and the strength of opponents before the quarter-finals will all change simultaneously.
At this point, a trader shouldn't just ask if the team played well. Instead, immediately re-run the paths: How much did the probability of winning the group increase? Are they likely to rotate players in the final group game? Did the bracket get easier?
These moments are best prepared for in advance. List key scoreline scenarios for each group before the tournament starts. When prices move during a match, use the order book to see the real ask and depth, not just the mid-price on the page.
If Insiders.bot's 24-hour smart money screening signal suddenly indicates simultaneous warming in the qualification and championship markets for the same group, treat it as a reminder that "someone is trading the path." Then, return to your own model to check if you agree.
Once the format is explained, the real modeling begins. No matter how complex the path, it still boils down to individual matches: how many goals each team is likely to score. This determines the win/draw/loss probabilities and whether you should trade the championship, qualification, over/under, correct score, or nothing at all. In other words, the first modeling approach isn't guessing the champion; it's first calculating the single-match goal distribution, and then letting that decide which market suits your position.
II. Model Foundation: From Goal Distribution to Score Matrix
This section covers the most fundamental engine. Readers don't need to write code immediately. Just understand that all win rates, over/under odds, and advancement probabilities ultimately grow from a set of specific scoreline probabilities.
In this chapter, we'll learn two basics: Poisson distribution for probability calculation, and the Matrix as the model's framework. Combining them forms the Dixon-Coles model, used for predicting match scores.
2.1 Poisson: Bringing Football from Story to Distribution
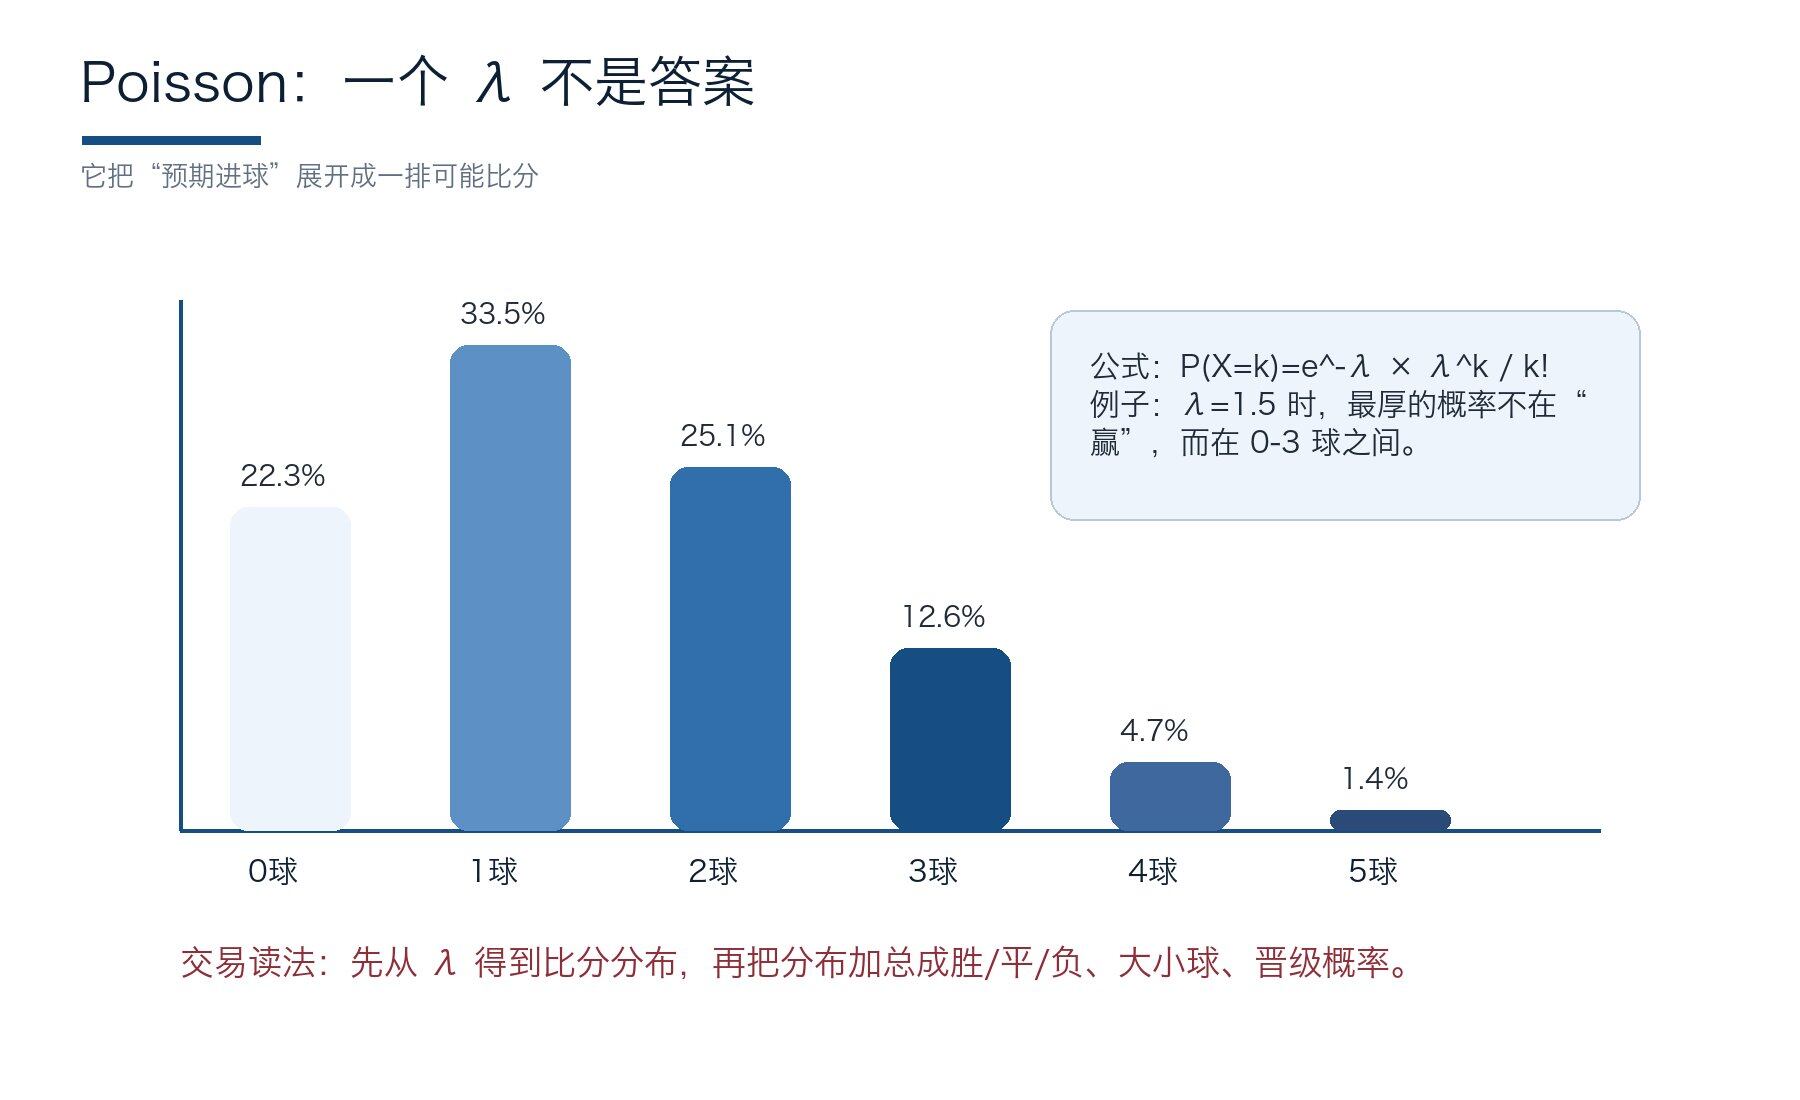 Figure 1: Poisson Distribution: A single λ is expanded into specific probabilities for 0 goals, 1 goal, 2 goals, etc.
The first pillar of football prediction is Poisson. Maher's seminal 1982 paper placed a team's attacking strength, defensive strength, and goal count within a single statistical framework (Maher). This seemingly simple step determined the foundation of football prediction for the next forty years: don't guess the outcome directly, predict the goals first.
The Poisson formula is P(X=k)=e^-λ × λ^k/k!.
The symbols mean:
- λ = average goals expected
- k = specific number of goals
If a team facing a particular opponent has λ=1.5, it doesn't mean they "should score 1.5 goals." It means that across many similar matches, their average goals would be around 1.5. A real match only yields 0, 1, 2, or 3 goals. The model expands this 1.5 into a series of probabilities.
This is what makes football different from basketball or tennis. Football is inherently low-scoring, so the weight of a single goal is enormous:
- A deflected shot from 0.08 xG can change the entire group dynamic.
- A goalkeeper's fumble can destroy all pre-match narratives.
The value of Poisson is reminding us not to write a low-scoring sport as a deterministic novel.
In trading, λ is the entry point for everything. You derive the score matrix from λ, and then aggregate the matrix to get win/draw/loss, over/under, both teams to score, and correct score probabilities. The championship market seems far from λ, but it's merely feeding many matches' λ into a single tournament tree. If the entry point (λ) is biased, the entire tree will grow crooked.
Don't rush to memorize the formula. Just think of Poisson as a translator: it takes a vague statement – "This team can probably score a few goals" – and translates it into a row of probabilities that can be added, compared, and traded.
What readers really need to practice isn't calculating e raised to a power. It's forming a habit: every time you see news, ask yourself which team's λ it changes, and by roughly how much. Once this becomes stable, all subsequent markets will become clearer.
Practical Reference
A small actionable example: Team A has a pre-match λ of 1.65, Team B has λ of 0.82. The model doesn't say Team A will score 1.65 goals. It spreads out the probabilities for Team A scoring 0, 1, 2, 3 goals. If the starting lineup is missing the main striker, you might reduce Team A's λ by 0.12-0.20. If it's a substitute winger, maybe only a 0.03 reduction. This action is much more reviewable than saying "the attack feels weaker."
For execution, turn λ changes into rules: core striker absent → reduce shot quality; main defensive midfielder absent → increase opponent's counter-attack λ; heavy rain and poor pitch → reduce λ for both sides.
Once the rules are clear, an AI Agent is well-suited to help translate news into parameter candidates. But the final decision on whether to adopt them should be dictated by your model and trading discipline.
Poisson gives us the goal distributions for both teams. But a trader can't just stare at two distributions. Before placing an order, you need to know what scorelines these distributions generate, which score regions are thickest, and whether your view is best expressed by buying Team A to win or betting on Under. So, the next step is to overlay the two distributions into a score map directly connected to market choices.
2.2 Score Matrix: The True Engine of Single-Match Probability
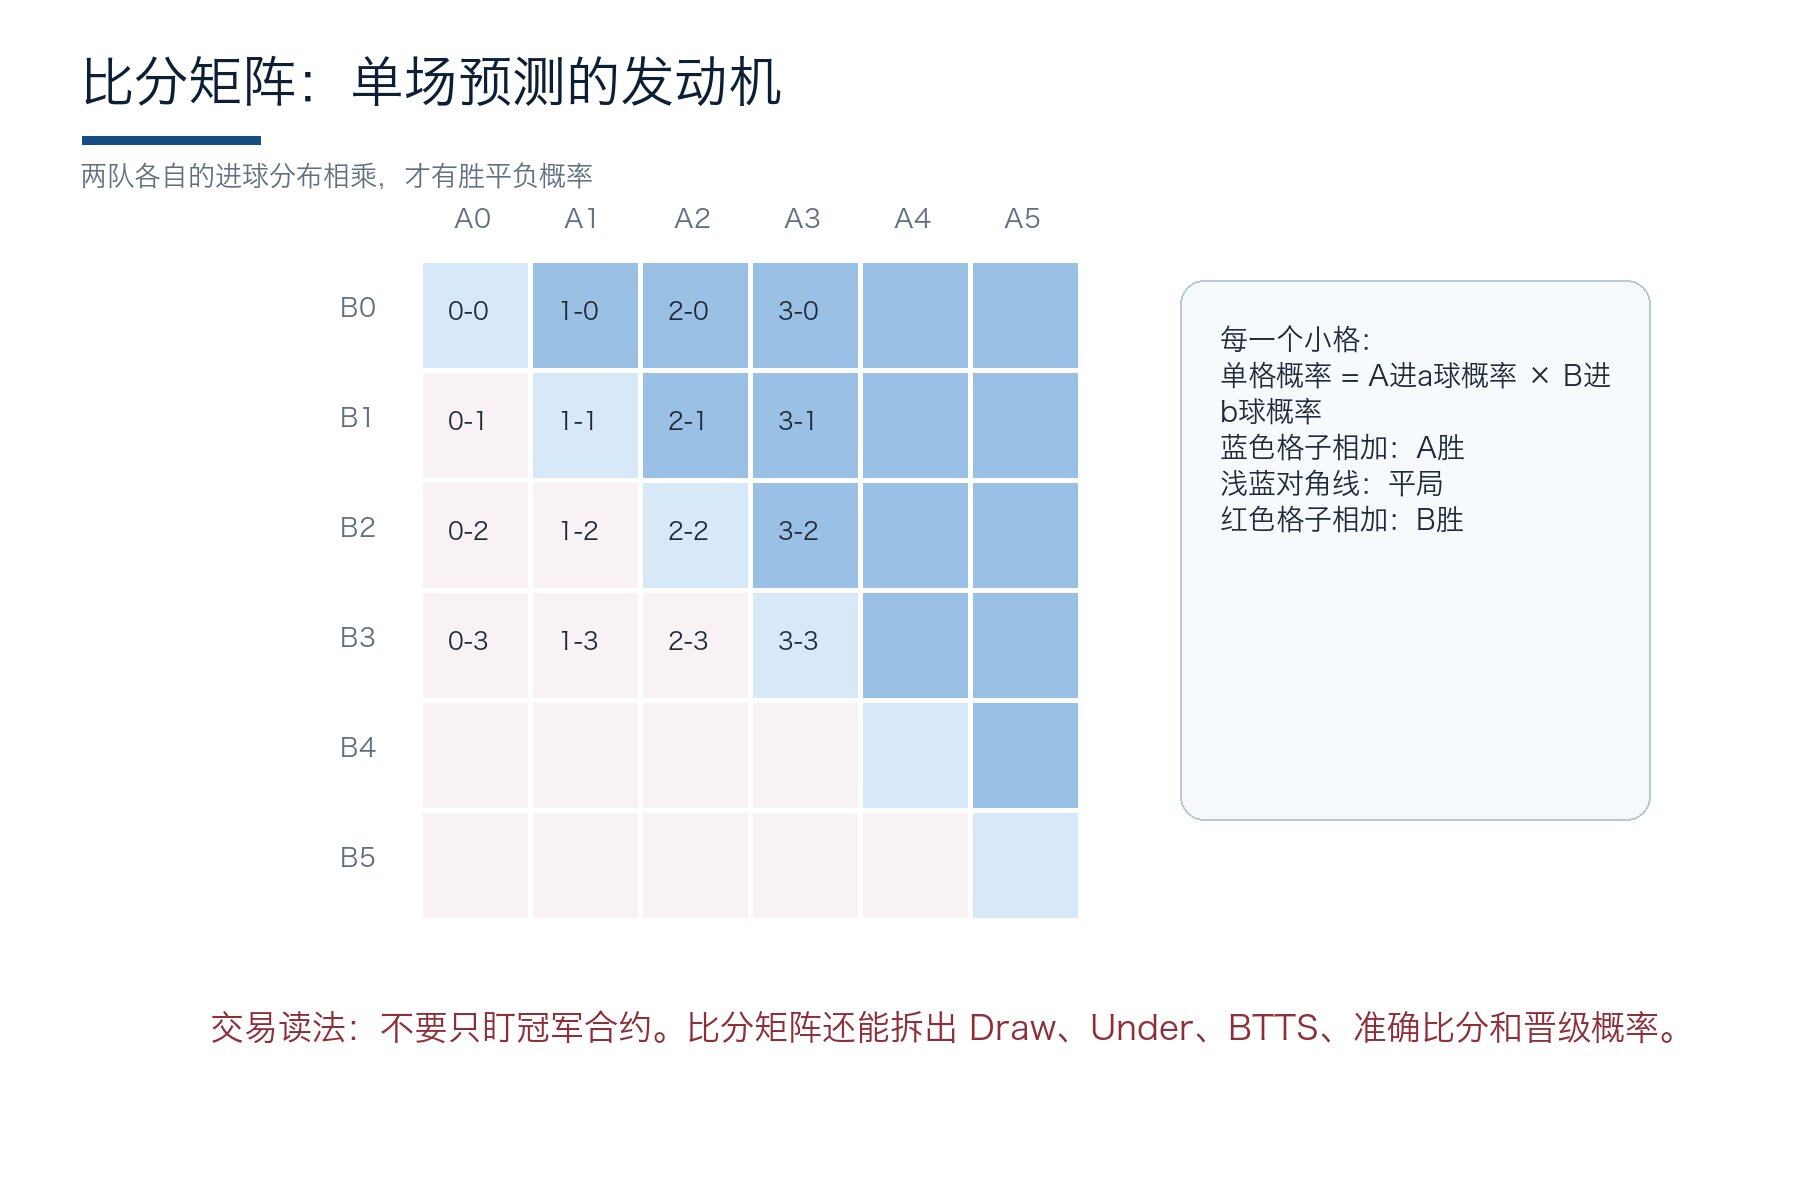
Figure 2: Score Matrix: Multiplying goal distributions for both teams, then aggregating into win/draw/loss and derivative markets.
Many newcomers directly jump to "what's this team's win probability?" A more trader-like approach is to first lay out the Score Matrix. Assume Team A's goal distribution is calculated, and Team B's is too. Multiply the probability of Team A scoring 'a' goals by the probability of Team B scoring 'b' goals to get the probability of the 'a-b' scoreline.
- The top-left of the matrix contains 0-0, 1-0, 0-1, 1-1; the bottom-right is the high-scoring tail.
- Summing all cells where A > B gives Team A's win probability (dark blue).
- Summing cells where A = B gives the draw probability (light blue).
- Summing cells where A < B gives Team B's win probability (red).
This process is slower than directly estimating a win probability, but it preserves structure. Structure is what can be reused in trading.
For example, two different matches might both give Team A a 55% win chance. The first comes from a high-tempo, open game (e.g., 2.0 vs 1.2 λ). The second comes from a low-tempo, grinding game (e.g., 0.9 vs 0.4 λ). The win probability is the same, but over/under, draw probability, red card sensitivity, and the chance of extra time in a knockout match are completely different. The market sometimes compresses these into the same headline probability; a model must disaggregate them.
This is why, during the World Cup, Draw and Under are often cleaner plays than outright Winner. The market is full of heroic narratives, and prices often favor popular teams. But the low-scoring cells quietly tell you: even strong teams can be dragged into a grind.
Practical Reference
The Score Matrix is best for dissecting a view. Say you favor Team A. But the matrix shows their win probability is concentrated in 1-0 and 2-0 results, not 3-1, 4-1. A more natural expression might not be buying Team A for a big win, but buying Team A to win, betting Under, or combining correct scores. Many losses aren't due to wrong direction, but buying the wrong market type.
In live trading, check the order book first. If the Team A win market has deep liquidity and the price is fully priced, but the Under ask is still low, your trade should shift to the market that better expresses your view.
Insiders.bot's order book analysis isn't just a decorative feature here. It solves a very real problem: can your model's marginal edge still be bought at an acceptable price?
The Score Matrix answers many questions, but it has a natural weakness: it looks too much like a calm mathematical table, easily underestimating the most sensitive low-scoring states in football. 0-0, 1-0, 0-1, 1-1 aren't just four cells; they correspond to a team's risk appetite, the match minute, and the group situation.
To make the model closer to real trading, we must pay special attention to these low-scoring regions.
Combining Poisson (2.1) and the Score Matrix (2.2), we finally see the full picture of this football strategy – the earliest and most commonly used World Cup prediction model: Dixon-Coles.
2.3 Dixon-Coles: Low-Scoring Regions Need Special Attention
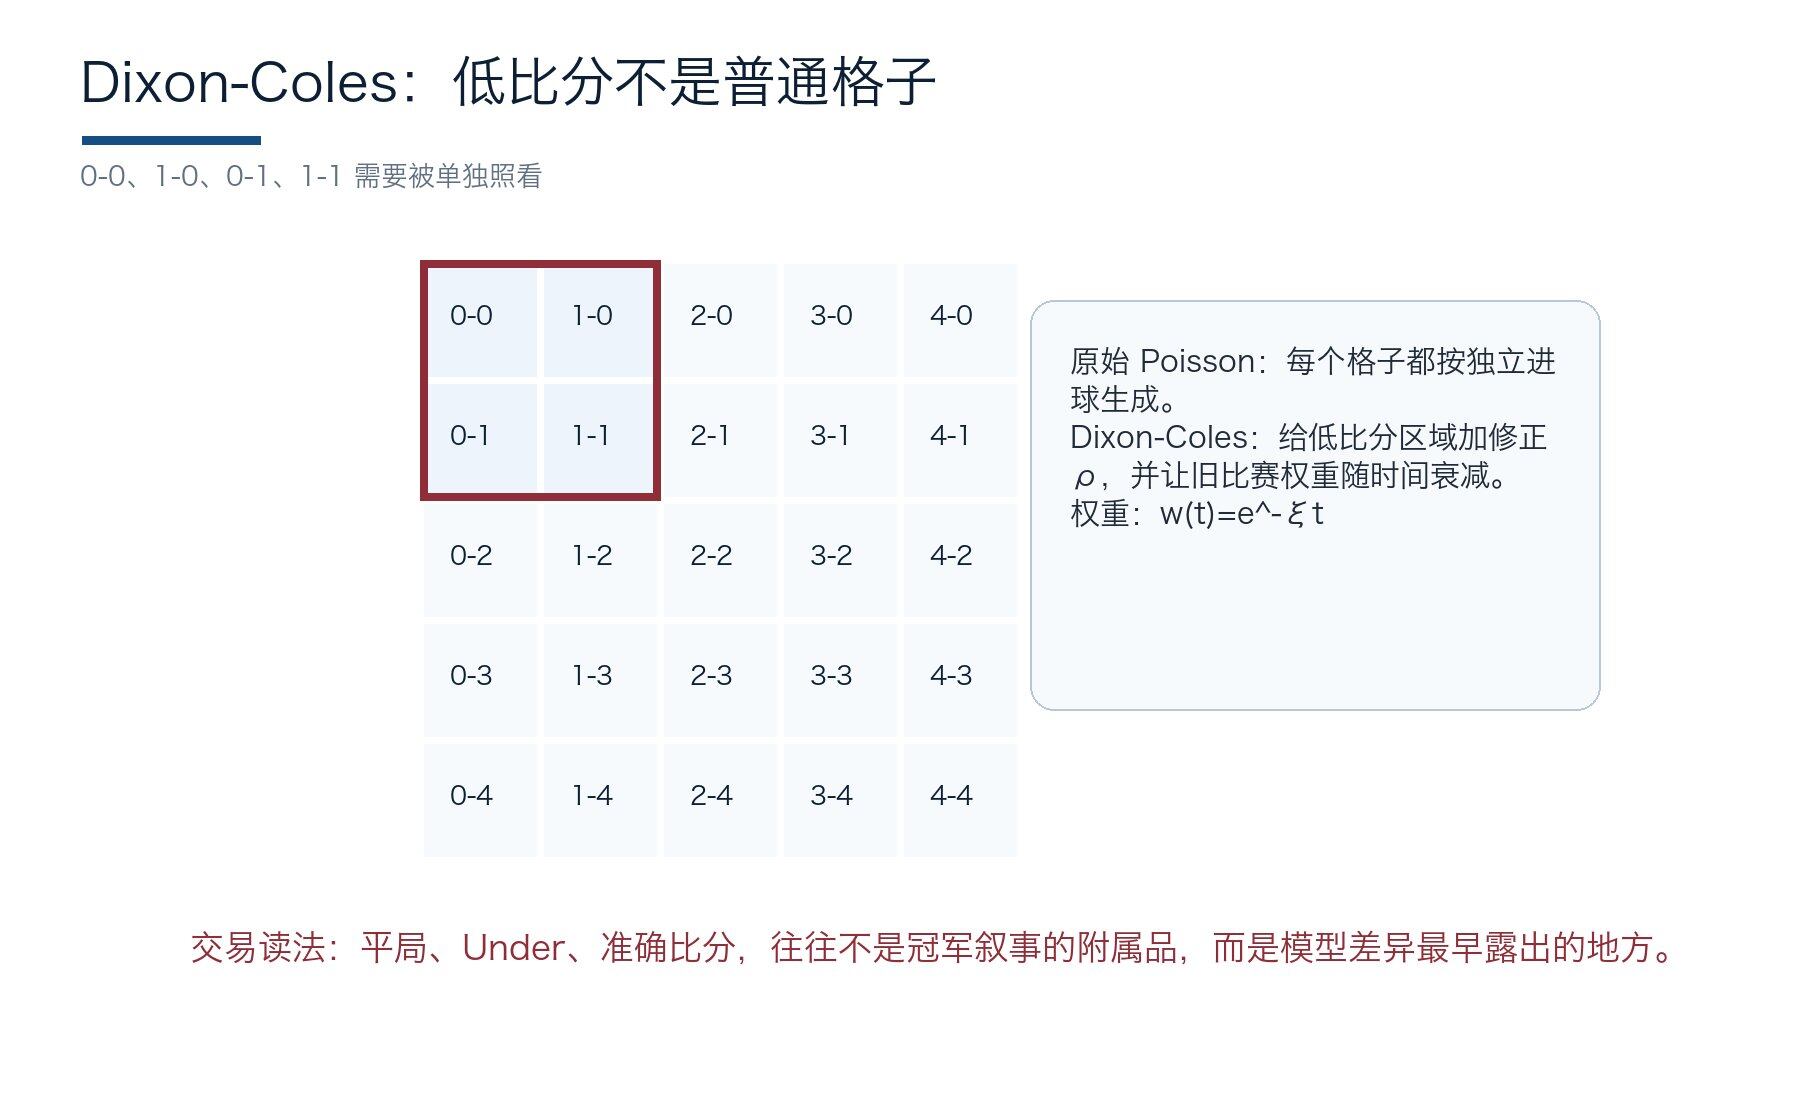 Figure 3: Dixon-Coles Adjustment:


