
火星成长学院|加密市场宏观研报:美联储权力交接,债券收益率飙升,流动性拐点或将至
- 核心观点:2026年5月,美联储换帅与全球债市收益率飙涨构成双重宏观压力,叠加ETF资金外流、现货/合约主动抛售及期权对冲需求激增三重抛压,导致比特币从82,000美元暴跌至76,800美元,市场进入宏观压力与机构化进程并存的转折期。
- 关键要素:
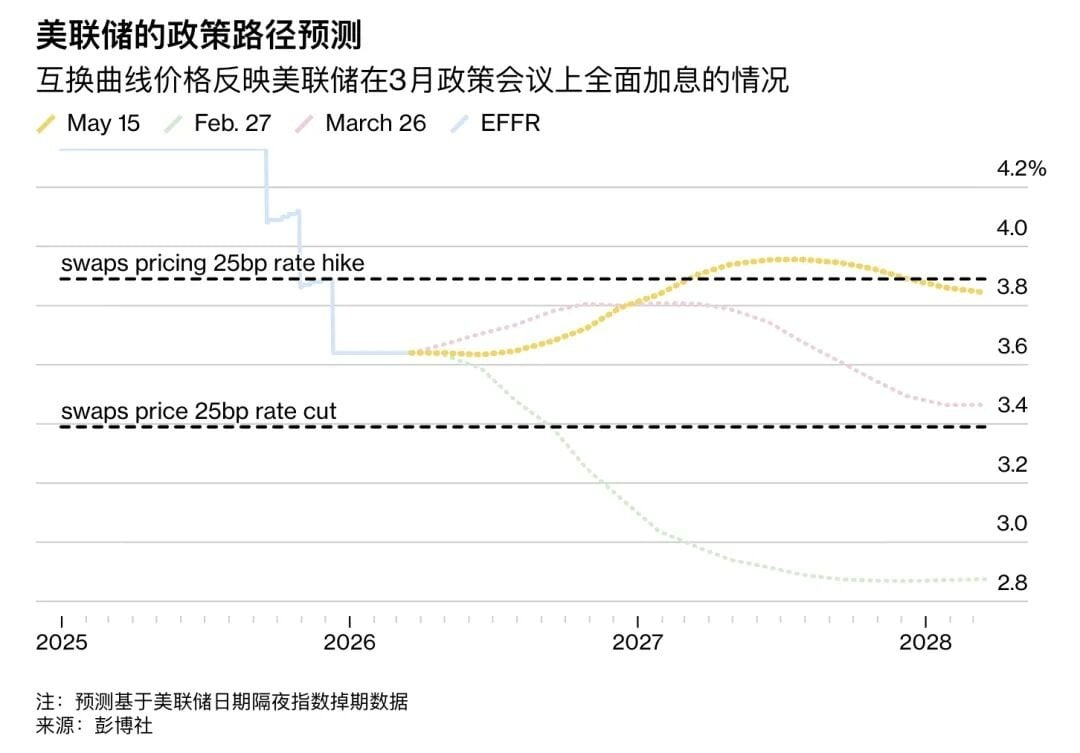
- 新任美联储主席沃什主张加速缩表、重新定义通胀目标及弱化前瞻指引,短期抗通胀任务对加密市场构成流动性压力,其上任首月PPI数据爆冷加剧紧缩预期。
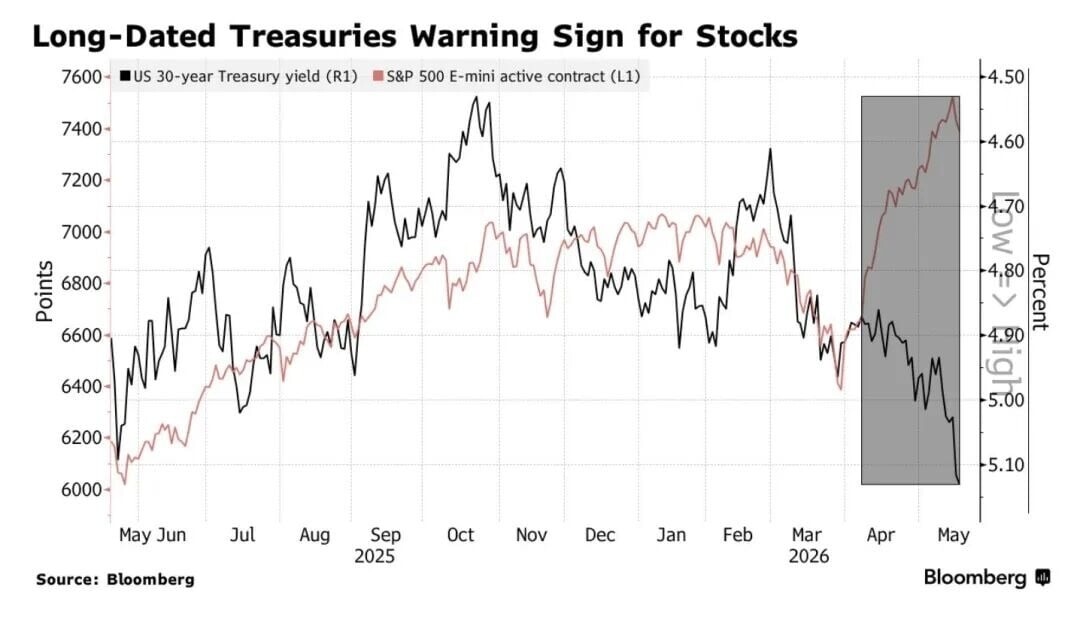
- 全球债市同步抛售:美国30年期国债收益率突破5.12%(2007年高点),市场降息概率骤降,加息预期升温,“更高更久”利率叙事打击风险资产。
- 三重抛压共振:ETF连续净流出超15亿美元;现货与永续合约双市场同步主动卖出;期权25-Delta偏度升至14.4%,对冲需求陡增。
- 滞胀风险升温:美国4月CPI升至3.8%、PPI同比暴涨6%,市场预计滞胀概率一个月内从11%跳升至40%,美联储陷入政策两难。
- 机构化进程未中断:Galaxy Digital推进AI算力转型;部分长期持有者趁低积累,交易所比特币净流入达16.8亿美元/周至冷钱包。
- 市场走势推演:区间震荡整固($75,000-$77,000,概率55%)、看涨反弹(宽松信号+地缘缓和,概率25%)、看跌深调(美债收益率超5.2%,概率20%)。
1. Warsh Takes Over: Fed Power Transition and Policy Logic Restructuring
On May 15, 2026, Jerome Powell formally stepped down as Chairman of the Federal Reserve, handing over on the day his term ended to Kevin Warsh, a researcher at Stanford University's Hoover Institution and former Fed governor. Warsh’s nomination was confirmed by a Senate vote of 54 to 45, a relatively close tally that signaled his policy stance would face sustained pressure from various quarters. On his first day in office, Wall Street appeared to close "decorously" with the Nasdaq Composite rising over 1%, but deeper currents of change were already stirring in market pricing.
Warsh’s policy agenda revolves around three main directions. First, accelerating the reduction of the Fed’s balance sheet. The current balance sheet size stands at approximately $6.7 trillion, a figure Warsh has criticized, advocating for more aggressive unwinding. Accelerating the balance sheet runoff would effectively drain liquidity directly from the financial system, pushing up long-term interest rates and tightening the overall monetary environment, posing systemic pressure on risk assets, including crypto assets. Second, redefining the inflation target. Warsh has questioned the authority of the 2% numerical target, leaning instead toward a more ambiguous "price stability" framework. This could mean a higher actual tolerance for inflation but also increases policy unpredictability and makes market forecasting more difficult. Third, downplaying forward guidance and the dot plot. Warsh advocates reducing or eliminating predictive tools like forward guidance and the dot plot to increase the Fed’s policy flexibility, but this would also amplify information friction between the market and the central bank, exacerbating short-term volatility.
For the crypto market, Warsh’s stance carries a subtle duality. Before being nominated as Fed Chair in January 2026, Warsh publicly called Bitcoin an "important asset" and a "good police officer for policy," showing a generally open attitude toward cryptocurrencies. However, this moderate position structurally conflicts with his immediate urgent tasks: facing a 6% year-over-year surge in PPI in his first month in office, Warsh must prioritize proving his anti-inflation credibility rather than advancing crypto-friendly policies. Therefore, in the short term, Warsh’s inflation-fighting mission puts liquidity pressure on the crypto market; in the long term, his attitude toward digital assets could create a friendlier regulatory soil for institutional entry into the crypto market. Balancing the two, the market remains more focused in the near term on when the liquidity tightening shoe will drop, rather than on distant regulatory dividends.
2. Bond Market Turmoil: Alarm Bells of a Global Liquidity Turning Point
If the Fed leadership change were merely a matter of expectation disturbance, the simultaneous turmoil in the bond market represents a more direct and tangible shock to risk assets. May 2026 witnessed a rare selloff in the global bond market, with government bond yields across multiple countries surging to multi-year or even multi-decade highs. The yield on the US 30-year Treasury bond broke through the 5% psychological barrier in mid-May, reaching 5.12%, the highest level since 2007; the 10-year Treasury yield climbed in tandem to 4.63%, a rare high in recent years. Japan’s 10-year government bond yield hit a 30-year high of 2.797%, the UK’s 30-year yield rose to 5.86%, France’s 30-year reached 4.675%, and even Germany’s 30-year yield, long near negative territory, climbed to 3.704%.
The immediate trigger for this global bond selloff was the surprisingly hot US April PPI data. PPI rose 1.4% month-over-month, far exceeding the market expectation of 0.3% and marking the largest single-month increase since 2022; year-over-year PPI reached 6%, nearly wiping out three years of the Fed’s anti-inflation efforts. As a leading indicator for CPI, the surge in PPI made the market realize that inflation is not retreating to the 2% target as anticipated, prompting an immediate global repricing. More critically, the expected path of rate cuts was completely shattered—before the selloff, the market widely anticipated two rate cuts in 2026, with the first in June considered almost certain; after the selloff, the probability of a June cut plunged to 15%, and expectations of a small rate hike even emerged, with the probability of a 25-basis-point hike by July 2027 rising to 60%. The "Higher for Longer" narrative returned with a vengeance.
The surge in bond yields transmits to the crypto market through multiple channels. First, rising opportunity costs: higher risk-free rates make non-yielding assets like Bitcoin less attractive compared to cash and short-term Treasuries. Second, declining risk appetite: under tightening liquidity expectations, high-beta assets face systematic selling. Third, a stronger US dollar: rising real interest rates typically accompany a stronger dollar, exerting additional downward pressure on dollar-denominated risk assets. Fourth, the leverage accelerator effect: the market had accumulated significant long leveraged positions in early May 2026, and margin calls triggered forced selling, creating a stampede-like deleveraging waterfall. Data shows that on the day Bitcoin fell to a low of $78,704 alone, over $304 million in leveraged long positions were liquidated across the market, including approximately $94 million in Bitcoin longs. This chain of transmission mechanisms collectively formed the macro foundation for this round of Bitcoin’s sharp decline.
3. Bitcoin Plunge: The $76K Key Support Defense and Triple Sell-off Resonance
In mid-May 2026, Bitcoin experienced a new round of sharp decline since the start of 2026 under the resonance of multiple macro pressures. It fell from around $82,000 to $76,800, a decline of approximately 6%, with over $304 million in leveraged long positions liquidated across the market. Notably, the peculiarity of this decline lies in the simultaneous appearance of triple sell-off signals, making it difficult for market participants to simply attribute it to a technical correction.
The first source of selling pressure came from the sustained withdrawal of institutional funds from ETFs. Since May 7, 2026, US spot Bitcoin ETFs have recorded consecutive net outflows, with a single-day outflow of $648 million, the highest since January 29; cumulative net outflows have exceeded $1.5 billion since May 7. This scale of institutional capital outflow indicates a fundamental shift in the macro pricing logic institutions apply to Bitcoin—no longer viewing it as a beneficiary of an accommodative monetary environment but beginning to hedge it within the pricing framework of traditional risk assets. ETF outflows are both a result and a cause of the decline: price drops trigger programmed stop-losses, which in turn exacerbate selling pressure, creating a negative feedback loop.
The second source of selling pressure came from simultaneous active selling in both the spot and perpetual contract markets. Glassnode data shows that the cumulative volume delta (CVD) in the spot market plummeted from +$16.9 million to -$126.2 million, while the CVD in the perpetual contract market recorded a large negative value of -$368.5 million. Both turning negative simultaneously indicates that sellers are actively selling in both the spot and futures markets concurrently, rather than being passively liquidated. This pattern of simultaneous active selling in both markets historically corresponds to a more prolonged selling cycle, as passive liquidation is a one-time event, while active selling reflects the seller's sustained bearish outlook on the future.
The third source of selling pressure came from a sharp increase in hedging demand in the options market. The 25-delta skew rose rapidly from 10.9% to 14.4%, reflecting a significant increase in market participants' demand for downside protection. A higher skew indicates stronger relative demand for put options, which is an instinctive reaction of institutional investors when faced with systemic risk exposure. Vikram Subburaj, CEO of India's Giottus exchange, pointed out that Bitcoin’s first support level is around $76,000, with a secondary support zone between $74,000 and $75,000. If this area is breached, it could trigger a deeper correction. From an on-chain data perspective, the $76,000 to $75,000 range corresponds to the price level before the ETF-driven rally in 2024 and is also a high-volume area for leveraged positions. If lost, technical stop-loss selling could trigger a larger-scale chain reaction.
4. Stagflation Risk Reignited: The Dual Dilemma of Sticky Inflation and Slowing Growth
US April CPI rose to 3.8% year-over-year, the highest level since June 2023; PPI surged 6% year-over-year, with a 1.4% monthly increase, the largest single-month gain since 2022. The probability of stagflation (the risk of a stagflationary shock before year-end) jumped from 11% to 40% within a month, and market pricing of "stagflation" is rapidly heating up. The frightening aspect of this data is not just the numbers themselves, but their fatal compression of the Fed's policy space: traditionally, responding to an economic slowdown requires rate cuts, but high inflation prevents the Fed from cutting; responding to inflation requires rate hikes, but signs of slowing economic growth limit the room for hikes. The Fed is caught in a "policy dilemma," and the persistence of this dilemma is itself the biggest source of market uncertainty.
The impact of rising stagflation risk on the crypto market is particularly complex. From a nominal interest rate perspective, high inflation pushes nominal rates higher, raising the risk-free return benchmark and increasing the opportunity cost of holding zero-yield assets like Bitcoin. From a real interest rate perspective, if nominal rates rise less than inflation, real rates could still fall, theoretically providing some support for Bitcoin. However, the peculiarity of this round is that the Fed's policy response is noticeably lagging—the market has already begun repricing rate hikes, while the Fed is still in a transition period with a new chair. This "policy vacuum" prevents the market from relying on the "Fed put" (the implicit promise of central bank intervention during sharp market declines), amplifying the magnitude of downward volatility.
Meanwhile, global risk assets are experiencing a synchronized decline. South Korea’s KOSPI index fell 6.12% in a single day, triggering a circuit breaker; Japan’s Nikkei 225 fell 6.22%; the Nasdaq fell 1.54%; and China’s Shanghai Composite fell 2.5% over two days. This pattern of synchronized cross-market declines indicates that this adjustment is not an isolated event in the crypto market but a systemic reflection of global liquidity tightening across various risk assets. The bond market "sounded the alarm" for both the AI bull market and the crypto market—when the "safety cushion" of risk-free rates disappears, all high-valuation assets relying on future discounted cash flows face repricing pressure.
5. Market Structure Observation: Institutionalization Progress and Internal Divergence
Despite the sharp short-term price decline, the institutionalization process of the crypto market has not been interrupted by this adjustment. Galaxy Digital successfully delivered the first phase for its inaugural institutional Bitcoin mining-related investment product, delivering the first Phase 1 data hall to CoreWeave (CRWV) on time and on budget. This marks the transition of Bitcoin mining infrastructure toward AI/HPC compute leasing entering a substantive commercialization phase. The continuation of this structural trend indicates that, on a longer-term dimension, institutional funds are still systematically increasing their allocation to underlying crypto assets, rather than abandoning their deployment due to short-term volatility.
At the same time, divergence within the crypto mining camp is intensifying. Keel Infrastructure (formerly Bitfarms) reported a Q1 2026 net loss of $145.4 million and a 23% year-over-year revenue decline to $37 million. However, its stock price rose over 8% on the earnings release day, as market focus was not on the loss itself but on whether its 2.2 GW AI/HPC data center development pipeline could convert into formal leases between 2027 and 2028. This narrative of "exchanging Bitcoin mining tail assets for long-term AI infrastructure leases" is becoming the most recognized logic line within the mining transition camp.
On-chain data also shows a divergence characterized by "accumulation amidst panic." Despite significant ETF outflows, Bitcoin net inflows to exchanges are accelerating, with approximately $1.68 billion flowing into cold wallets weekly, indicating that some long-term holders are accumulating coins at lower prices. The supply of long-term holders is stabilizing, and the selling of high-cost coins in the $100,000 to $126,000 range has largely been completed, meaning potential selling pressure has been substantially released. Historically, when the derivatives market is in an extremely bearish positioning (30-day funding rate at the 6th percentile, the lowest since early 2023), it often precedes a sharp rebound rather than a continued decline—because when virtually all participants are already short, additional selling pressure is limited, but any catalyst for a rebound could trigger significant short covering, providing fuel for a "V-shaped reversal."
6. Conclusion: Three-Scenario Analysis and Investment Framework
Looking ahead to the crypto market in late May and June 2026, the probabilities and trigger conditions for three scenarios warrant close attention. The most likely scenario is a "range-bound consolidation": Bitcoin finds technical support in the $75,000 to $77,000 range, and the market digests macro headwinds while awaiting new catalysts. If bond yields can stabilize and the $76,000 support holds, the market may enter a 2-to-4-week consolidation period, waiting for the next directional signal. In this scenario, the crypto market overall displays a "can't fall, can't rise" pattern, with alpha opportunities more likely from individual coin selection rather than systematic long positioning.
A bullish scenario requires a confluence of two or more positive catalysts: first, clear accommodative signals from the Fed or Warsh (e.g., a dovish stance at the June FOMC meeting); second, a substantial de-escalation of geopolitical tensions in the Middle East (e.g., the Strait of Hormuz issue returning to the negotiating table); third, confirmation that April inflation data is retreating. If all three conditions are met simultaneously, revived rate-cut expectations could drive Bitcoin to quickly reclaim the $80,000 integer level and potentially challenge the $85,000 to $87,000 range. The probability of the bullish scenario is currently assessed at around 25%, with the main obstacle being that Warsh is unlikely to pivot quickly toward accommodation early in his term.
The bearish scenario is the direction requiring the most caution currently: if the 30-year US Treasury yield continues to climb and effectively breaks through the 5.2% to 5.3% range, the rapid rise in risk-free rates could open up downside room to $74,000 to $75,000; a more extreme tail risk involves opening the $54,000 to $38,000 channel (corresponding to Stifel's trendline analysis target), which would mean a complete retracement of the 2025 bull market gains and a significantly prolonged bear market. The bearish scenario currently has a probability of around 20%, but the risk-reward is asymmetric—once the $74,000 support level is lost, programmed stop-losses could trigger a stampede, driving the decline beyond what is fundamentally justified.
In summary, the current market is in a structural inflection point where "macro stress testing" coexists with "deepening institutionalization." The bond market alarm has not yet been lifted, and the $76,000 to $75,000 support zone faces a severe test. However, against the backdrop of extreme bearish sentiment, continued accumulation by long-term holders, and the ongoing evolution of the mining transition narrative, signs of a market bottom are also gradually accumulating. Investors should maintain position flexibility at this stage, avoiding aggressive chasing of dips or heavy bottom-fishing, and patiently wait for the macro inflection point to emerge. When the "Fed put" becomes effective again and bond yields turn downward, the next upswing in the crypto market will have a more solid macro foundation.


