






Chỉ số kinh tế hàng đầu của Hoa Kỳ sẽ được công bố tối nay, chỉ số này đưa ra câu trả lời về suy thoái và hạ cánh mềm sớm hơn cuộc họp của Fed


- Quan điểm trọng tâm: Bài viết tập trung vào chỉ số kinh tế hàng đầu tháng 6 sắp được công bố của Hoa Kỳ, chỉ ra rằng chỉ số này có giá trị tín hiệu quan trọng trong giai đoạn trống chính sách trước cuộc họp của Fed về lãi suất. Câu hỏi cốt lõi là đánh giá xem sự cải thiện kinh tế là sự phục hồi thực chất của thực thể, hay chỉ là 'ảnh phản chiếu' do giá tài sản thúc đẩy.
- Các yếu tố chính:
- Chỉ số kinh tế hàng đầu tháng 5 tăng tháng thứ hai liên tiếp, mức giảm sáu tháng thu hẹp xuống còn 0,3%, cho thấy xu hướng cải thiện.
- Tuy nhiên, sự cải thiện của tháng 5 hoàn toàn do các yếu tố tài chính như giá cổ phiếu và chênh lệch lãi suất thúc đẩy, các mặt phi tài chính (như kỳ vọng của người tiêu dùng) vẫn yếu.
- Trong lịch sử, chỉ số này thường đạt đỉnh 11-12 tháng trước suy thoái, tốc độ tăng trưởng sáu tháng hiện tại cao hơn nhiều so với ngưỡng kích hoạt suy thoái truyền thống khoảng -4%, cho thấy kinh tế chậm lại chứ không phải suy thoái.
- Chỉ số trễ tháng 5 giảm nhẹ so với tháng trước, nhưng thay đổi sáu tháng là dương, kết hợp với chỉ số hàng đầu cho thấy đặc điểm giai đoạn giữa và cuối của chu kỳ 'hạ cánh mềm'.
- Nhà đầu tư nên tập trung vào các yếu tố phi tài chính (đặc biệt là kỳ vọng người tiêu dùng và đơn đặt hàng mới) có chuyển sang dương hay không, để đánh giá sự xác nhận từ phía thực thể của câu chuyện hạ cánh mềm.
At 10:00 AM Eastern Time on July 20, the US Conference Board will release the Leading Economic Index (LEI) for June, marking the earliest macro data point of the week. This release warrants serious attention because, with the Federal Reserve's Federal Open Market Committee (FOMC) meeting on July 28-29 still over a week away, the market lacks authoritative policy guidance. This indicator offers an alternative clue. It does not predict interest rates but measures the economy's momentum, making it suitable as a supplementary signal for assessing recession risks, the probability of a soft landing, and corporate earnings prospects. The May reading rose for the second consecutive month, with the six-month contraction narrowing to 0.3%. However, the driving force came almost entirely from financial components like stock prices and interest rate spreads, while non-financial aspects remained weak. The June data must answer a direct question: is the economic improvement real, or merely a reflection of asset prices?
Key Takeaways
The official announcement from the Conference Board confirms that the next US Leading Economic Index release is scheduled for Monday, July 20, at 10:00 AM ET, making it one of the earliest macro data points this week.
The May reading was 99.3 (2016 = 100), up 0.1% month-over-month, marking the second consecutive month of increase (April was +0.2%).
The key improvement lies in the trend: the six-month contraction from November 2025 to May 2026 narrowed to 0.3%, significantly less than the 1.3% contraction in the previous six months.
However, there are concerns about the underlying structure. The institution explicitly stated that the May rise was entirely contributed by financial components, especially stock prices and interest rate spreads. On the non-financial side, only the ISM New Orders Index showed some strength, while consumer expectations remained the primary drag.
For the same period, the Lagging Economic Index (LAG) stood at 120.5, down 0.1% month-over-month, but its six-month change was solidly positive, growing 0.9%. The combination of the LEI and LAG still points towards slowing growth rather than a recession.
Historically, the LEI typically peaks 11 to 12 months before the start of a recession. The current negative range of its six-month growth rate is not yet close to the traditional recession trigger threshold of approximately -4%.
Why This Data is Particularly Important This Week
A Substitute Signal During a Policy Vacuum
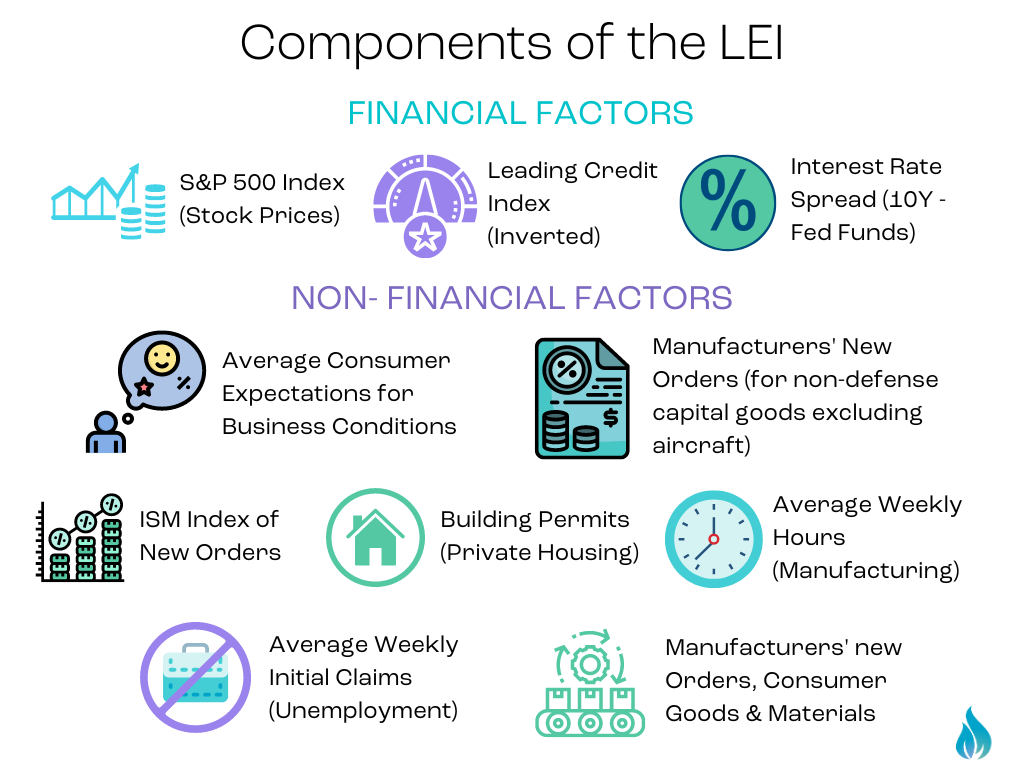
The timing determines its significance. The Fed's FOMC meeting is not until July 28-29, meaning from today until next Tuesday, the market has no official policy guidance. In such a vacuum, any data with forward-looking attributes will be amplified in interpretation. The LEI consists of ten components covering new orders, building permits, initial jobless claims, consumer expectations, stock prices, and interest rate spreads. It measures the direction of economic momentum over the next few quarters, not the current state of the economy. This is precisely why it is suitable as a supplementary signal rather than a trading signal.
It's Not Used to Predict Interest Rates
One thing needs to be clear: this indicator is unsuitable for betting on the Fed's next move. Among its ten components, stock prices and interest rate spreads are themselves products of market pricing. Using it to predict interest rates is methodologically close to circular reasoning. Its real purpose is to answer three other questions: the direction of recession risk, the credibility of the soft-landing narrative, and the support for corporate earnings over the next few quarters. These three factors can impact the pricing of stocks, credit, and risk assets no less than a change in wording at a single meeting.
Foreshadowing from the May Reading
The Numbers Themselves Show Improvement
The May data released on June 18 showed the LEI edged up 0.1% month-over-month to 99.3, rising for the second consecutive month. More importantly, the six-month change: the contraction from November 2025 to May 2026 was only 0.3%, while the previous six months (May 2025 to November 2025) saw a contraction as high as 1.3%. A narrowing of three-quarters of the decline represents the most significant trend improvement since 2025.
But the Structure is Unhealthy
The institution offered a candid qualification in the same announcement. Justyna Zabinska-La Monica, Senior Manager of Business Cycle Indicators, explicitly stated that the May rise was entirely driven by financial components, especially stock prices and interest rate spreads. On the non-financial side, only the ISM New Orders Index showed some strength; consumer expectations remained the primary drag. She also emphasized that despite two consecutive monthly increases, the six-month and twelve-month growth rates of the index remain negative, pointing to slowing economic expansion ahead.
This structural issue is key to understanding the June data. If the June improvement continues to rely on stock prices, then this indicator reflects less an economic recovery and more a self-reinforcement of asset prices. A truly convincing signal would be non-financial components like consumer expectations, new orders, or building permits turning positive.
How to Interpret Recession Signals and the Soft-Landing Narrative
Three Judgement Dimensions
The institution assesses the severity of downside signals using three dimensions: duration, depth of decline, and breadth of diffusion. Historical patterns show the LEI typically peaks 11 to 12 months before a recession begins. Recession Dashboard tracking notes that while the current six-month growth rate is negative, it is far above the traditional recession trigger level of around -4%. The institution's assessment is a slowdown, not a recession.
Another technical detail worth noting is whether the diffusion index falls below 50. In mid-2025, the index was below 50 for several months, triggering a recession signal, but recent readings show this pressure has eased. The position of the diffusion index in the June data is a direct window into the strength of the signal.
Reading in Combination with the Lagging Index
Looking solely at the LEI can be misleading; cross-referencing it with the LAG is more reliable. The May LAG was 120.5, down slightly by 0.1% month-over-month, but its six-month change was +0.9%, significantly stronger than the flat reading in the previous six months. A weakening LEI alongside a strengthening LAG is a classic characteristic of the mid-to-late cycle phase, typically corresponding to a state of slowing growth that hasn't stalled – the soft-landing scenario markets speak of. If the June data shows an improving LEI while the LAG weakens, it would signify a more substantial change in the cyclical position.
Implications for Investors
Three Transmission Channels
First is the corporate earnings channel. Components like new orders and consumer expectations lead corporate revenue by approximately two to three quarters. Their direction directly relates to management's outlook for the second half of the year provided during the upcoming earnings season. Second is the risk appetite channel. If data confirms the soft-landing narrative, tolerance for risk asset valuations will increase; if non-financial components continue to deteriorate, the market will begin pricing in earnings downgrades. Third is the policy expectation channel. Although this indicator does not directly impact the July FOMC decision, it will influence market pricing for the path in September and beyond.
For cross-asset investors, macro turning points often first manifest in such forward-looking indicators before transmitting to risk assets. Digital assets are also affected by this chain. Investors tracking the linkage between macro variables and crypto assets can observe price reactions during risk appetite shifts on MEXC.
Potential Risks and Points to Watch
There are three types of risks. First is interpretation risk: this is a monthly indicator, single-month fluctuations are noisy, and the six-month growth rate and diffusion index carry more information than the month-over-month figure. Drawing conclusions from one month's direction is error-prone. Second is structural risk: if improvement continues to be driven by stock prices, a market correction would quickly reverse the index. Such improvement propped up by asset prices lacks resilience. Third is lag risk: historically, the indicator peaks 11 to 12 months ahead of a recession. This lead time means it's good at indicating direction but poor at pinpointing timing. Using it for market timing is almost certain to fail.
Another thing to watch for is whether this release includes an annual benchmark revision. Historically, such revisions recalculate the complete historical series, making the revised level values and month-over-month changes incomparable with previously released data. This is a technical trap easily overlooked when interpreting the data.
Exclusive Opinion from the MEXC Crypto Pulse Research Team
The truly important aspect of this data is not its ability to predict a recession, but rather that it quantifies an acute current question: is the economic improvement real or just a self-fulfilling prophecy of financial asset prices? The May reading already provided an uncomfortable answer – the rise came entirely from stock prices and interest rate spreads. When an indicator designed to measure the real economy's prospects is primarily supported by asset price components, it loses some of its informational value independent of the market. Whether the June data can break this cycle is far more important than whether the reading itself rises or falls by a few tenths of a percentage point.
There are two likely areas of market misinterpretation. First, treating two consecutive monthly increases as confirmation of a turning point. The six-month and twelve-month growth rates are still negative; these smoothed indicators are the true judges of the trend, while the month-over-month number has far more noise than signal. Second, trading this indicator as a Fed forward guide. Its ten components already embed market pricing; using it to derive the policy path is logically self-referential, posing the risk of mistaking market sentiment for independent evidence.
The most critical thing for investors to focus on next is not the headline reading, but the component structure: whether non-financial components, especially consumer expectations and new orders, begin to contribute positively. If these turn positive, the soft-landing narrative gains confirmation from the real economy. If they continue to drag, then the current improvement is merely a byproduct of the stock market bull run, its sustainability entirely dependent on the risk assets themselves.
The insight for crypto and cross-asset markets is this: during a policy vacuum, market sensitivity to any forward-looking data systematically increases. Digital assets, as high-beta proxies for liquidity and risk appetite, often exhibit more volatile swings than stocks at such times. Understanding the transmission chain of macro data is more valuable than chasing the rise or fall of a single number. This is why, in the week leading up to the FOMC meeting, understanding the structure of the leading indicator is more important than memorizing its value.
Frequently Asked Questions
When will the US Leading Economic Index be released?
The Conference Board is scheduled to release the June reading on Monday, July 20, 2026, at 10:00 AM ET, making it one of the earliest macro data points this week. The previous release was on June 18, covering the May data. The index is published monthly, typically alongside the Coincident Economic Index and Lagging Economic Index. Investors can access the full press release and component data on the institution's official website.
What exactly does this index measure?
It comprises ten components covering manufacturing new orders, building permits, initial jobless claims, consumer expectations, stock prices, interest rate spreads, etc. Its design purpose is to signal peaks and troughs in the business cycle. It measures the direction of economic momentum over the next few quarters, not the current state. Historical patterns show the index typically peaks 11 to 12 months before the start of a recession, making it better suited for judging direction rather than timing.
What was the level of the last reading?
The May reading was 99.3 (2016 = 100), up 0.1% month-over-month, marking the second consecutive monthly increase (April was +0.2%). More noteworthy is the trend improvement: the six-month contraction from November 2025 to May 2026 narrowed to 0.3%, significantly less than the 1.3% contraction in the prior six months. However, the institution explicitly stated that the rise was entirely driven by financial components like stock prices and interest rate spreads, and the six-month and twelve-month growth rates remain negative.
Will this data affect the Fed's July decision?
Its direct impact is limited. The Fed's FOMC meeting is scheduled for July 28-29, and the decision will primarily rely on inflation and employment data. The index's ten components already include market-pricing products like stock prices and interest rate spreads. Using it to derive the policy path involves circular reasoning. It is more suitable as a supplementary signal for recession risk, soft-landing probability, and corporate earnings prospects rather than as an interest rate prediction tool.
Does the current reading mean recession risk is rising?
The institution's current assessment is a slowdown, not a recession. Although the six-month growth rate remains negative, it is far above the traditional recession trigger level of around -4%, and the rate of decline is narrowing. For the same period, the six-month change in the Lagging Index is +0.9%, and its combination with the LEI points to slowing growth that hasn't stalled. Assessing recession signals requires considering three dimensions: duration, depth of decline, and breadth of diffusion. A single month of data is insufficient to draw a conclusion.
Which components should investors focus on?
The component structure carries more informational value than the headline reading. The most critical thing is whether non-financial components turn positive, especially consumer expectations and manufacturing new orders. The former is currently the primary drag, while the latter leads corporate revenue by about two to three quarters. If these components begin to contribute positively, the soft-landing narrative gains confirmation from the real economy. If improvement continues to be supported by stock prices, a market correction would quickly reverse the index; such improvement lacks resilience.
How is this macro indicator related to the crypto market?
The connection lies in the transmission of risk appetite. Digital assets are high-beta proxies for liquidity and risk appetite. The direction of macro momentum influences the pricing of crypto assets through the risk appetite channel. During the Fed's policy vacuum, market sensitivity to any forward-looking data increases, and crypto assets often exhibit more volatile swings than stocks. Furthermore, if the data points to pressure on corporate earnings, overall valuation tolerance for risk assets declines, and digital assets are also affected by this.
Disclaimer
This content is for informational and research discussion purposes only and does not constitute investment advice, financial advice, legal advice, tax advice, or trading recommendations. Prices of crypto assets, stocks, and related financial instruments can be highly volatile. Macroeconomic indicators are subject to revision and lag. Historical patterns do not guarantee future results. Third-party data and institutional announcements cited may involve delays, revisions, or errors. Readers should conduct their own verification. Any investment decision should be based on independent personal research, financial situation, and risk tolerance. Where necessary, consultation with a licensed professional is advised. The MEXC Crypto Pulse team assumes no responsibility for any direct or indirect losses resulting from the use of information contained in this content.


