






比互联网泡沫更克制,却更危险?贝莱德拆解AI行情真相


- Core Thesis: BlackRock believes the AI rally is not a bubble; the key lies in whether earnings growth can be sustained. While AI's cumulative gain (569%) is only about half of the dot-com bubble (1097%), the current market cap share of tech stocks (37.5%) and the Shiller P/E ratio (40x) have either surpassed or equaled the peak of the 2000 bubble. The core market contradiction lies in the tension between overheated long-term valuations and robust short-term earnings momentum.
- Key Elements:
- Gains & Concentration: Since 2019, the AI rally has gained 569% cumulatively, lower than the dot-com bubble's 1097%, but tech stocks' share of the total US market cap has broken 37.5%, exceeding the dot-com bubble era.
- Valuation Split: The S&P 500 Shiller P/E ratio (a long-term indicator) has reached 40x, matching the bubble peak. However, the forward P/E ratio (short-term) is only 21x, as earnings expectations have kept pace with rising stock prices.
- Earnings Support: S&P 500 Q2 earnings are expected to grow 23% year-over-year, marking the seventh consecutive quarter of double-digit growth. Earnings growth for the Mag 7 mega-cap tech stocks is expected to exceed 30%.
- Investment Logic Divergence: The current ratio of corporate capital expenditure to free cash flow is below 1 (funded mainly by internal capital), far below the dot-com bubble's ratio of 4x (heavily debt-financed), indicating a more solid financial foundation.
- BlackRock's Assessment: Betting that AI is a bubble is a significant wager, as it assumes AI won't generate lasting productivity breakthroughs. BlackRock is overweight on US stocks, with a preference for scarce AI inputs (power, chips, data centers).
Original Author: Monday, Deep Tide TechFlow
Deep Tide Intro: BlackRock's latest report draws a direct comparison between the current AI bull market and the internet bubble of the 1990s: US tech stocks rose a cumulative 1,097% from 1993 to 1999, while the AI market has risen 569% since 2019. The gain is only half of that period, but the S&P 500 Shiller P/E ratio has returned to 40x (equal to the peak of the 2000 bubble), and tech stocks' share of the US stock market capitalization has exceeded 37.5%, surpassing the internet bubble era.
BlackRock's conclusion: AI is not a bubble, but only if earnings growth can materialize.
In its latest weekly commentary released on July 7, BlackRock directly addressed the market's most pressing question: Is AI a bubble?
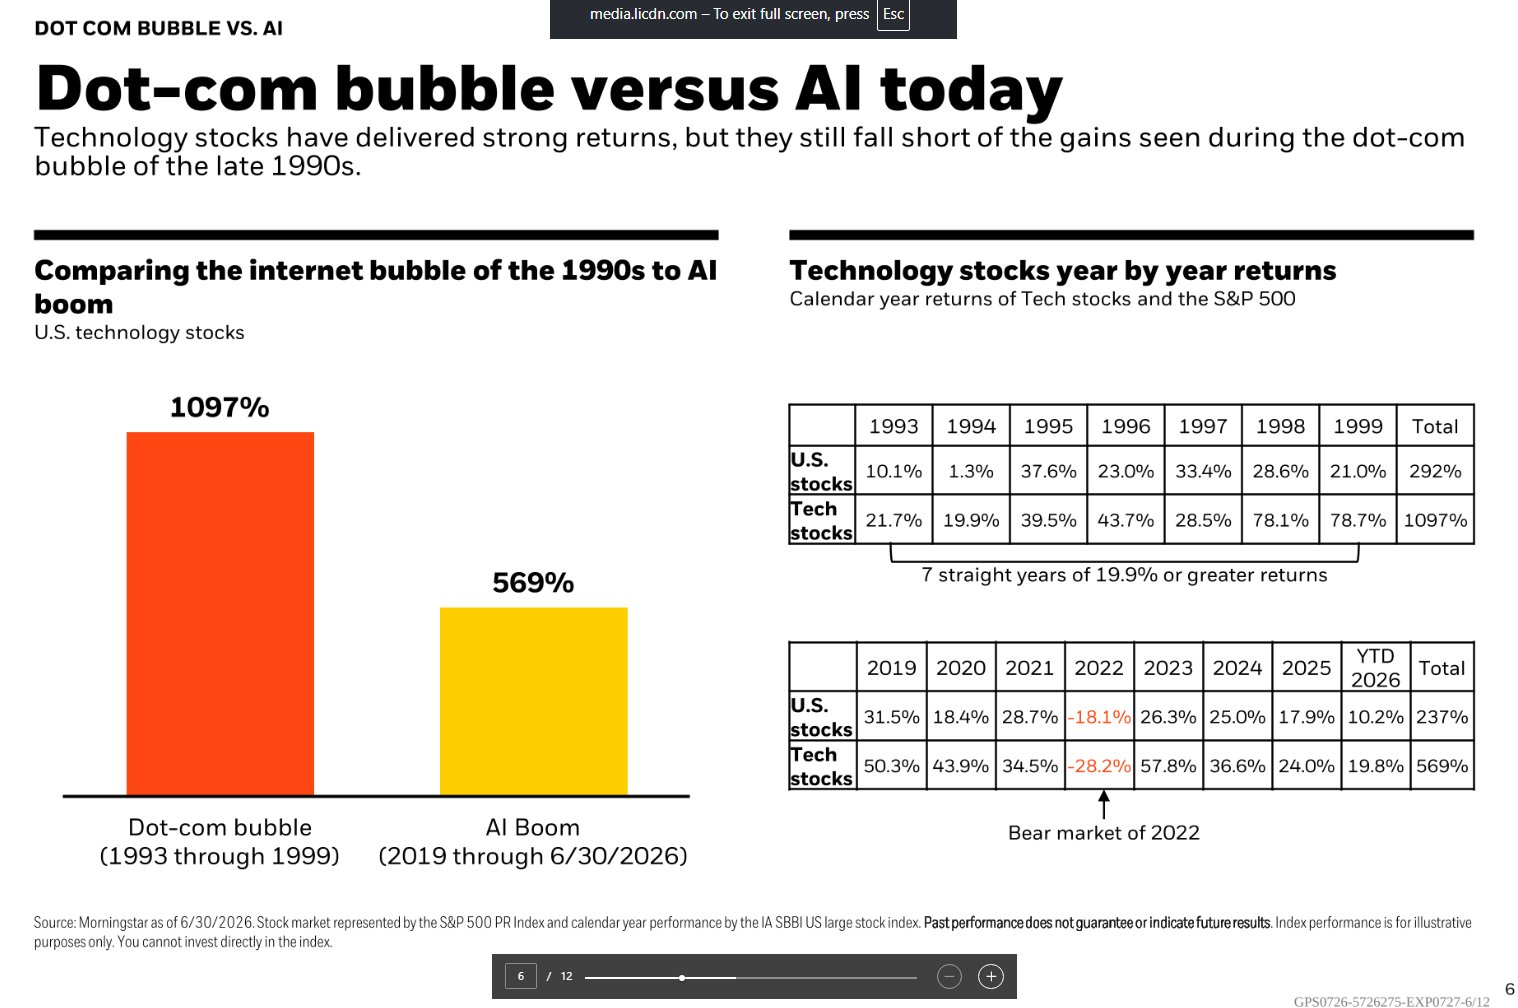
The answer from the world's largest asset manager is that the key lies not in where valuations stand relative to history, but in whether earnings growth can be sustained. Meanwhile, analyst Mike Zaccardi shared on X platform a data comparison chart from a BlackRock internal presentation, visually comparing the internet bubble from 1993 to 1999 with the AI rally from 2019 to present. The data source is Morningstar, as of June 30, 2026.
The conclusion is straightforward: The AI rally has accumulated a gain of 569%, just over half of the 1,097% during the internet bubble era. But more important than the magnitude of gains is whether the fundamentals supporting this rally are more solid than they were back then.
Tech Stocks Rose 569% in 7.5 Years, Internet Bubble Rose 1,097% in Same Period
According to data cited by BlackRock from Morningstar, US tech stocks accumulated a gain of 1,097% over the seven years from 1993 to 1999, while the overall US stock market rose 292%. Tech stocks achieved an annualized return of no less than 19.9% for seven consecutive years, reaching 78.1% and 78.7% in 1998 and 1999, respectively.
In the AI rally cycle from 2019 to June 30, 2026, tech stocks delivered a cumulative return of 569%, compared to a 237% return for the overall US stock market. This period included a significant drawdown in 2022 (tech stocks fell 28.2% for the year), but rebounded 57.8% in 2023, rose 36.6% and 24.0% in 2024 and 2025 respectively, and gained another 19.8% in the first half of 2026.
The divergence between the two cycles is evident in the latter half. The internet bubble accelerated towards its peak in the final two years, with cumulative gains in 1998 and 1999 approaching 200%. The acceleration phase of the AI rally occurred in 2023 (recovering from the 2022 trough), but annualized gains have gradually narrowed since then. In other words, the pace of the AI rally is more restrained than the internet bubble, but market disagreement is growing over how far it is from a 'blow-off top' phase.
Shiller P/E Back to 40x, But Forward P/E Only 21x
The S&P 500's Shiller CAPE ratio has climbed to 40x, returning to the level seen during the internet bubble era. This is a classic metric for gauging whether long-term valuations are overheated, calculated using inflation-adjusted average earnings over the past 10 years. A 40x ratio means investors are paying $40 for every dollar of long-term average profits, a level historically only reached around the year 2000.
However, BlackRock points out that the 12-month forward P/E ratio offers a more balanced perspective. Currently around 21x, valuations appear less stretched because earnings expectations have risen in tandem with stock prices.
S&P 500 second-quarter earnings are expected to grow 23% year-over-year, marking the seventh consecutive quarter of double-digit growth. BlackRock emphasizes that such earnings growth rates are extremely rare historically. BlackRock CIO Rick Rieder revealed at the CNBC CEO Summit on June 2 that the Mag 7 tech giants currently have a P/E ratio of 26x, with earnings growth expected to exceed 30% (composite growth around 27.6%). The S&P 500 forward P/E is 21x, with one-year earnings growth forecasts slightly above 20%.
The divergence between these two metrics constitutes the core contradiction of the current market: long-term valuation indicators are flashing bubble signals, but short-term earnings momentum continues to support high valuations.
Tech Stock Market Cap Share at 37.5%, Surpassing Internet Bubble Era
According to Morningstar data, as of May 31, 2026, tech stocks accounted for 37.5% of the US stock market's total capitalization, exceeding the level seen during the late 1990s internet bubble. This figure does not yet include Alphabet and Meta, classified under the communication services sector, nor Amazon, classified under consumer discretionary. Including these AI-heavy giants would show even higher concentration.
Market leadership is spreading from the 'Mag 7' to a broader set of AI beneficiaries. A new market acronym, 'MANGOS', has emerged, representing Meta, Anthropic, Nvidia, Google, OpenAI, and SpaceX. The Morningstar Global Next Generation Artificial Intelligence Index rose approximately 45% cumulatively in April and May 2026 before retreating in June.
Concentration risk is one of the most similar features between the current market and the internet bubble. In late 1999, a handful of companies like Cisco, Intel, Microsoft, and Oracle dominated the Nasdaq's final sprint. While the current AI leadership has far stronger profitability than those in that era, the risk of a stampede effect from concentrated positions remains unavoidable if earnings growth fails to meet expectations.
BlackRock's Core Argument: Calling it a 'Bubble' is Itself a Major Bet
BlackRock's weekly commentary offers a thought-provoking statement: concluding that AI has become a bubble is itself a significant judgment because it assumes AI technology will not lead to lasting productivity and growth breakthroughs.
BlackRock believes AI offers the potential for a 'permanent growth breakthrough' through accelerated innovation, but the investment required to build the future is reinforcing scarcity. Based on this, BlackRock's mid-2026 outlook focuses on three themes: AI scarcity (power grids, chips, and data center bottlenecks), durable income (short-duration credit assets), and thematic investing that transcends traditional asset classifications.
BlackRock maintains its overweight stance on US equities, favoring scarce inputs needed for AI systems.
However, the opposing view is equally clear. Morningstar noted in its latest market briefing that tech stock concentration in the US market has exceeded internet bubble levels, with concerns over high interest rates, high valuations, and overinvestment in AI intertwined. Fidelity's research indicates that the current ratio of capital expenditure to free cash flow is below 1, meaning companies are primarily using their own funds rather than debt to invest in AI. This contrasts sharply with the internet bubble era, when the ratio approached 4x.
For investors, the core question has shifted from 'How high can the AI rally go?' to 'How long can AI earnings growth last?'. BlackRock is betting on earnings materializing, while bears are betting on earnings peaking. The earnings season in the second half of 2026 will be the key window to test these two competing views.


