
Leverage flushed out, buying pressure absent: Bitcoin remains stuck waiting for the "final drop"
- Core Thesis: The current Bitcoin market is in a deep correction phase of the late bear market cycle. Key indicators show widespread losses among short-term holders and a retreat of institutional buying, but the ultimate panic selling that historically triggers a sustained rebound has not yet appeared, leaving the market bottom incomplete.
- Key Factors:
- The AVIV Index Z-score has dropped to -1.06, deep in discount territory, indicating prices are severely oversold relative to the cycle average. However, no effective rebound has occurred at these low levels.
- Over 95% of short-term holders are in a losing position. The STH-MVRV metric shows new investors are underwater by an average of 17% to 19%, highlighting fragile market structure.
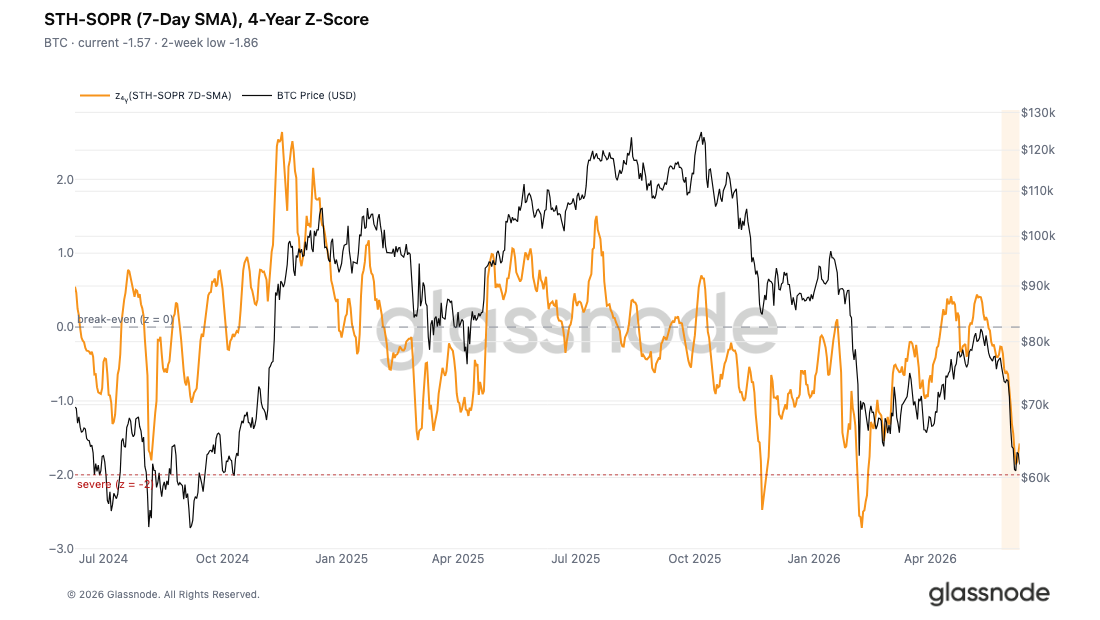
- The STH-SOPR Z-value bottomed at -1.86, approaching the -2 threshold indicative of deep panic selling. While short-term holder loss realization is intensifying, it has not yet reached historical bottoming levels.
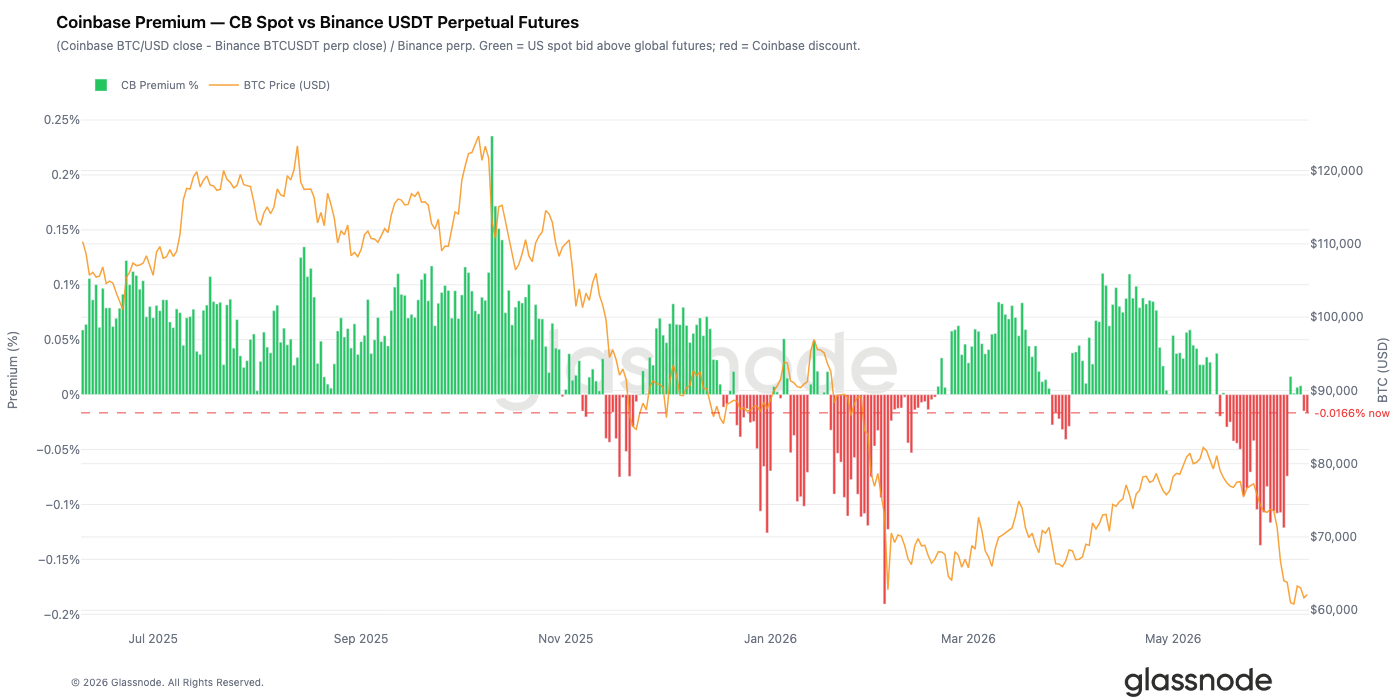
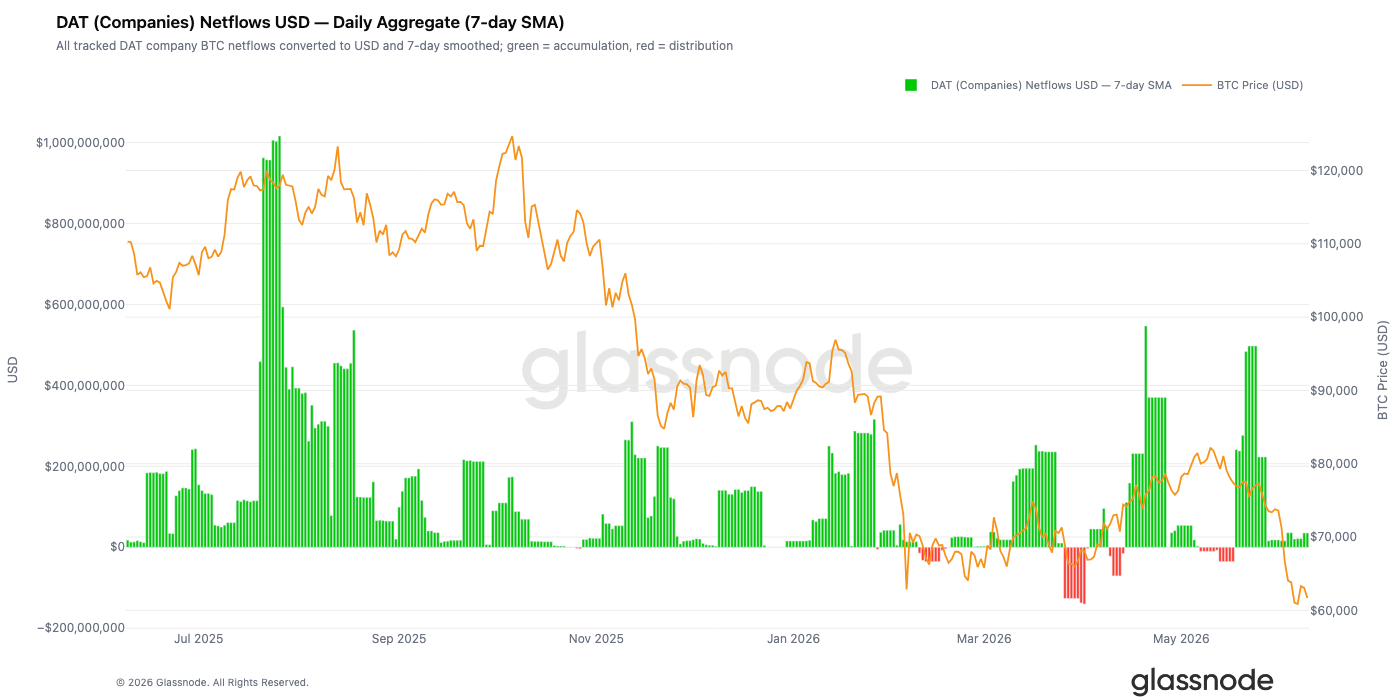
- Demand from U.S. institutions has notably cooled. The Coinbase premium persists at a discount, and corporate treasury Bitcoin accumulation has fallen from an average of over $500 million per day to near zero, signaling weakened core buying power.
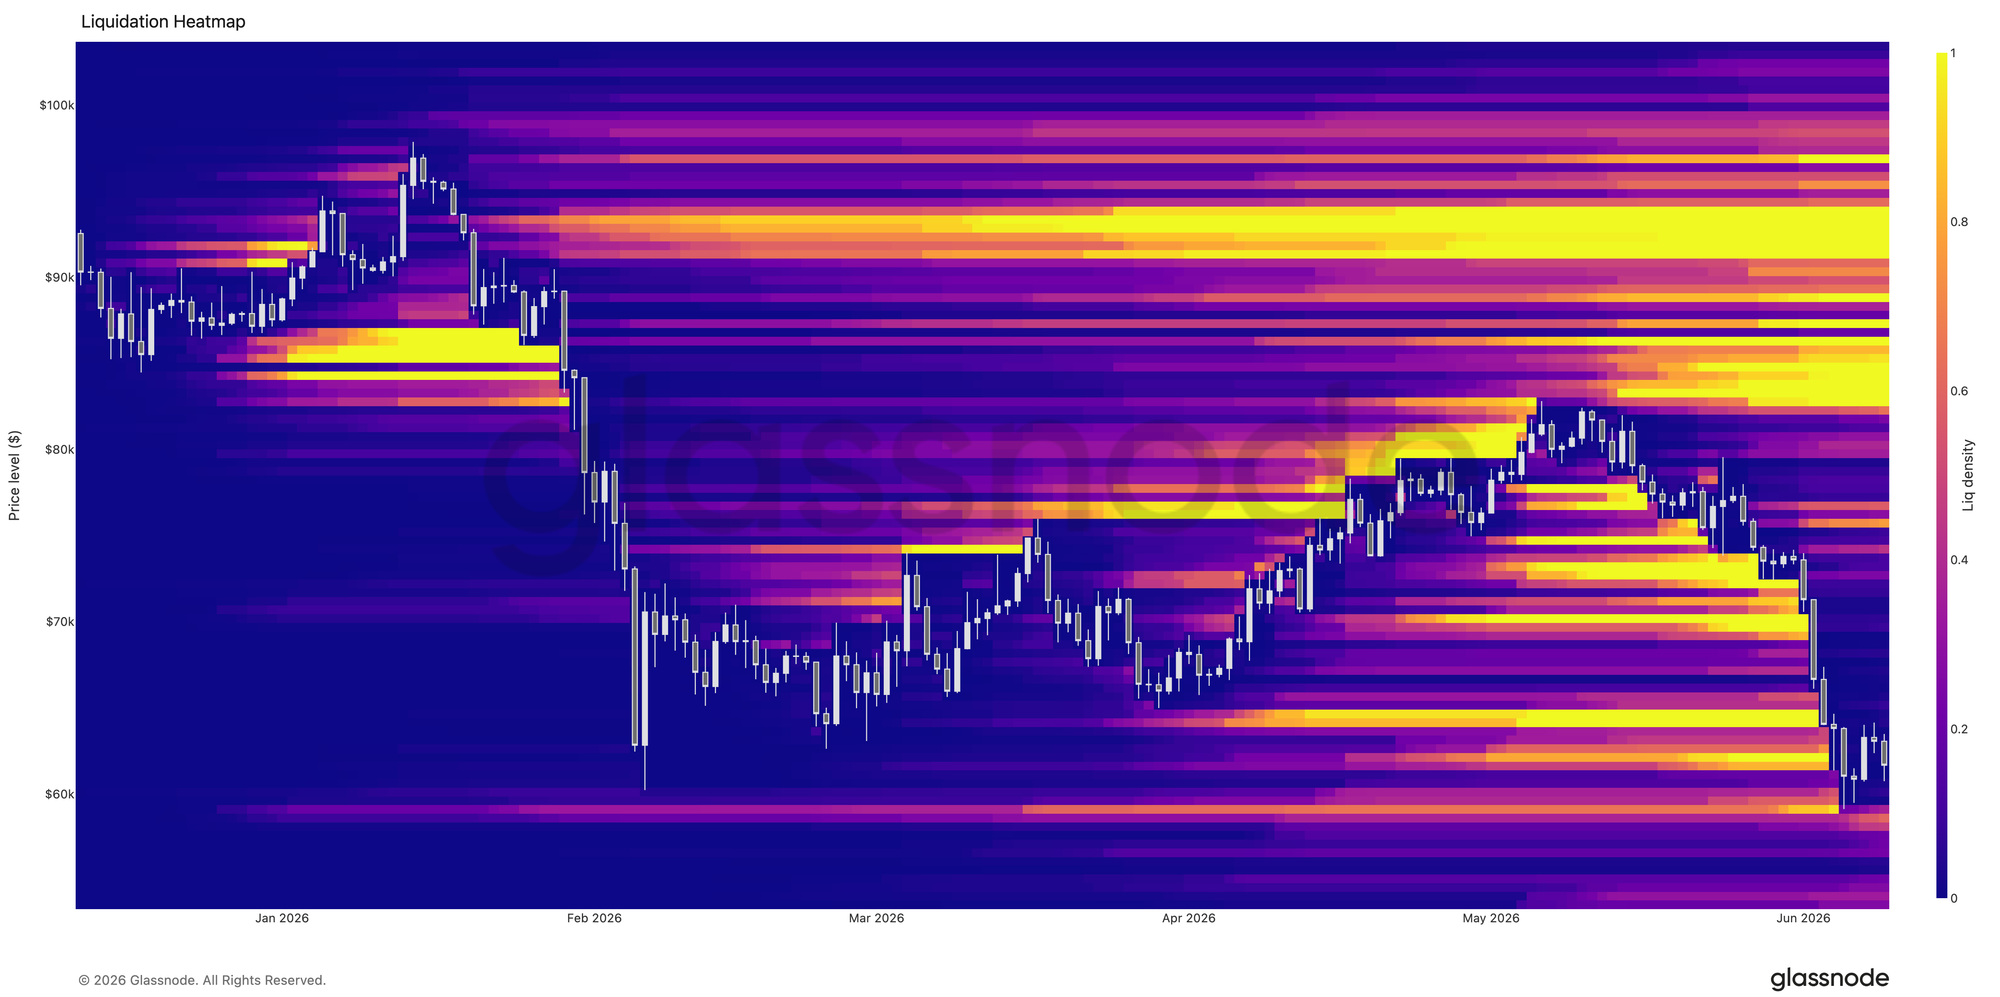
- Bitcoin's drop below $70,000 triggered significant deleveraging. The liquidation heatmap shows concentrated long position wipeouts in the $64,000 to $70,000 range.
- Implied volatility has surged significantly, with the volatility risk premium remaining elevated. The options market is pricing in far more future uncertainty than recent realized volatility suggests.
- The 25-delta volatility skew across all tenures has spiked, indicating a market-wide focus on downside protection. Market makers' largest negative gamma exposure is concentrated around the $65,000 level.
Original Authors: Chris Beamish, CryptoVizArt, Antoine Colpaert, Glassnode
Original Translation: Chopper, Foresight News
TL;DR:
- The AVIV Z-score fell to -1.09 before recovering slightly to -1.06, indicating that the current price has entered a deeply oversold territory relative to the cyclical average. The price failed to stage an effective rebound at these lows, and market panic sentiment continues to spread.
- Over 95% of short-term holders are in a losing position. The proportion of profitable supply held by short-term holders has only marginally recovered to 3.3%, far below the four-year average of 55%. This highlights a fragile market structure highly susceptible to external shocks.
- The Z-score of the Short-Term Holder SOPR (STH-SOPR) dipped to a low of -1.86, just 0.14 standard deviations away from the critical threshold of -2, which historically signals deep panic selling. This indicates escalating stop-loss behavior among market participants, though selling pressure has not yet reached levels capable of fueling a sustained rebound.
- Institutional demand from the US has significantly cooled. During Bitcoin's decline towards $60,000, the Coinbase Premium remained consistently in a discount territory, suggesting a lack of active institutional dip-buying in the spot market on that platform.
- The pace of Bitcoin accumulation by corporate treasuries has slowed dramatically. Since June, net daily institutional purchases have fallen from a peak of over $500 million to nearly zero, removing another major source of market support.
- After Bitcoin broke below key support levels, the market experienced a significant deleveraging event, with a large number of leveraged long positions being liquidated en masse, clearing out excessive speculative positions.
- Following Bitcoin's breakdown, implied volatility surged significantly. The volatility risk premium remains elevated, indicating that the uncertainty priced into the options market far exceeds the risk implied by recent actual price movements.
- Options volatility skews across all tenures surged, reflecting a marked increase in demand for downside protection tools, with traders paying higher premiums for put options.
- Market activity is predominantly defensive, with the largest negative gamma exposure concentrated near the $65,000 level, which is not far from the current spot price.
Macro Market Insights
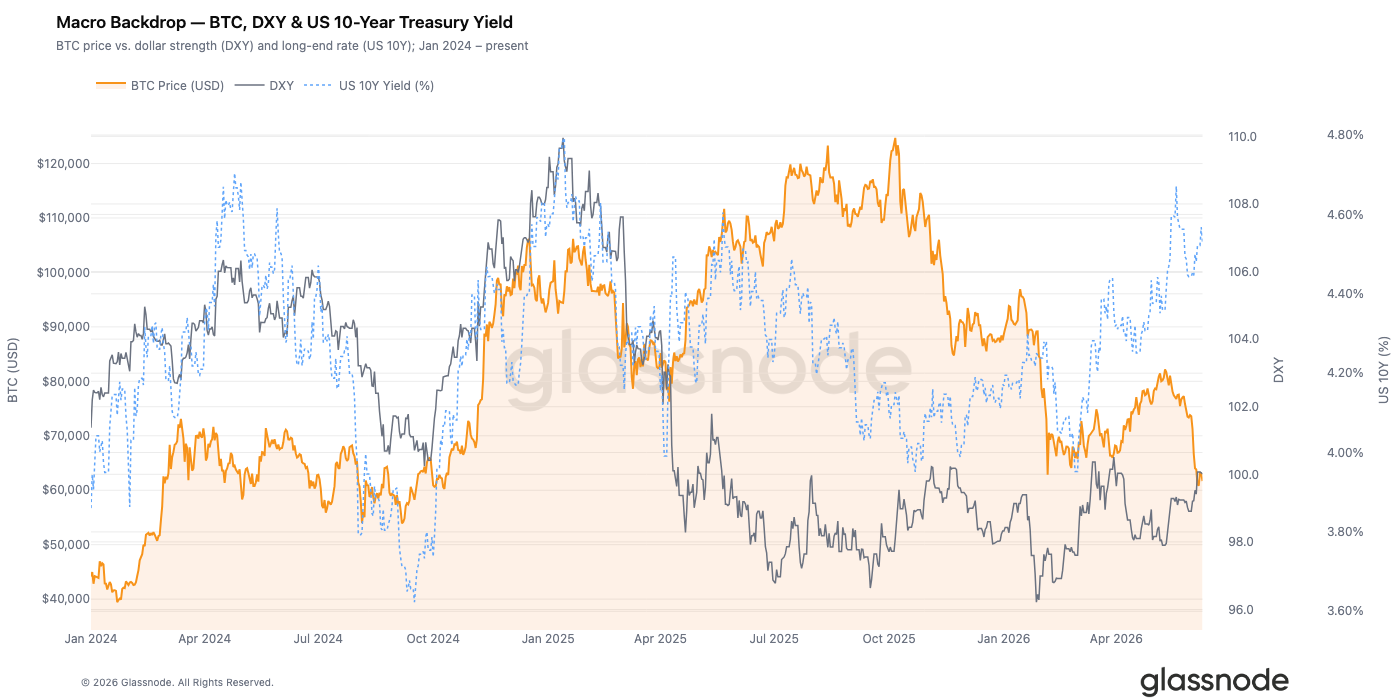
The US Dollar Index closed at 100.01, rising 0.8% for the week and accumulating a 2.1% gain over the past thirty days. The continued strength of the US dollar has tightened global liquidity over the last month. The US 10-year Treasury yield remains at 4.53%, while the 2-year yield is at 4.14%, resulting in a 10y-2y spread of 0.39%. The yield curve shape suggests the US economy is in the late cycle phase, with the Federal Reserve yet to make substantial adjustments to monetary policy.
Amidst these macro headwinds, Bitcoin fell 7.5% this week to a current price of $61,700. After a period of divergence, the negative correlation between a "strong dollar, pressured crypto assets" observed during 2022-2023 has re-emerged. With the Dollar Index holding above 100 and the 10-year yield exceeding 4.5%, historical patterns suggest this combination of rates and dollar strength typically compresses risk asset speculative premiums.
For Bitcoin to experience a sustained recovery, one of two conditions likely needs to be met: the Dollar Index effectively breaks below 99, or the 10-year Treasury yield falls back towards the 4.2% level. Neither condition is currently satisfied.
On-Chain Data Analysis
Valuation Deeply Oversold
Our previous analysis suggested that the May rally was a bear market bounce. The short-term holder cost basis fell below the True Market Mean Price for the first time since January 2022, a signal indicating that the market had entered the later stages of a bear market. This edition continues to interpret the subsequent pullback, including the price dip to $59,000 and the fragile consolidation phase that followed.
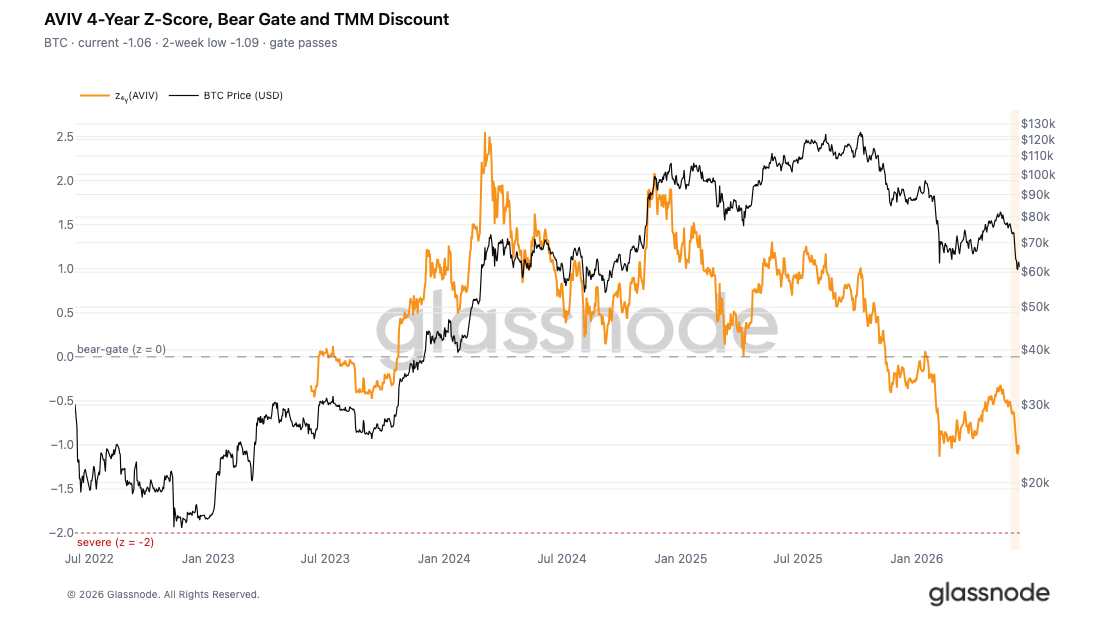
We use the AVIV (Active Investor Value Deviation) ratio to gauge the extent of the current price overshoot relative to the cyclical average. This metric compares the spot price to the True Market Mean Price (the aggregate cost basis of active investors, excluding miner holdings). Its four-year Z-score measures the deviation of the price from this baseline, where a Z-score of 0 marks the boundary between valuation premium and discount.
The AVIV ratio currently stands at 0.80, corresponding to a Z-score of -1.06, having touched a low of -1.09 over the past two weeks. Current valuation sits deep within the discount zone of the historical range. The price's failure to achieve an effective rebound from these cyclical lows over the past week underscores the persistent market panic sentiment.
New Entrants Completely Trapped
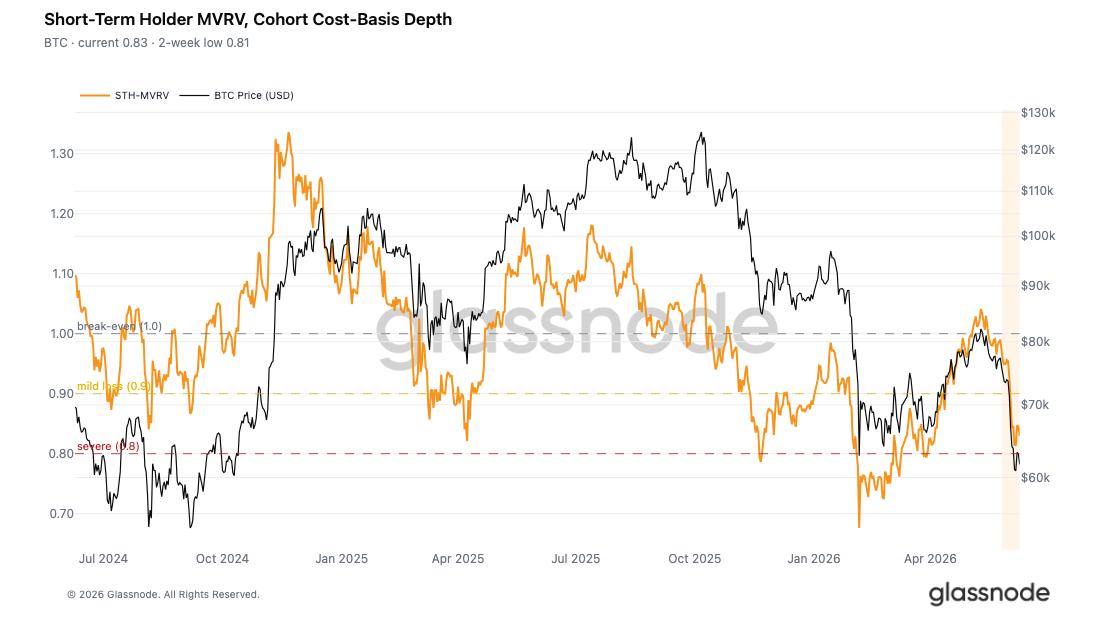
Combined with the overall market's discounted state, we analyze the situation of recently entered capital. The Short-Term Holder Market Value to Realized Value ratio (STH-MVRV) compares the spot price to the cost basis of short-term holders. A value below 1 indicates this cohort is, on aggregate, in an unrealized loss position.
The metric recently hit a low of 0.81 before a slight bounce to 0.83, implying that new investors face an average unrealized loss of 17% to 19%. This confirms that the dense cost basis cluster formed between $78,000 and $82,000 during the May rally is now widely underwater, aligning with our previous assessment of "pressure on new investors."
A brief price stabilization at lows is a common pattern during downtrends. Once the most heavily underwater investors complete their initial round of passive selling, the remaining market participants enter a wait-and-see mode. Whether this consolidation phase ultimately forms a viable bottom or is merely a continuation pattern mid-trend depends on the emergence of new buying demand at current prices.
95% of Short-Term Holders in Loss
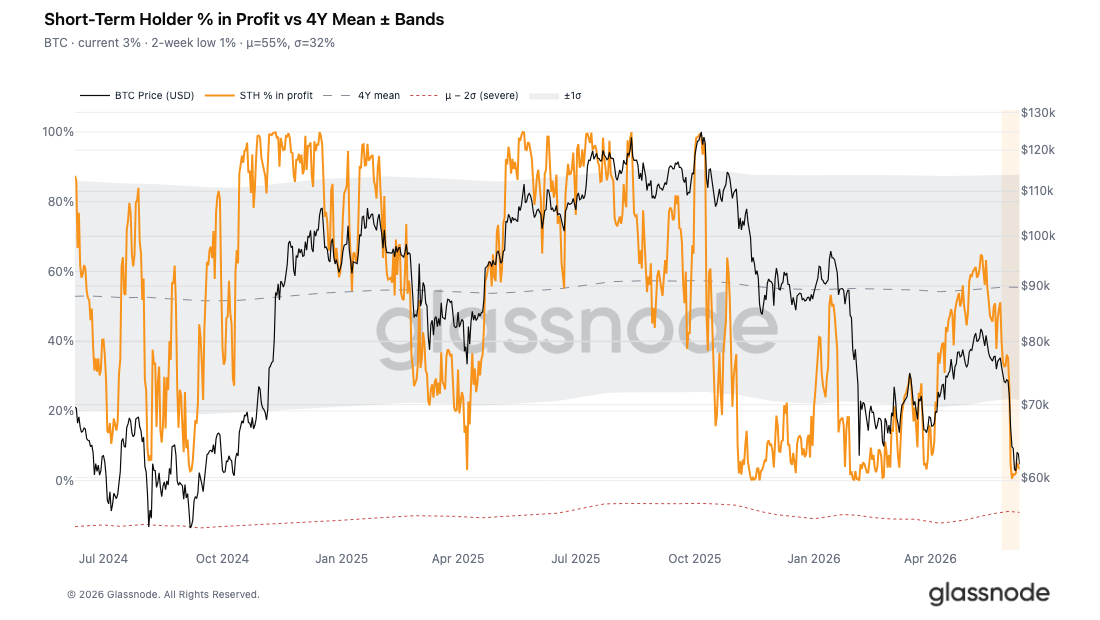
To further assess the stress on short-term holders, we examine the Short-Term Holder Supply in Profit metric. This metric measures the proportion of short-term supply in profit relative to total short-term supply. This helps gauge the *breadth* of losses, differentiating it from metrics that solely measure the *depth* of unrealized loss.
The metric recently bottomed at just 0.6%, recovering slightly to 3.3%, far below the four-year average of 55%. In practical terms, over 95% of short-term holders are currently in a loss position. This level of loss historically constitutes a significant capitulation zone, where widespread pressure on new investors creates a fragile market structure highly susceptible to any negative external trigger.
With near-universal losses across this cohort and no significant improvement in related metrics, it suggests that the current consolidation is merely an exhaustion of selling pressure rather than a completed market bottoming process.
Market Approaching Panic Selling Threshold
Beyond unrealized loss data, the actual selling behavior of investors further confirms the severity of the current market conditions. Using the four-year cyclical average as a baseline, we analyze the Z-score of the 7-day simple moving average of the Short-Term Holder Spent Output Profit Ratio (STH-SOPR) to measure the intensity of realized losses among new investors this cycle.
The current Z-score for this metric is -1.57, with a two-week low of -1.86. This is merely 0.14 standard deviations away from the -2 threshold, which historically signifies deep panic selling.
Currently, the rate of loss realization by short-term holders is accelerating and becoming more frequent, corroborating the single-day total realized loss of $1.35 billion noted in our previous report and the deep unrealized losses reflected by the STH-MVRV. However, the ultimate panic selling event historically capable of generating a medium-to-long-term rebound has not yet materialized.
The market is in an awkward middle ground: the scale of realized losses confirms bear market depth, but it has not yet reached the standard where selling pressure is fully exhausted to form a solid bottom.
Off-Chain Market Insights
Coinbase Premium Completely Disappears
The Coinbase Premium, which measures the difference between the Coinbase spot price and the Binance perpetual contract price, serves as a key indicator of US institutional demand. A premium on Coinbase typically indicates institutions are actively buying spot Bitcoin, pushing the platform price higher than the offshore derivatives market.
Recent weeks have seen a complete reversal, with the premium consistently in a discount territory. During Bitcoin's decline towards $60,000, buying demand in the US spot market cooled substantially. The usual dip-buying behavior seen in previous corrections did not materialize this time, with institutions largely choosing to wait on the sidelines, removing another significant source of market support.
Cooling Corporate Treasury Demand
Between April and May, sustained accumulation by corporate treasuries was a core market support, with several instances of single-day net purchases exceeding $500 million. However, this demand has weakened noticeably since June.
As Bitcoin fell from above $75,000 to $60,000, the net buying volume from corporate treasuries contracted sharply, dropping to a fraction of previous daily levels. While entities overall remain net buyers, the reduced pace of accumulation suggests a cautious shift in risk appetite within this cohort. In a generally low-sentiment market environment, marginal buying demand has further diminished.
Broad Deleveraging Below $70,000
Liquidation heatmap data reveals a high concentration of leveraged long positions clustered between $64,000 and $70,000. As Bitcoin rapidly declined last week, long positions within this zone were liquidated en masse, triggering a cascade of liquidations that briefly pushed the price below $60,000 before finding support.
Liquidity for long positions in the near cluster is now mostly exhausted, and the market has undergone a significant deleveraging event. Compared to data from a week ago, the current leverage structure is healthier, with a substantial portion of the excessive speculative leverage accumulated during the recent consolidation range having been cleared from the market.
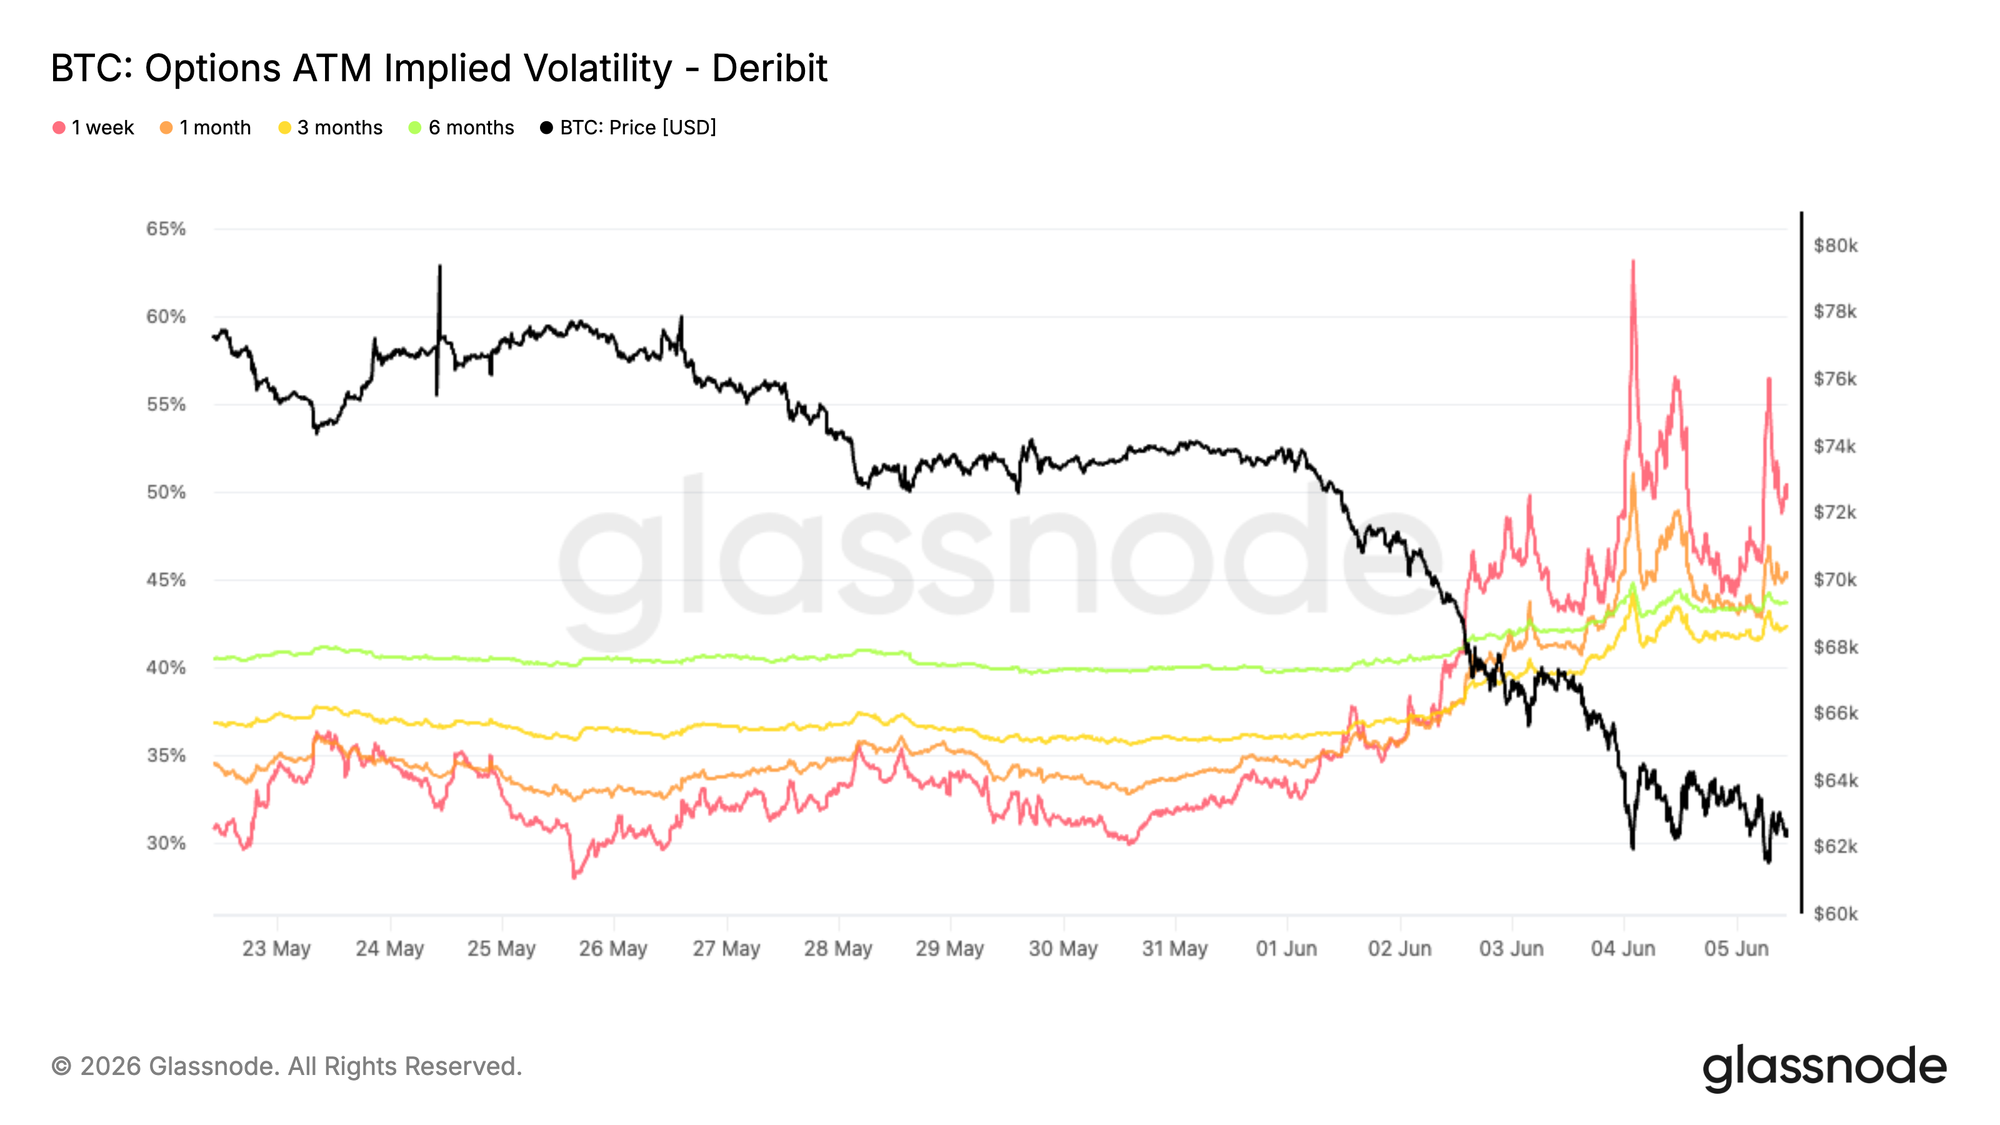
Implied Volatility Surges Significantly
After Bitcoin broke out of its months-long consolidation range, the entire volatility surface underwent a re-pricing. As the spot price approached February lows, demand for options instruments increased across the board.
The reaction in short-term volatility was most acute. The 1-week at-the-money implied volatility briefly spiked above 60% before settling back near 50%. The 1-month implied volatility rose from approximately 34% to 45%. Longer-dated tenors also rose, with 6-month implied volatility increasing from around 40% to 44%.
This volatility expansion is a comprehensive re-assessment of future uncertainty, not a short-lived sentiment spike. Although volatility has retraced from its peak, demand for options hedging remains robust. Even with temporary stabilization in the spot price, traders are willing to pay a higher cost for risk protection. This downturn has fundamentally reset market expectations for volatility, with hedging costs rising across all tenures and market risk aversion remaining elevated.
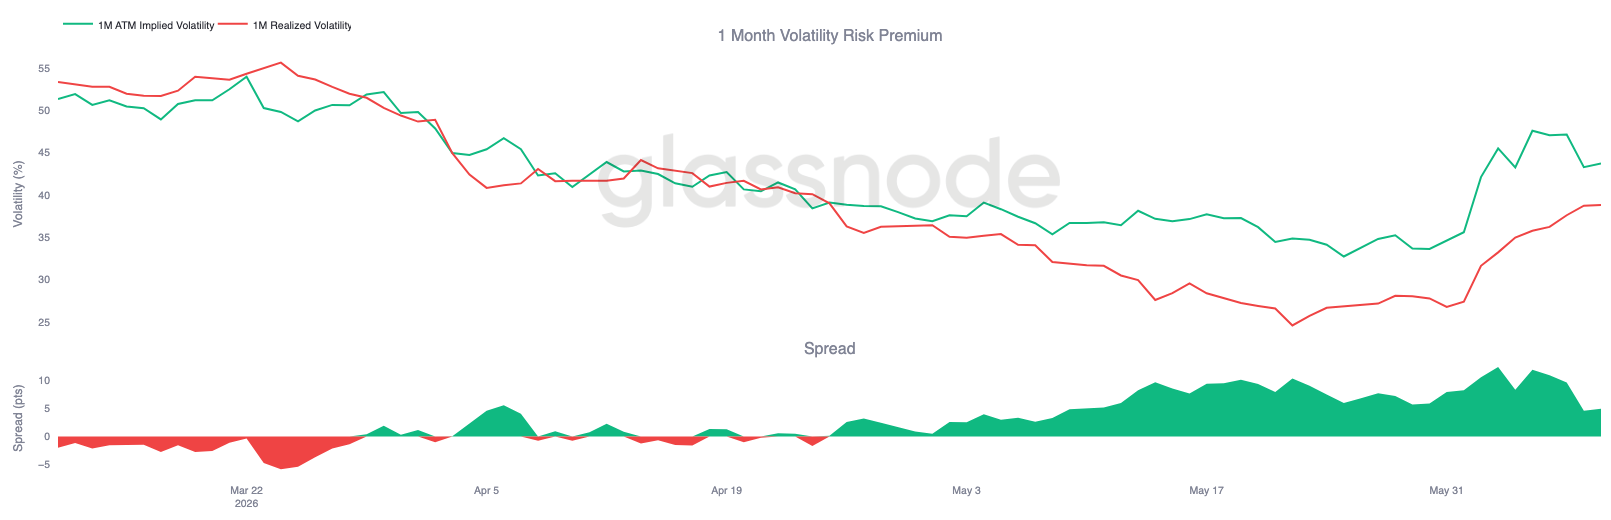
Volatility Risk Premium Remains High
Following the surge in implied volatility, comparing it to realized volatility reveals that the future price fluctuations priced into the options market still exceed the actual recent volatility of the spot market.
1-month implied volatility rose from around 35% to 44%, while during the same decline, realized volatility increased from 27% to 39%. Both metrics moved higher, but the increase in implied volatility was more aggressive, keeping the volatility risk premium positive.
After the breakdown below key support, the market urgently repriced risk, causing the volatility spread to widen briefly to 10 volatility points. Although the spread has since narrowed, options prices remain above the 'fair' level implied by actual price fluctuations. This reflects a prevailing market expectation that significant volatility will persist.
The future uncertainty priced into the options market significantly exceeds the risk implied by recent actual price action, thus maintaining an elevated volatility risk premium.
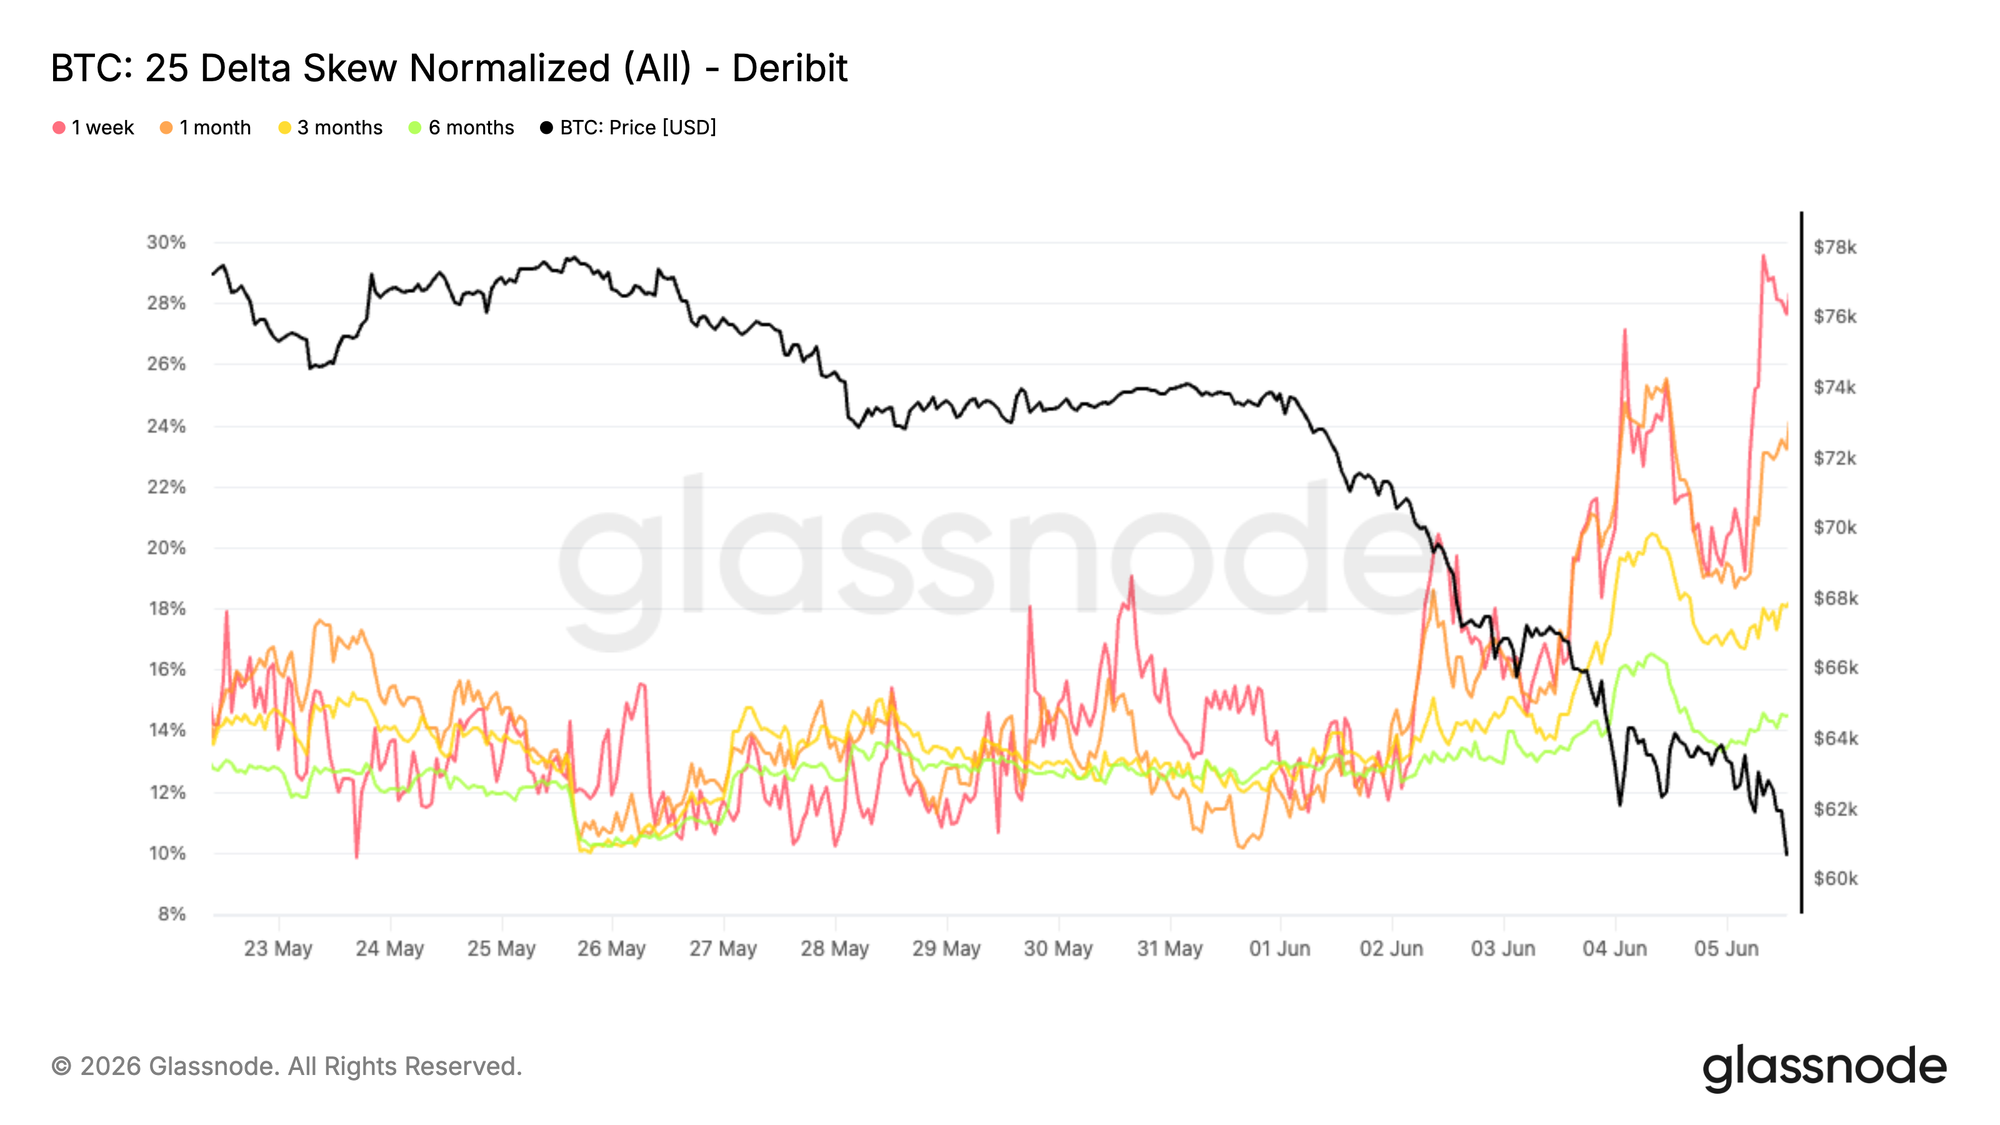
25-Delta Volatility Skew Surges
Against the backdrop of a broad rise in volatility premiums, the volatility skew indicator clearly shows the direction of capital positioning. As Bitcoin broke support and approached February lows, traders concentrated their investments in downside protection tools.
Volatility skew is calculated as put option volatility minus call option volatility. A positive value indicates that put options are priced higher than comparable call options. This downturn caused skews across all tenures to rise collectively: 1-month skew increased from around 11% to 24%, while 3-month and 6-month skews climbed to 18% and 14% respectively.
Short-term indicators reacted most intensely, with 1-week skew briefly approaching 30%. During the decline, demand for short-term downside hedging surged. If the rise in implied volatility represents market-wide risk awareness, the volatility skew points unequivocally in one direction – capital concentrating on downside hedging.
As the market environment continues to weaken, the demand for downside protection has increased significantly, with traders paying an ever-higher premium for put options.
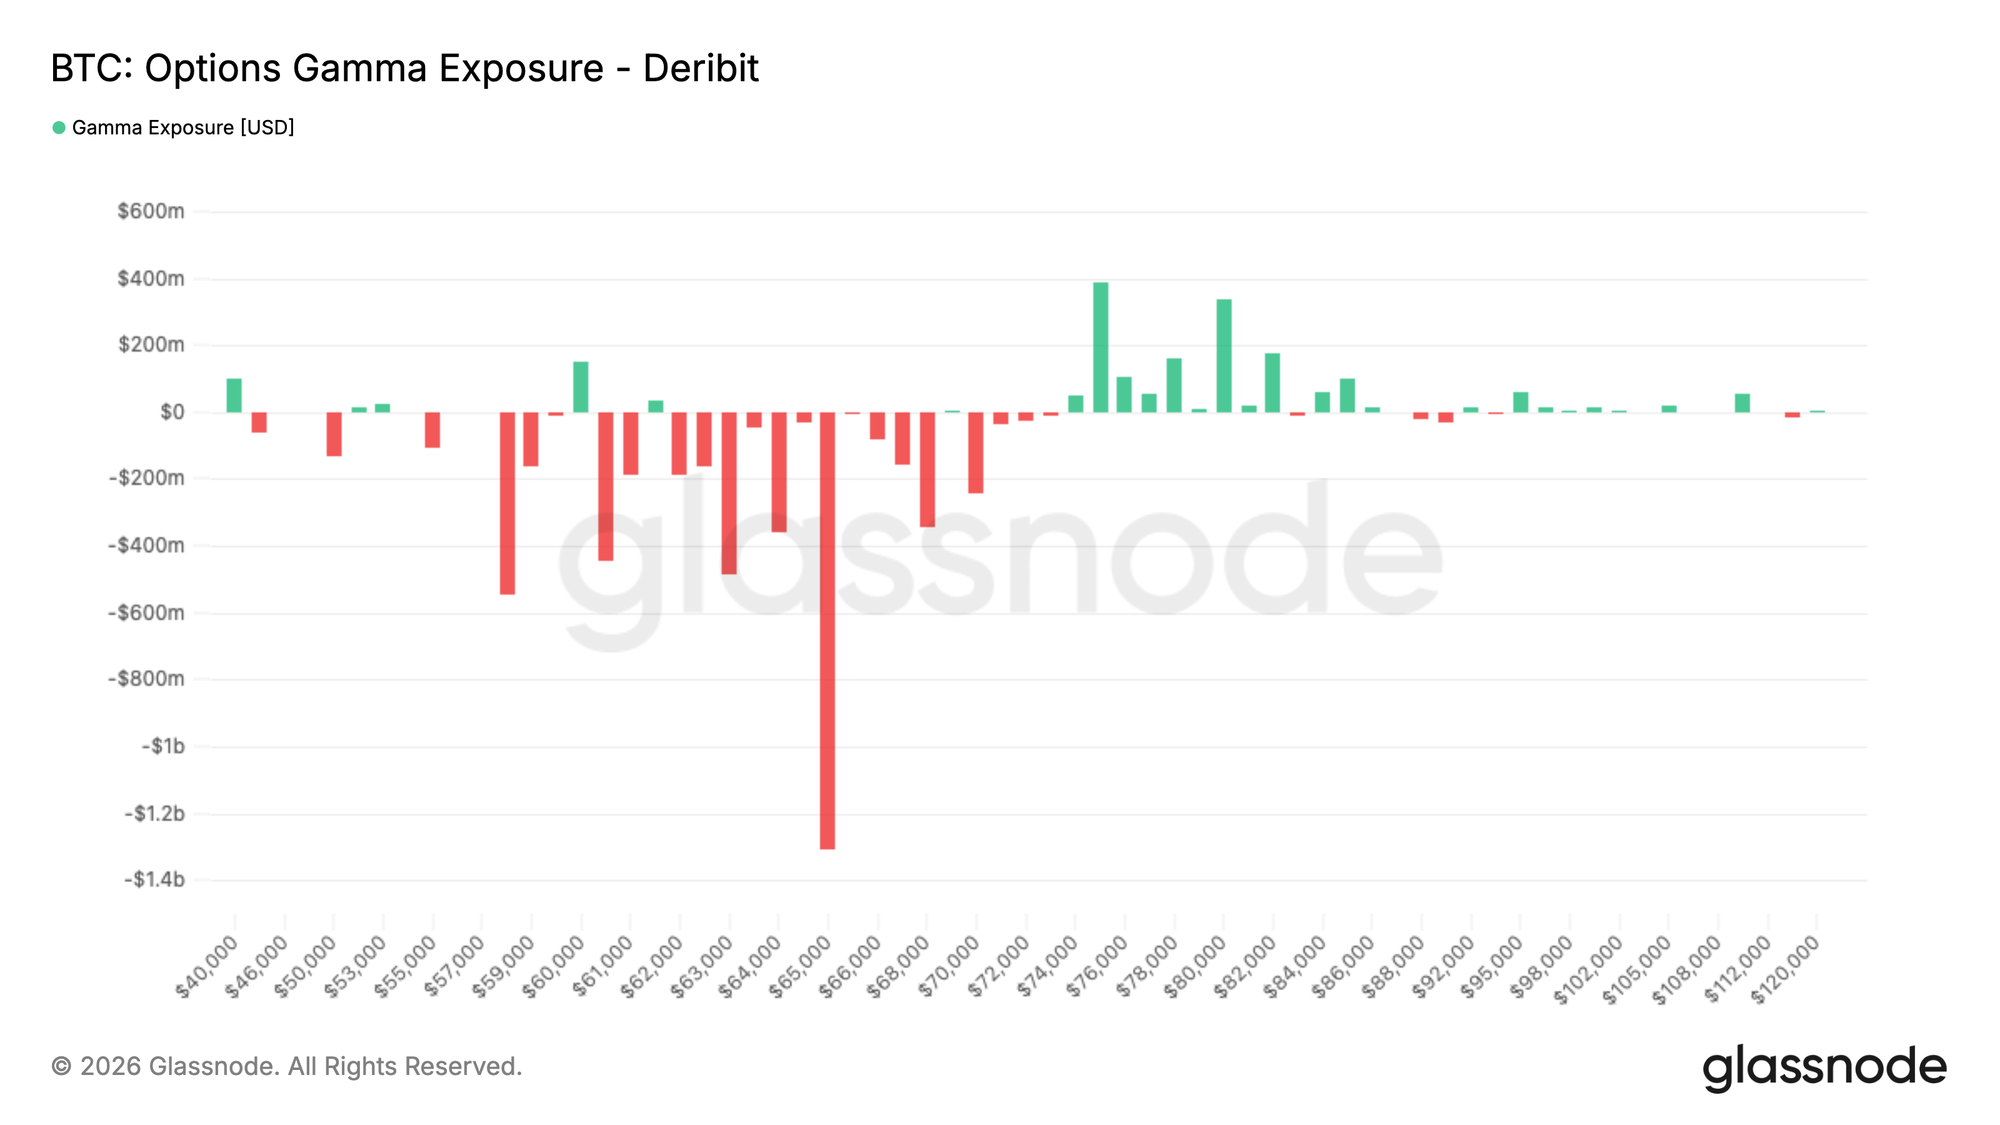
Significant Gamma Exposure Near $65,000
Beyond options prices, gamma exposure helps identify the strike prices where options market makers' hedging behavior has the greatest impact on price action.
The current market trading style is predominantly defensive. Over the past seven days, put option volume accounted for 32.4% of total options volume; over the last 24 hours, this proportion has risen further to 35.9%. Even after a significant sell-off, market trading remains focused on buying downside protection.
This trading behavior is directly reflected in the gamma exposure structure. The largest concentration of negative gamma exposure is currently at $65,000, with substantial negative gamma also distributed across the $59,000 to $70,000 range. With Bitcoin currently around $62,000, the spot price sits just below the zone of peak short-term negative gamma. Positive gamma exposure is concentrated primarily in the higher $76,000 to $82,000 range.
Defensive trading dominates market makers' positioning structures, placing the market's largest negative gamma zone around the $65,000 level, which is very close to the current spot price.
Conclusion
The current market displays classic characteristics of a late-cycle bear market correction: recently entered investors are deeply trapped, realized losses remain elevated, and multiple core buying forces are weakening.
Bitcoin's decline towards $60,000 triggered a significant deleveraging event, leading to a concentrated clearing of speculative positions. Leverage levels have returned to more reasonable levels, but the spot market has yet to see effective new buying demand.
The options market maintains an overall defensive posture, with elevated implied volatility, strong demand for downside hedging, and key market maker exposure tightly aligned with the current spot price. Coupled with declining institutional participation and reduced corporate treasury accumulation, this clearly indicates persistently low market risk appetite.
Synthesizing the data, the market is gradually entering a phase of deep panic selling. While market leverage has been largely cleared and valuation metrics have fallen to historically deep discount territories, the incremental buying demand typically associated with the formation of a solid bottom in history has yet to emerge.


