
BTC боковик на уровне $80,000: Быки готовятся к прорыву или медведи вот-вот нанесут удар?
- Основной тезис: По состоянию на май 2026 года Bitcoin находится на критической точке возле отметки $80,000, представляя собой зону интенсивной борьбы. Данные ончейн (сжатие предложения, институциональный спрос) указывают на накопление на дне, однако одновременно существуют сильные медвежьи факторы, такие как продажи майнинговых компаний и аномалии в структуре деривативов. Рынок стоит перед ключевым выбором: прорыв или повторное снижение.
- Ключевые факторы:
- Сильный спрос: Чистый приток в американские спотовые BTC ETF в апреле составил $2,44 млрд, что является самым сильным месяцем с октября 2025 года. На долю IBIT от BlackRock пришлось около 70%.
- Сжатие предложения: Запасы BTC на биржах упали до 2,21 млн монет (минимум с 2017 года). Доля долгосрочных держателей составляет 78,3%. В апреле киты накопили 270 000 BTC нетто.
- Низкие оценочные показатели: Значение MVRV Z-score составляет всего 0,91, RHODL ratio равен 4,5 (третий самый высокий показатель в истории), что исторически указывает на дно цикла.
- Медвежий фактор от аномалий в деривативах: Средняя за 30 дней ставка финансирования по бессрочным контрактам была -5% (только что вернулась к положительным значениям). Соотношение long/short на Binance составляет 36,7%. Кроме того, около отметки $82,000 сконцентрированы опционные позиции с отрицательной гаммой на сумму почти $2 млрд.
- Значительное давление со стороны продавцов: В первом квартале 2026 года публичные майнинговые компании продали более 32 000 BTC, что превышает общий объем продаж за весь 2025 год. Майнеры также продолжают фиксацию прибыли в последнее время.
- Ключевой критерий для определения: Сможет ли BTC удержать 200-дневную EMA (около $78,200-$79,100) и преодолеть активную реализованную цену в $85,200, что определит дальнейший тренд.
Original by Odaily Planet Daily (@OdailyChina)
Author: jk

Since hitting an all-time high of $126,198 in October 2025, Bitcoin has undergone seven months of prolonged declines and sideways consolidation. Entering May 2026, BTC has formed a highly condensed battle zone between bulls and bears around the $80,000 level. Signals of accumulation from bulls and selling pressure from bears are appearing at the same price coordinate with rare intensity.
At press time, BTC is quoted at approximately $80,832, with the market at a critical tipping point: breakout or a second decline?
Bullish Confidence: On-chain Data Almost Universally Points to an Accumulation Bottom
Evidence supporting the bulls mainly centers on two fronts: supply-side contraction and institutional demand.
On the supply side, BTC reserves on exchanges have dropped to 2.21 million coins, the lowest in seven years since December 2017. Long-term holders' positions account for 78.3% of the total supply, and whale wallets accumulated approximately 270,000 BTC net in April. The readily available supply for selling has been compressed to historic lows. If new demand continues to enter the market, the price sensitivity to capital inflows could increase further.
On the demand side and institutional data, U.S. spot BTC ETFs saw net inflows of $2.44 billion in April, the strongest month since October 2025, with BlackRock's IBIT accounting for about 70% ($1.71 billion). Strategy (formerly MicroStrategy) holds 818,334 BTC with an average cost of $75,537, boasting a book profit of over 7%. Saylor posted a "back to work" message on May 10, which the market interpreted as a signal to continue accumulating. JPMorgan estimates Strategy's total BTC purchases this year could reach $30 billion.
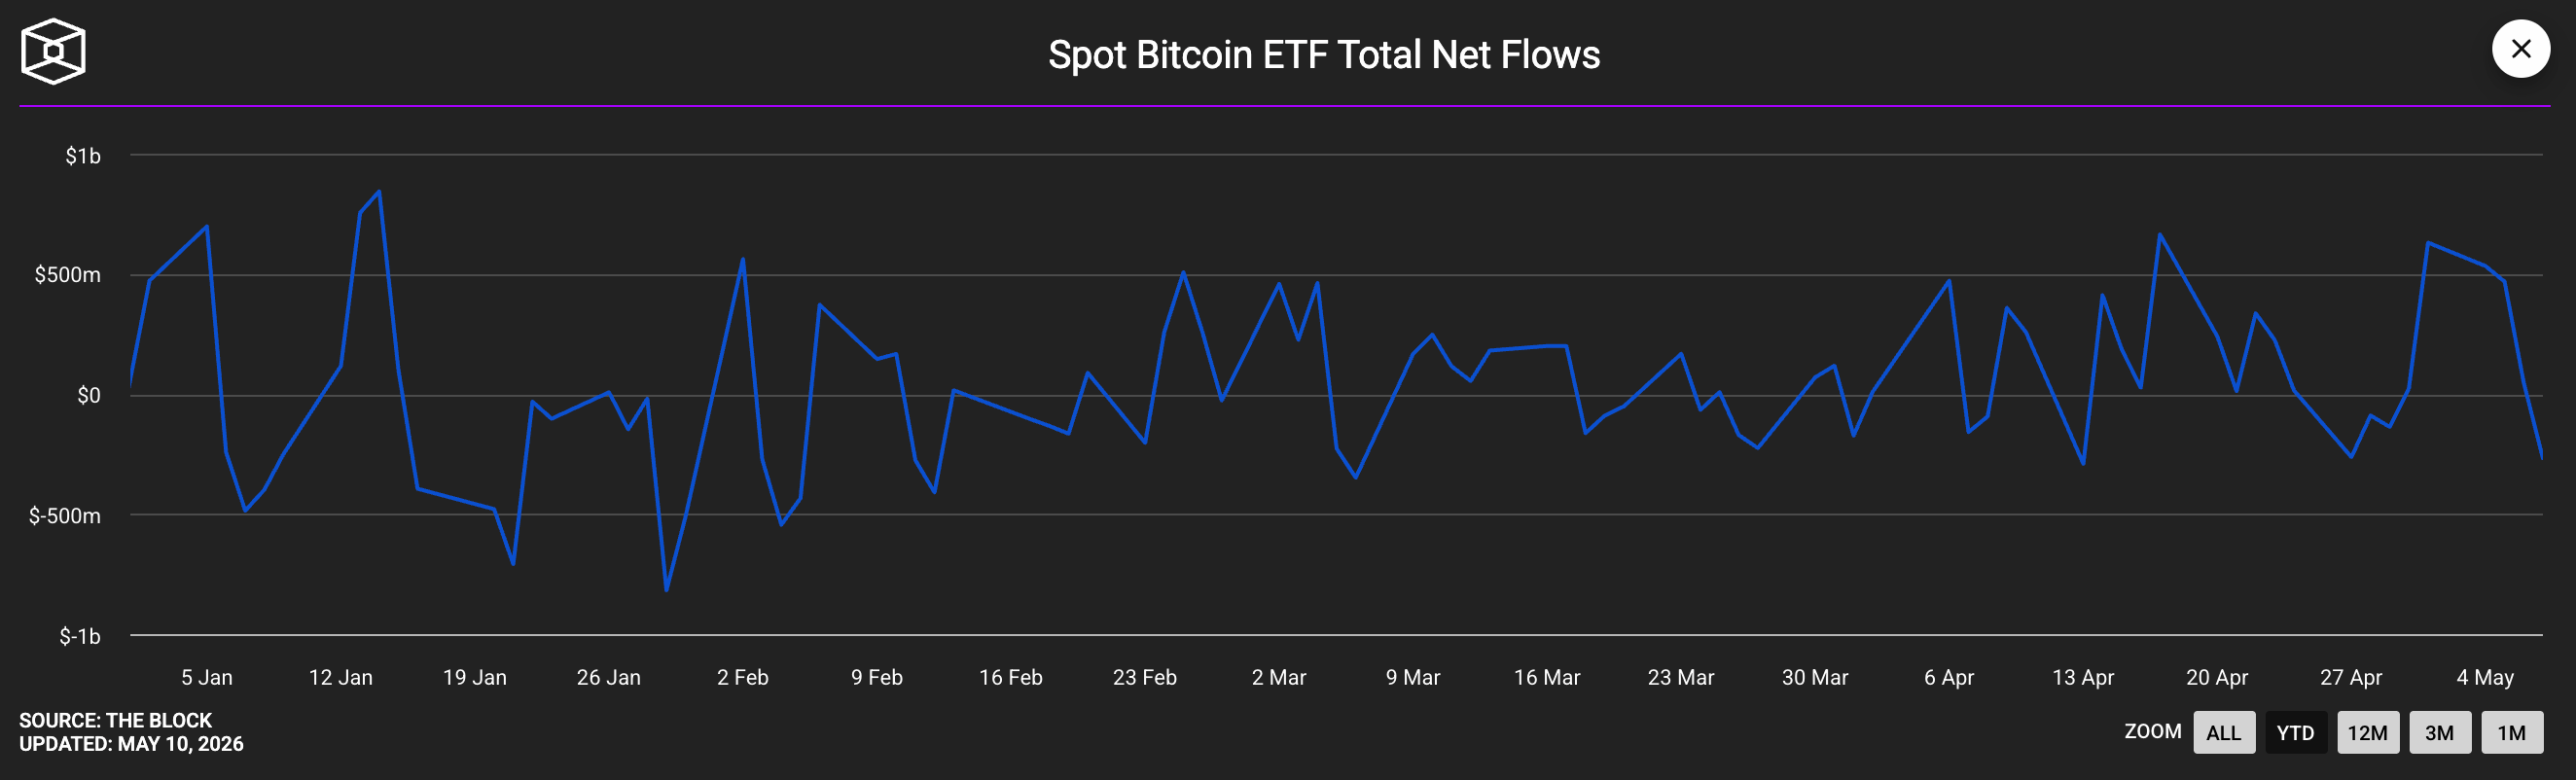
Bitcoin ETF inflow data, Source: The Block
Valuation indicators are also unusually low. The MVRV Z-Score stands at only 0.91, historically a recognized strategic accumulation window; the RHODL ratio is 4.5, the third highest in Bitcoin's history. This has only happened twice before, in 2015 and 2020, both times marking cycle bottoms.
Glassnode data shows Bitcoin has reclaimed the Realized Market Price near $78,200 and the Short-Term Holder Cost Basis around $79,100. These two levels are critical for market structure. If the price consistently stays above them, it indicates recent buyers are returning to profitability, and the market is shifting from loss-driven selling pressure to a recovery in holding confidence.
On the macro front, the 30-day correlation coefficient between BTC and the US Dollar Index (DXY) hit -0.90 in late April, the most extreme negative correlation since September 2022. If the dollar continues to weaken, it will provide near-mechanical price support for BTC.
Bearish Pressure: Seven Rejections, Miner Selling, and Abnormal Derivatives Structure
However, resistance from the other direction is equally as strong as the accumulation signals.
Regarding selling pressure, Glassnode data shows the 14-day moving average of Realized Loss is still $479 million per day, 140% above the cyclical baseline of $200 million. Historical experience suggests this figure must first compress below the baseline before a bull market can start. Currently, about 43% of all Bitcoin is in a state of unrealized loss. The number of wallet addresses holding BTC decreased by 245,000 in five days, the fastest rate of attrition in nearly two years. The cost basis for newborn whales (holding period less than 155 days) is approximately $80,300. BTC must sustain above this level to turn these holdings profitable; otherwise, it faces constant selling pressure from those looking to break even.
The structure of the derivatives market also sends a bearish signal: On April 27, the 30-day average perpetual swap funding rate was -5%, compared to a historical normal level of +8%. This data has just barely returned to positive. On Binance, the BTC long/short ratio is only 36.7% long / 63.3% short, making it the most crowded short position among mainstream assets. 10x Research analyst Markus Thielen explicitly stated that this abnormal funding rate indicates institutions are shorting futures to hedge ETF long positions, creating systematic suppression, potentially a signal to further liquidate short-term longs. Glassnode reports that nearly $2 billion in negative Gamma options positions are clustered around the $82,000 strike price, and market makers' hedging activities will amplify two-way volatility near that level.
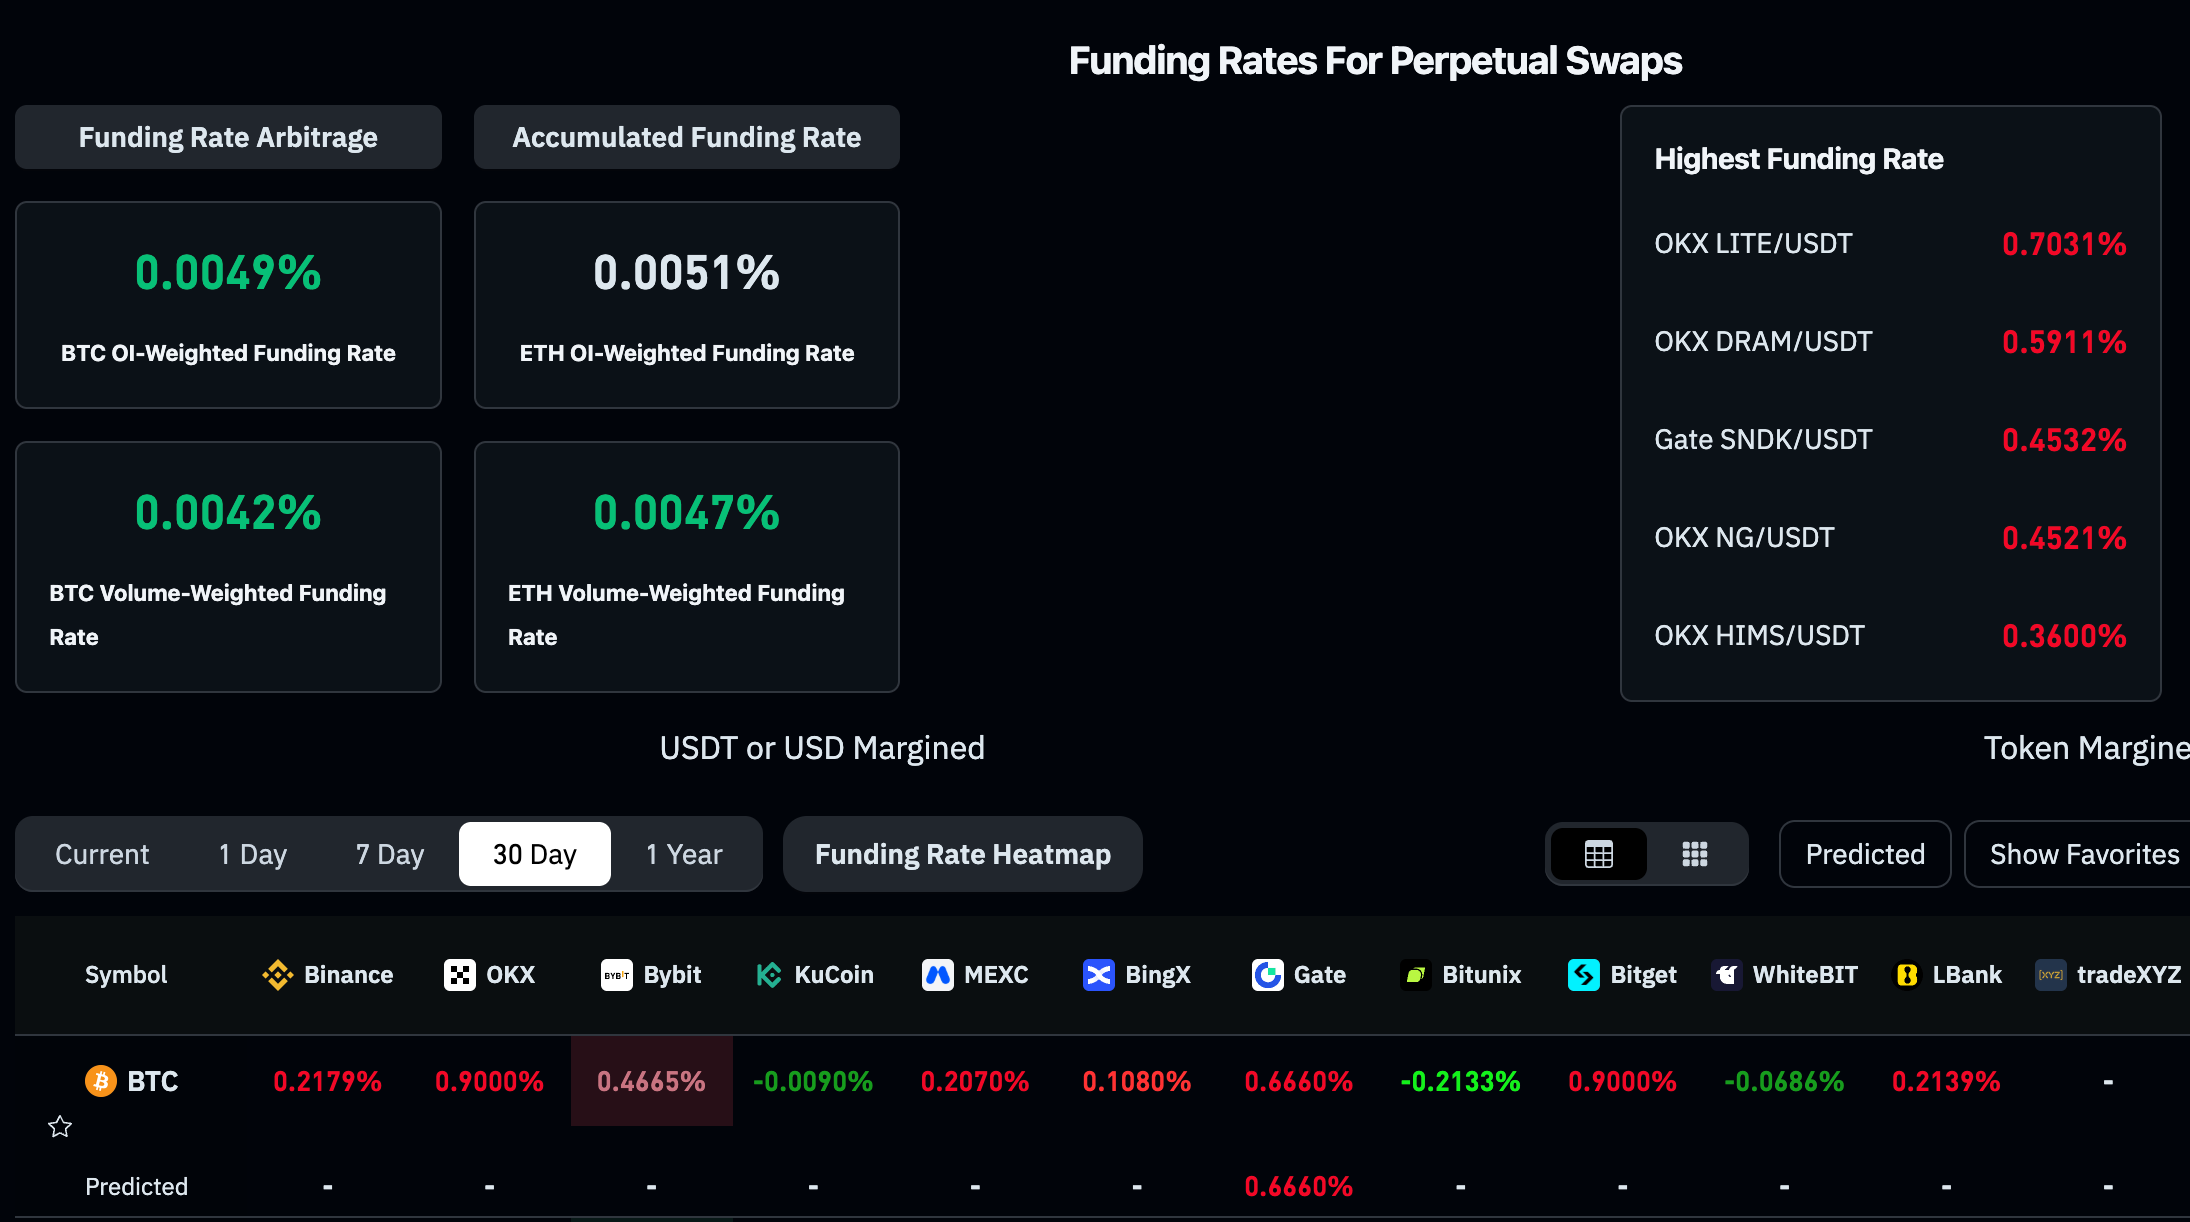
The 30-day average funding rate has just turned positive, Source: Coinglass
On the seller pressure side, listed mining companies sold over 32,000 BTC in Q1 2026, surpassing the total for all of 2025. Bitdeer completely liquidated its 1,132.9 BTC reserve in February, Cango sold 4,451 BTC (approximately $305 million) on February 9, and Core Scientific also continues to sell down its reserves. On-chain data shows that since April 7, about 3,400 BTC have flowed out of miner reserves, with mining companies capitalizing on this recent rally. If miner selling pressure persists and ETF inflows cannot continuously offset it, price stability around $80,000 will be challenged.
Institutional Views: Analyst Perspectives
The divergence between bulls and bears is also reflected in Wall Street's year-end price targets, with a degree of dispersion rarely seen this cycle.
Tom Lee offered the most optimistic assessment at the Consensus conference in Miami on May 7: "If Bitcoin closes the month above $76,000, the bear market is definitively over. You are never in a bear market after three consecutive positive monthly returns." His year-end target range is $150,000 to $250,000.

Tom Lee at the just-concluded Consensus conference. Source: Coindesk
Bernstein analyst Gautam Chhugani reiterated a $150,000 target on May 5, stating that "the current case for a Bitcoin bear market is the weakest in history, and the best era for crypto is still ahead." JPMorgan holds a positive outlook for the crypto market in 2026, believing it will be more driven by institutional investors than retail, and has revised its BTC production cost soft support down from $90,000 to $77,000.
On the other side, Standard Chartered's Geoffrey Kendrick lowered his year-end target from $150,000 to $100,000 in February this year, warning of a potential "final flush" that could see BTC slide towards $50,000 before establishing a durable bottom. Citigroup lowered its target from $143,000 to $112,000 in March, suggesting BTC is more likely to trade in a range in the short term, awaiting legislative progress like the CLARITY Act. SkyBridge's Anthony Scaramucci explicitly stated that a significant BTC recovery might not be seen until Q4 2026.
Key Determinants
Among all observed indicators, two are currently the most decisive:
First, whether the 200-day EMA can hold. BTC has just reclaimed this moving average. If it falls back and closes the weekly candle below it, this recovery will be deemed a fakeout. The short-term holder cost basis of $79,100 and the realized market price of $78,200 will be two support lines for bulls. If the $74,300 level is lost, the extreme scenario of $50,000-$60,000 warned by Standard Chartered will re-enter the picture.
Second, whether BTC can break through the Active Realized Price of $85,200 from Glassnode. This is the next significant on-chain resistance level identified in Glassnode's Week 18 report. A weekly close above this level would confirm a trend reversal signal.
The combination of these indicators will provide an answer within the next two to three weeks.


