
Gate Institutional Weekly: BTC ETF Sees Continued Inflows, Aave Lending Balance Plunges 26.7%
- Core View: Last week, the crypto market showed a pattern of "cautious optimism." BTC climbed to over $77,000 due to easing geopolitical risks and rising expectations of interest rate cuts. On-chain capital concentrated towards high-liquidity and settlement-type assets, but a repricing of complex risk pathways (e.g., the rsETH incident) led to a structural migration of capital.
- Key Elements:
- BTC ETFs saw a weekly net inflow of $585 million, with BlackRock's IBIT accounting for over 80%. Total net asset value surpassed $102.64 billion, signaling a restoration of market confidence.
- Stablecoin capital flowed back into settlement assets, with USDT supply rising to nearly $200 billion, while the yield-bearing stablecoin USDe saw a net outflow of nearly $2 billion in a single week.
- On-chain risk appetite declined post-rsETH incident, causing Aave's lending balance to plummet 26.7% in a week. Capital accelerated its flow to competing protocols like Spark, leading to a sharp rise in core stablecoin borrowing rates.
- The derivatives market exhibited a classic divergence pattern of "negative funding rates + high volatility," with persistent crowding in BTC shorts. However, support from spot and institutional buying helped implied volatility recover.
- Institutional trading activity picked up, with spot trading volume increasing 20.09% week-over-week. CrossEx trading volume and capital scale hit new highs (up 79% and 816% week-over-week, respectively).
Summary
• Last week, the crypto market presented a pattern of "cautious optimism," with easing geopolitical risks in the Middle East and rising expectations for a Fed rate cut this year. BTC rose from $68,000 to over $77,000, and BTC ETFs continued their net inflow trend.
• Trading activity in TradFi has declined from the risk-off peak in March, but gold remains a core trading asset, while the share of stocks and commodities has rebounded.
• On-chain capital continues to concentrate in high-liquidity and high-turnover scenarios. PancakeSwap's weekly trading volume approached $36 billion, while the Solana ecosystem exhibited a "small-ticket, high-frequency trading" characteristic.
• Stablecoin capital is clearly flowing back into settlement-focused USD assets. USDT supply rose to nearly $200 billion, while the yield-bearing stablecoin USDe saw a net outflow of nearly $2 billion in a single week.
• Following the rsETH incident, on-chain risk appetite markedly declined. Aave's lending balance plummeted by 26.7% in a single week, borrowing rates for core stablecoins rose sharply, and capital accelerated its flow to competing protocols like Spark.
• The derivatives market displays a typical divergence structure of "negative funding rates + high-level consolidation." Short positions in BTC perpetual contracts remain crowded, but spot and institutional buying provide support. Concurrently, implied volatility and options trading volume have rebounded.
• On the institutional and platform side, spot trading volume increased by 20.09% WoW, with 30+ new business opportunities added. CrossEx trading volume and capital scale hit new all-time highs, up 79% and 816% respectively, as institutions accelerate cross-exchange arbitrage and hedging. The trading system 3.0 architecture is advancing, infrastructure is continuously improving, and the onboarding of institutional capital is accelerating.
1. Market Focus Interpretation
Last week, the overall sentiment in the crypto market was characterized by "cautious optimism." Key drivers included the marginal easing of geopolitical tensions in the Middle East, rising expectations for a Fed rate cut, and sustained institutional buying effectively offsetting profit-taking pressure from short-term holders. During this period, BTC rose from around $68,000 to over $77,000, an increase of approximately 12%.
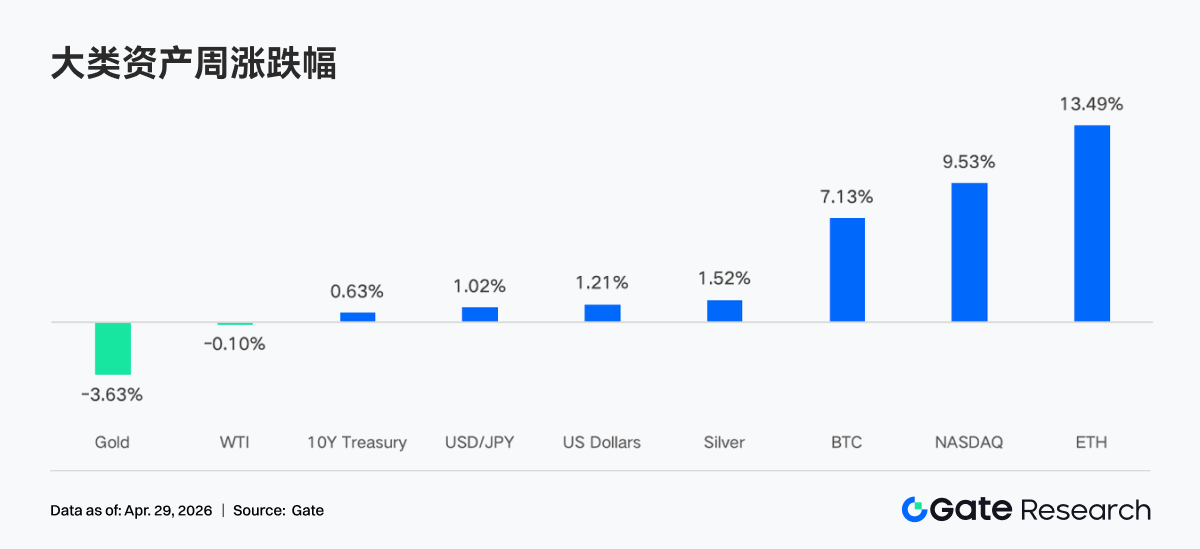
Trump extended the ceasefire agreement with Iran, signaling his desire to resolve the conflict through diplomatic means. However, negotiations for a more lasting peace deal are currently at an impasse. The Strait of Hormuz, a conduit for about one-fifth of the world's oil supply, remains closed, pushing oil prices back to $95 per barrel. In recent weeks, the market has largely priced in the tail risks of the Middle East situation. BTC and ETH have continued to rise, with ETH showing greater resilience due to ecosystem expectations, and stock markets have also recovered from the March sell-off. Yields have remained stable as the Federal Open Market Committee (FOMC) meeting approaches, with the 10-year Treasury yield around 4.30%. The US dollar index is hovering near 98, entering a consolidation phase after retracing from above 100. Gold is under pressure due to the dollar and interest rates. Meanwhile, expectations for a Bank of England rate hike are rising, with the pound bouncing to around 1.36. A 22 basis point rate hike before year-end could weaken a key structural support for the US dollar.
Although the FOMC meeting this week is highly likely to keep interest rates unchanged, the market will closely watch for changes in the statement's language regarding inflation, the impact of the war, and risk balance, as well as any signals regarding adjustments to the long-term neutral rate of 3.1%. Market expectations for the Fed's rate cut path this year have significantly warmed. The probability of a 25 basis point cut before December is now seen at 39%, up from 23% previously. This shift is influenced, on one hand, by the DOJ dropping its investigation into Powell, further removing obstacles for Warsh to succeed the Fed Chair, and on the other hand, it reflects expectations that the Fed will have greater room for easing in the second half of the year if oil prices return to normal ranges.
2. Liquidity Analysis
2.1 BTC ETF Total Net Assets Surpass $102.64 Billion
Last week, BTC ETFs continued their net inflow trend that began on April 14, recording four positive inflow days for a total weekly net inflow of $585 million. ETH ETFs saw a total weekly net inflow of $87.3 million, a slowdown in pace compared to the previous week. However, overall market sentiment remained optimistic, with institutional investors demonstrating strong long-term conviction.
Top Products by BTC ETF Net Flow:
1. IBIT (BlackRock): Weekly net inflow of $476.6 million
2. ARKB (ARK 21Shares): Weekly net inflow of $59.6 million
Top Products by ETH ETF Net Flow:
1. ETHA (BlackRock): Weekly net inflow of $61.9 million
2. ETHB (Bitwise): Weekly net inflow of $47.8 million
Capital flows show a clear concentration effect among the leaders. BlackRock's IBIT dominated with a weekly net inflow of $476 million, contributing over 80% of the total BTC ETF inflows for the week. ETHA also led the ETH ETF market with $61.9 million. Concurrently, Grayscale's GBTC and ETHE continue to face persistent capital outflows, reflecting that the structural shift of investors from legacy high-fee products to new low-fee products is not yet complete.
As of April 24, the total net asset value of US spot BTC ETFs had surpassed $102.64 billion, accounting for approximately 6.5% of Bitcoin's total market cap. The total net asset value of ETH ETFs was approximately $13.79 billion, accounting for about 4% of Ethereum's total market cap. In terms of capital trends, the year-to-date net flow for BTC ETFs has turned positive to approximately $1.85 billion, indicating market confidence is being restored. However, whether it can break through the historical cumulative net inflow high will depend on the outcome of the tug-of-war around the $80,000 mark.
2.2 TradFi Liquidity
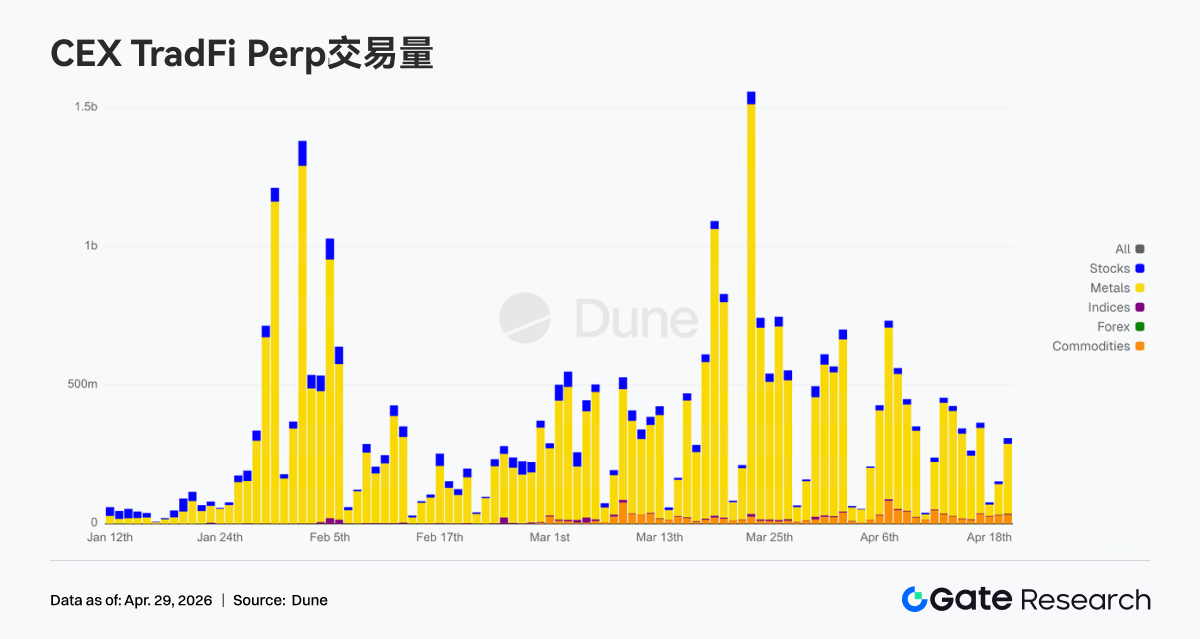
• TradFi Perp DEX: Trading volume continued to decline slightly compared to previous weeks, with the latest total weekly volume dropping to around $10 billion. This suggests that after the marginal easing of the Middle East situation and the restoration of market risk appetite, the high trading activity previously driven by risk-off sentiment is gradually cooling down. In terms of asset structure, commodities still dominate overwhelmingly, with gold-related asset trading remaining a core market activity and constituting the majority of volume. However, compared to the peak in March, the share of commodities has contracted somewhat, while the share of equity assets like indices, ETFs, and stocks has slightly rebounded, indicating that capital is gradually shifting from single safe-haven trades to a broader range of risk assets.
• TradFi Perp CEX:Since April 20, overall market trading activity has declined from the March highs but remains in a relatively active range. Looking at the volume structure, precious metal assets like gold still dominate. However, compared to the peak daily volume of over $1.5 billion in mid-to-late March, recent overall volume has significantly contracted, with most trading days fluctuating between $300 million and $500 million. This reflects a market sentiment shift from extreme risk aversion to a digestion phase amidst consolidation. Concurrently, the share of stocks and commodities has slightly increased, suggesting capital is starting to diffuse from single gold trading to broader TradFi assets, with some users beginning to reposition into equity and cyclical assets.
• CEX TradFi Asset Classes:The number of TradFi asset classes on CEXs expanded further last week, with the total count across three major CEXs (tracking only the TradFi and CFD segments, excluding perpetual contracts) increasing from 955 to 956, a 0.1% WoW increase. The stock segment grew most significantly, rising from 590 to 594 stocks. Among mainstream exchanges last week, only Gate added 4 stocks to its TradFi offering, driving the overall 0.7% WoW increase.
• TradFi Order Book Depth:We selected XAUT, the highest volume TradFi asset, to analyze its order book depth (Delta). Between April 20 and 22, market depth Delta showed several significant negative values, nearing -$600,000 around the 21st. Concurrently, XAUT's price also rapidly fell from around $4,780 to below $4,700, indicating a temporary cooling of gold-related safe-haven sentiment. However, after the 22nd, the order book structure clearly turned bullish, with positive Delta values expanding continuously. Unilateral bid-side depth frequently remained in the $300,000 to $800,000 range, reaching a peak near $1,000,000 around the 23rd, indicating significantly strengthened supporting capital. Overall, XAUT is currently in a phase of "weak price but improving liquidity support," suggesting that while the Middle East situation hasn't fully dissipated and rate cut expectations are rising, demand for gold-related assets persists. However, short-term momentum to chase higher prices is significantly weaker than during the previous risk-off peak.
3. On-Chain Data Insights
3.1 Trading Volumes Flow Back to Spot and High-Turnover Scenarios, Liquidity Further Concentrates on Top Pools
This week, PancakeSwap's trading volume reached nearly $36 billion, significantly higher than Uniswap's $18.3 billion. Aerodrome, Curve, and Fluid recorded volumes between $2.5 billion and $3.5 billion. On the Solana side, Raydium and Meteora saw around $1 billion, but transaction counts exceeded 100 million, displaying a small-ticket, high-frequency characteristic. Trading volumes remain at high levels, suggesting on-chain trading demand hasn't contracted significantly. However, as capital shifts from credit-based DeFi to low-fee, high-turnover spot trading scenarios, liquidity is further concentrating in top-tier pools.
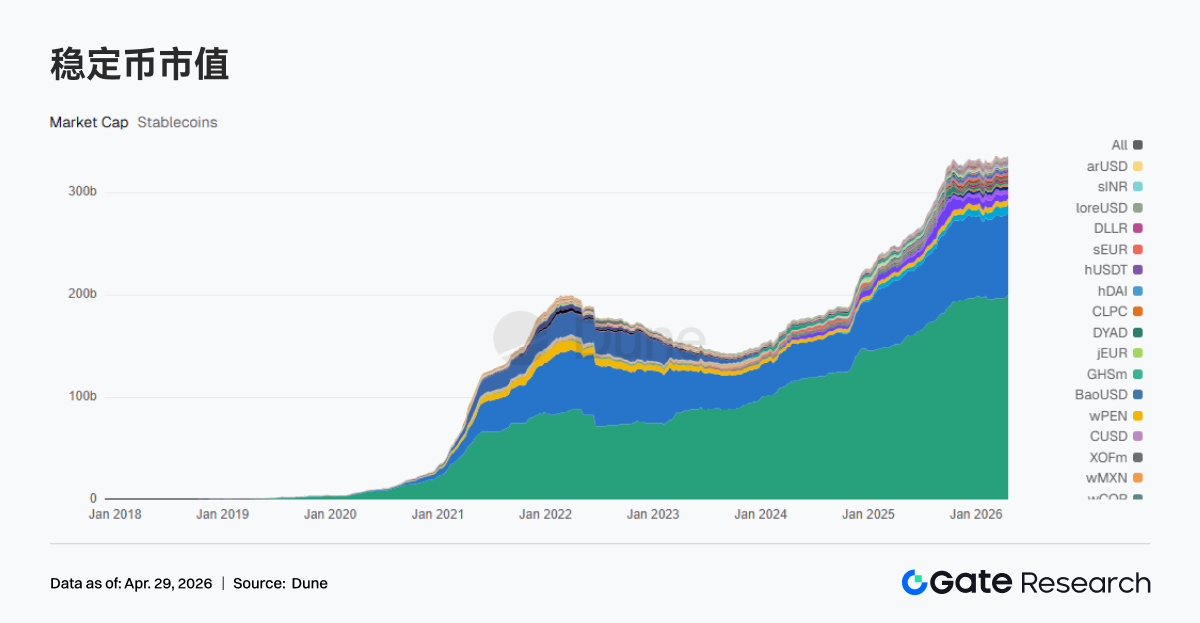
3.2 Stablecoin Capital Concentrates Towards Settlement USD, USDe Sees Nearly $2 Billion Weekly Net Outflow
Over the past week, USDT supply rose to $199.959 billion (+$2.418 billion WoW); USDC to $80.391 billion (-$184 million WoW); USDS to $8.136 billion (+$340 million WoW); USDe to $4.410 billion (-$1.997 billion WoW); PYUSD to $2.750 billion (-$677 million WoW). This week, stablecoin capital overall concentrated towards directly settleable, quickly transferable USD assets, while yield-bearing and synthetic stablecoins experienced significant net outflows. USDe saw a net outflow of nearly $2 billion. Top stablecoins are all prioritizing their settlement layers and compliant assets: Circle partnered with OSL to launch a 1:1 USD/USDC conversion and unified margin system; Tether assisted law enforcement in freezing $344 million USDT.
3.3 LST Risk Starts Pricing in Complex Pathways, Slight Decline Across Top Protocols
Leading LST protocols on ETH and Solana, such as Lido, Rocket Pool, Jito, and Jupiter Staked SOL, all experienced minor outflows ranging from 2% to 5% over the past week. Following the rsETH incident, the market hasn't rejected staking yields but is repricing the risks associated with cross-chain and restaking pathways. The scale of top LST protocols decreased slightly, while more complex, yield-enhancing pathways saw more significant pullbacks. A leading LST protocol like Lido recently proposed deploying up to 2,500 stETH for a rescue operation, further illustrating the broad impact range of systemic risk and the need for collective action among relevant DeFi protocols.
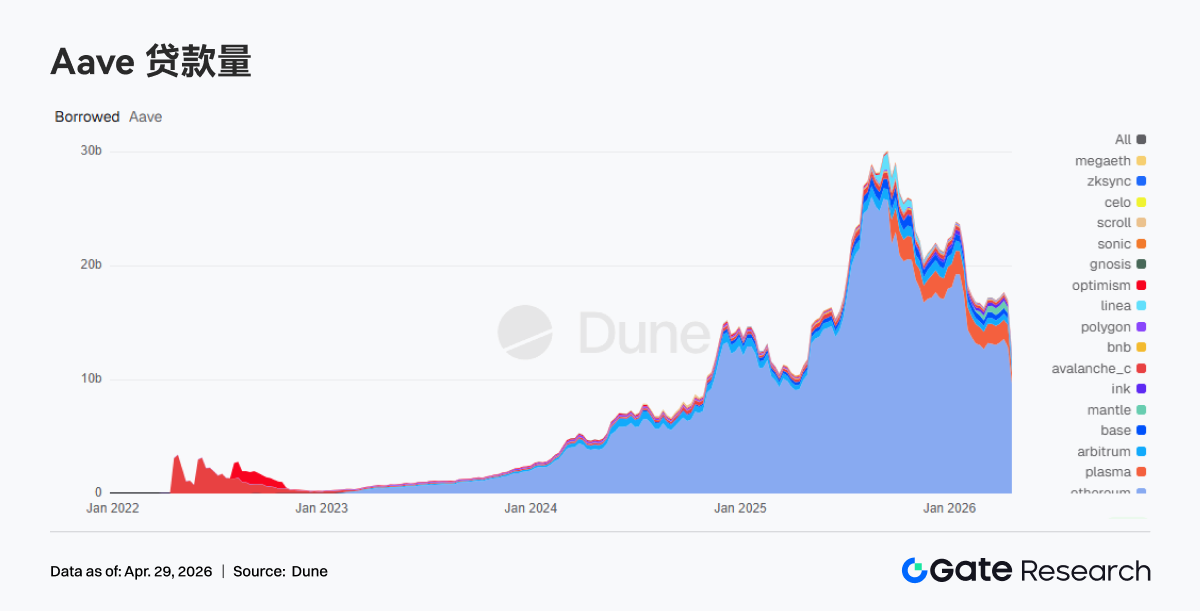
3.4 Aave Lending Balance Plunges, Capital Flees to Competitors
Aave's total lending balance dropped from $17.027 billion the previous week to $12.481 billion, a decrease of $4.546 billion for the week, or -26.7%. The Ethereum mainnet balance fell from $12.880 billion to $9.671 billion, and Plasma dropped from $1.930 billion to $942 million. The lending balance showed a stepwise decline, characteristic of a capital retreat triggered by a risk event. Following the rsETH incident, Aave froze rsETH/wrsETH across multiple chains and restricted new WETH borrowing, further accelerating position contraction. Most of this capital did not leave the chain but moved to Aave's competitor, Spark.
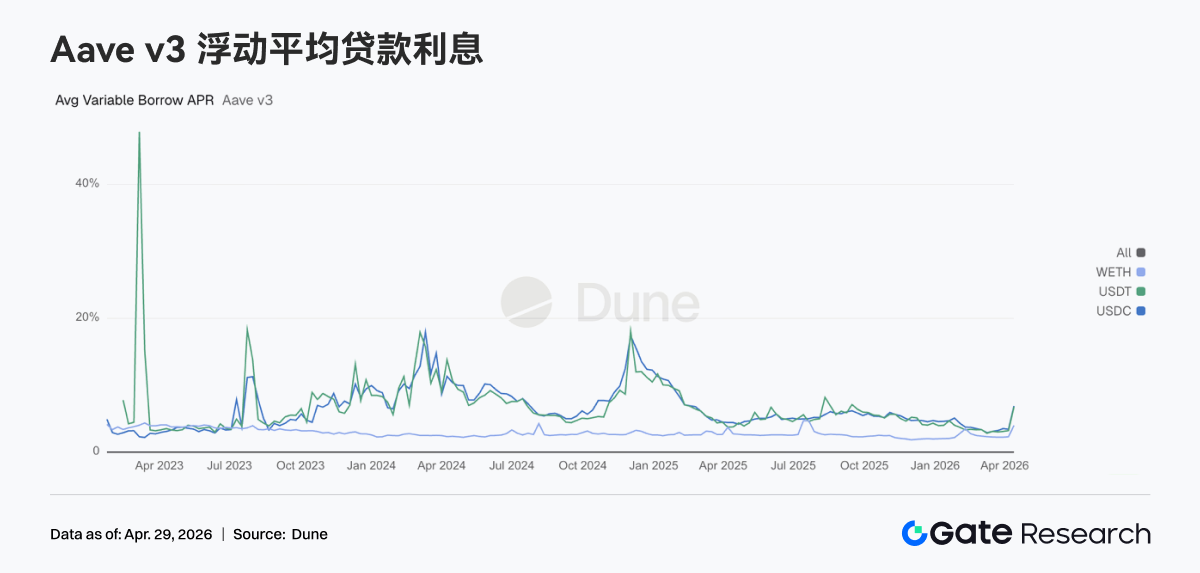
3.5 Liquidity Tightens Periodically, Aave Core Asset Rates Rise Significantly
Over the past week, in Aave's Ethereum V3 market, the average borrowing rate for USDC rose to 12.50% (from 6.91%), USDT to 13.30% (from 6.76%), and WETH to 5.21% (from 4.00%). The rate increase reflects a contraction in stablecoin liquidity. Due to the ongoing risk contagion from the rsETH security incident, utilization rates for core assets like USDC in the Ethereum Core market approached nearly 100%, making some liquidity unavailable for withdrawal and keeping borrowing rates high. Market demand for withdrawable dollar liquidity rose significantly, pushing the chain into a phase of liquidity repair. However, with the gradual progress of joint rescue efforts, asset rates are expected to return to normal ranges in the coming weeks.
3.6 Revenue Flows Back to Settlement and Volatility Circuits, Lending Protocols Benefit
Tether and Circle revenues remained largely flat. Hyperliquid and Pump saw declines of over 10% in a single week. Amidst rate volatility, Aave's revenue grew over 40% in a single week, reaching nearly $2.9 million. Stablecoin issuance and settlement remain the most stable cash flow sources. Revenue among trading protocols is beginning to diverge, while lending protocols generate more income during volatility and position restructuring. The increase in Aave's revenue alongside a decrease in lending scale also reflects shorter positions and faster capital turnover.
4. Derivatives Tracking
4.1 Deeply Negative BTC Funding Rate Coupled with Rising OI, Short-Squeeze Structure Continues to Strengthen
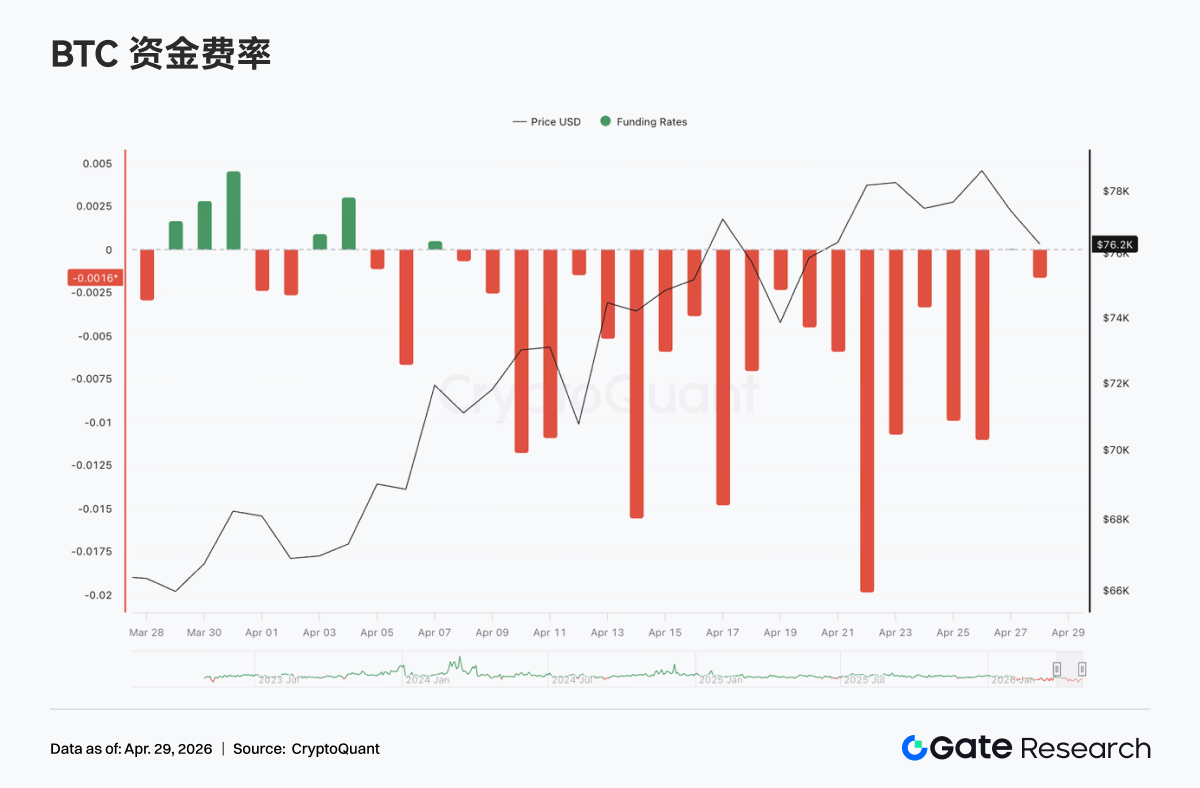
Over the past week, the BTC perpetual contract funding rate remained in negative territory, showing multiple instances of extreme negative values (lowest near -0.02) around mid-to-late April. This indicates that bearish sentiment and short-side crowding persist at high levels. Correspondingly, BTC's price has oscillated upwards since the beginning of April, surging to around $78K around April 20. This presents a typical divergence structure of "deeply negative funding rate but maintaining high price levels," indicating short-sellers are facing upward price pressure while continuously paying funding fees.
Concurrently, Open Interest (OI) showed an overall oscillating upward trend, climbing from ~$21B to above $25B. Although there were periodic pullbacks, the overall center of gravity clearly rose. The combination of persistently negative funding rates and rising OI implies that, amidst the price oscillation and strengthening, new positions are predominantly short. This forms a classic divergence structure of "shorts adding positions + price not declining."
Around April 17 and April 22, OI saw rapid surges, corresponding to periods of price increase and high-level consolidation. The funding rate remaining deeply negative during these price increases suggests that shorts did not effectively stop out but continued to add positions. This combination of "negative funding + OI expansion + price strengthening" typically implies that short-squeeze momentum is continuously accumulating. Once the price breaks further out of its range, short covering could accelerate the upward move. However, it's important to note that a high OI accompanied by a highly divergent structure also means the market leverage is elevated. If the price weakens, the deleveraging process could amplify volatility.
4.2 Options Volume Shows Periodic Spikes, Monthly Contract Dominance Unchanged
Trading volume in the BTC options market overall showed a pattern of periodic amplification, with notable peaks around April 17 and April 23, where daily volumes were significantly higher than the weekly average. Structurally, monthly options continue to dominate, with their share consistently higher than weekly and daily options. This indicates that market participants are primarily positioning for medium-term structural moves,


