
LD Capital:多维度分析BTC是否真正属于避险资产
原文作者:Lisa,LD Capital
BTC 被喻为“数字黄金”,而交易员又常常将纳斯达克指数作为 BTC 价格变化的重要参考,黄金与纳指分别是避险资产和风险资产的典型代表,这看上去似乎是矛盾的。本文将通过探究 BTC 与黄金的价格影响因素揭开 BTC 是否属于避险资产的面纱。
一、黄金与 BTC 概述
1、黄金
黄金的计量单位
“盎司”是国际上通用的黄金计量单位, 1 金衡盎司= 1.0971428 常衡盎司= 31.1034768 克。
黄金的成色
成色是指金属的纯度,一般以千分比表示,还可用“开”或“K”表示。黄金的成色/纯度可分为 24 “开”或“K”。每开(英文 carat、德文 karat 的缩写,常写作”k”)含金量为 4.166% ,各开金含金量分别为:
8 k= 8* 4.166% = 33.328% ( 333 ‰) 9 k= 9* 4.166% = 37.494% ( 375 ‰)
10 k= 10* 4.166% = 41.660% ( 417 ‰) 12 k= 12* 4.166% = 49.992% ( 500 ‰)
14 k= 14* 4.166% = 58.324% ( 583 ‰) 18 k= 18* 4.166% = 74.998% ( 750 ‰)
20 k= 20* 4.166% = 83.320% ( 833 ‰) 21 k= 21* 4.166% = 87.486% ( 875 ‰)
22 k= 22* 4.166% = 91.652% ( 916 ‰) 24 k= 24* 4.166% = 99.984% ( 999 ‰)
例如伦敦金的标准交割对象是含金量不低于 99.50% 的 400 盎司金锭;上海金则有 Au 99.99、Au 99.95、Au 99.5、Au 50 g、Au 100 g 等交割品种:
Au 99.99 为标准重量 1 千克、成色不低于 99.99 %的金锭,
Au 99.95 为标准重量 3 千克、成色不低于 99.95 %的金锭,
Au 99.5 为标准重量 12.5 千克、成色不低于 99.50 %的金锭,
Au 50 g 为标准重量 0.05 千克、成色不低于 99.99 %的金条,
Au 100 g 为标准重量 0.1 千克、成色不低于 99.99 %的金条。
黄金的总市值
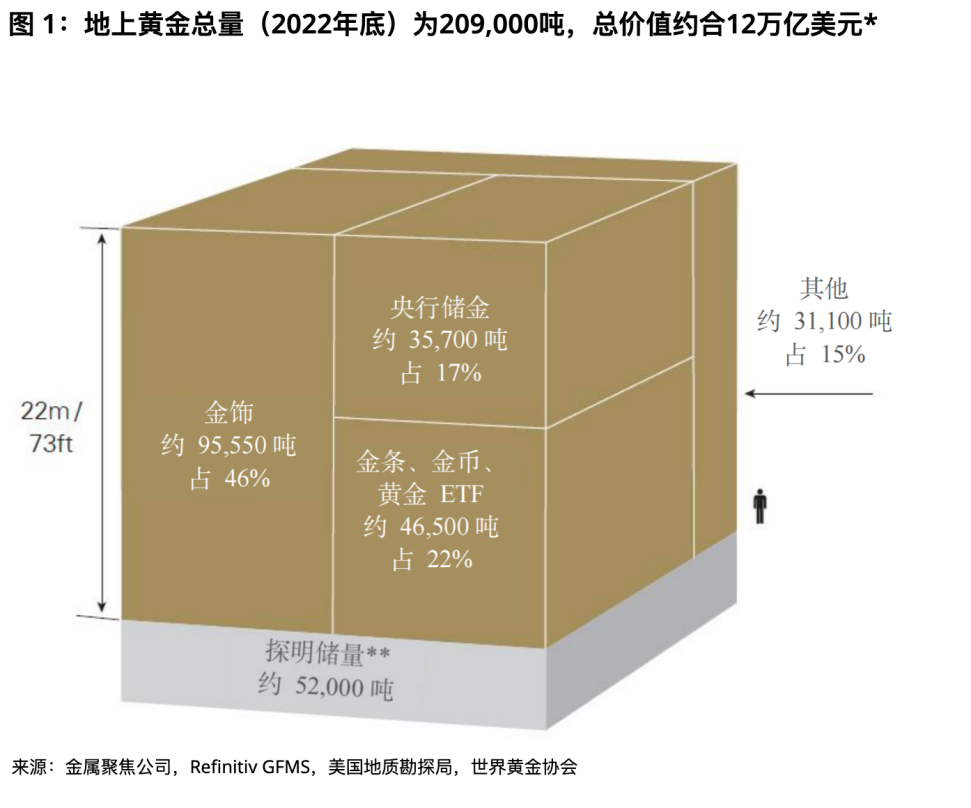
根据世界黄金协会估计,估计已有约 209, 000 吨黄金被开采出来,价值约合 12 万亿美元,其中大约三分之二在 1950 年后开采。如果将现存黄金全部堆放在一起,其形成的纯金立方体边长可达 22 米(或 73 英尺)。
其中以金饰形式存在的黄金约占总量的 46% (约为 95, 547 吨,约合 6 万亿美元);
各国央行持有 17% 的黄金(约为 35, 715 吨,约合 2 万亿美元)作为储备;
以金条和金币形式存在的黄金约占总量的 21% (约为 43, 044 吨,约合 3 万亿美元);
由实物支持的黄金 ETF 基金约占总量的 2% (约为 3, 473 吨,约合 0.2 万亿美元);
其余部分则用于各种工业用途或由其他金融机构持有,约占总量的 15% (约为 31, 096 吨,约合 2 万亿美元)。
黄金交易量
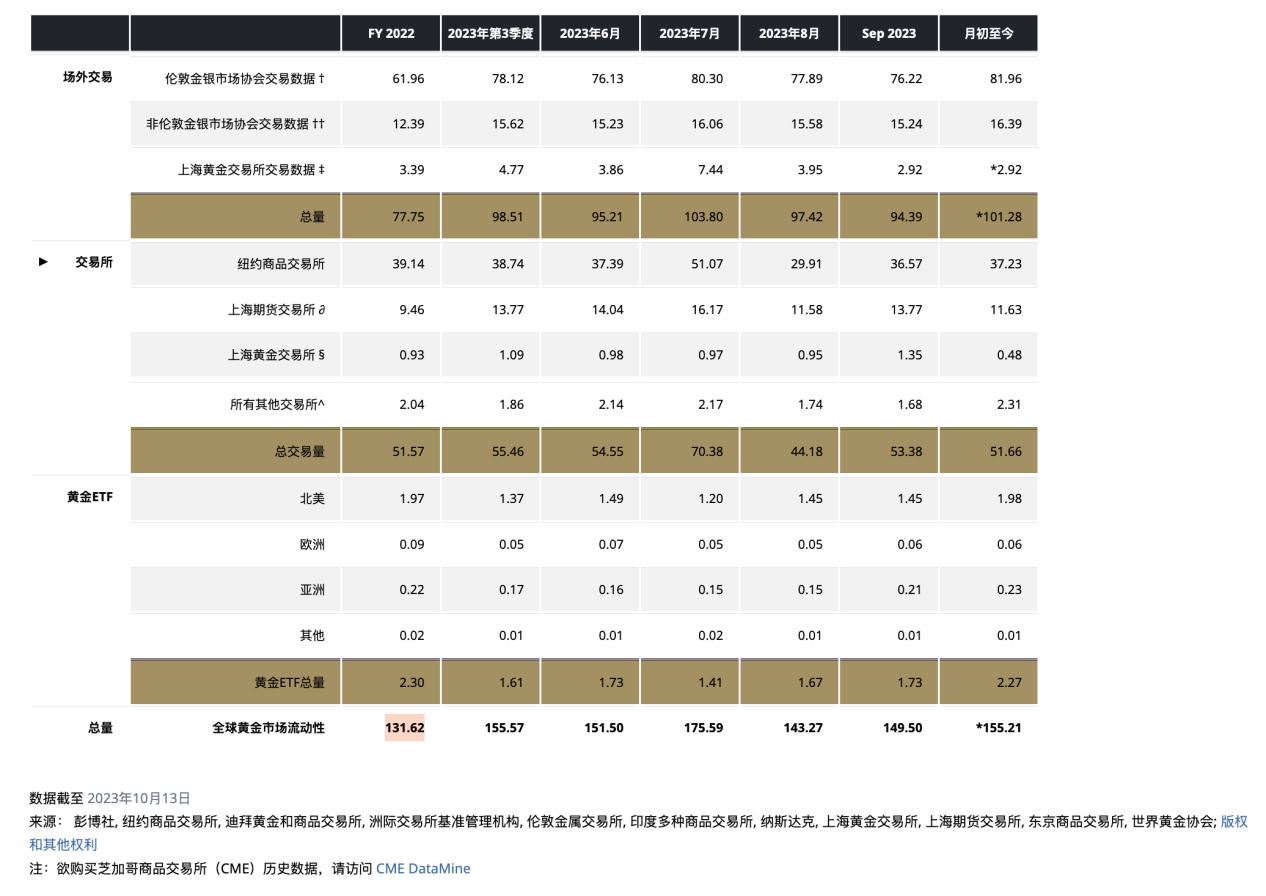
黄金是世界上流动性最好的资产之一, 2022 年的日平均交易额为 1316 亿美元。其中主要的交易场所有伦敦 OTC 市场、美国期货市场和中国市场。伦敦 OTC 市场始于 1919 年,属于黄金现货 OTC 市场,是黄金交易的中心,伦敦金银市场协会 (the London bullion market association,LBMA)每天产生 2 次黄金参考价格(伦敦时间上午 10 ∶ 30 及下午 3 ∶ 00)作为市场参与者进行交易的基准;纽约商品交易所(COMEX)的黄金市场是目前世界上最大的黄金期货市场;上海黄金交易所(Shanghai Gold Exchange,SGE)于 2002 年 10 月 30 日正式开业,为中国黄金市场提供了现货交易平台;上海期货交易所(Shanghai Futures Exchange,SHFE)期货交易对上海黄金交易所的现货交易进行了补充。
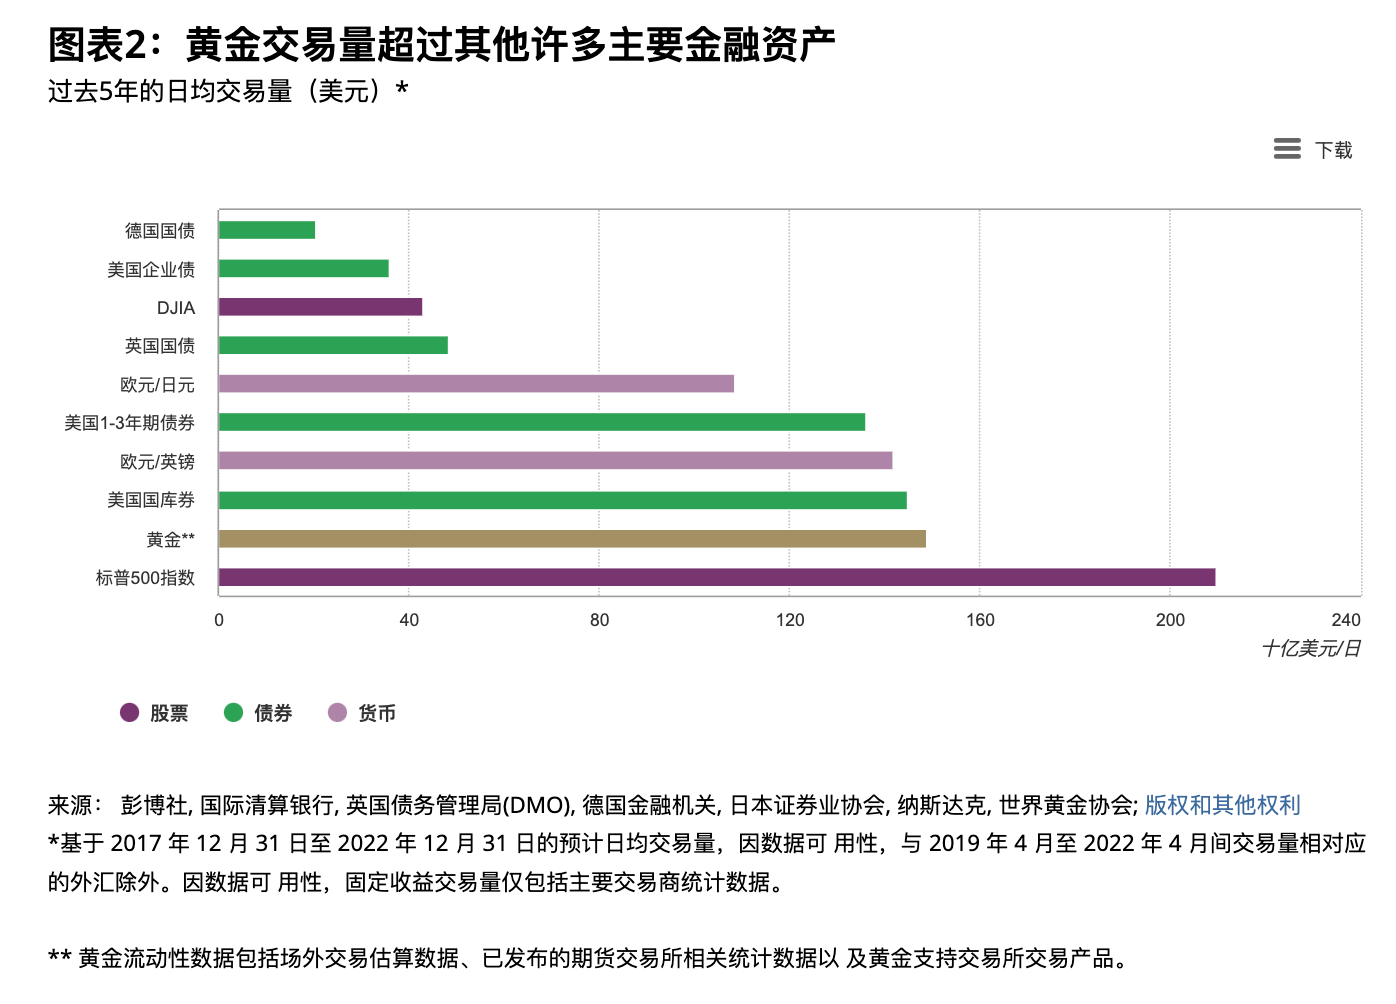
黄金日均交易量(单位:十亿美元)
2、BTC
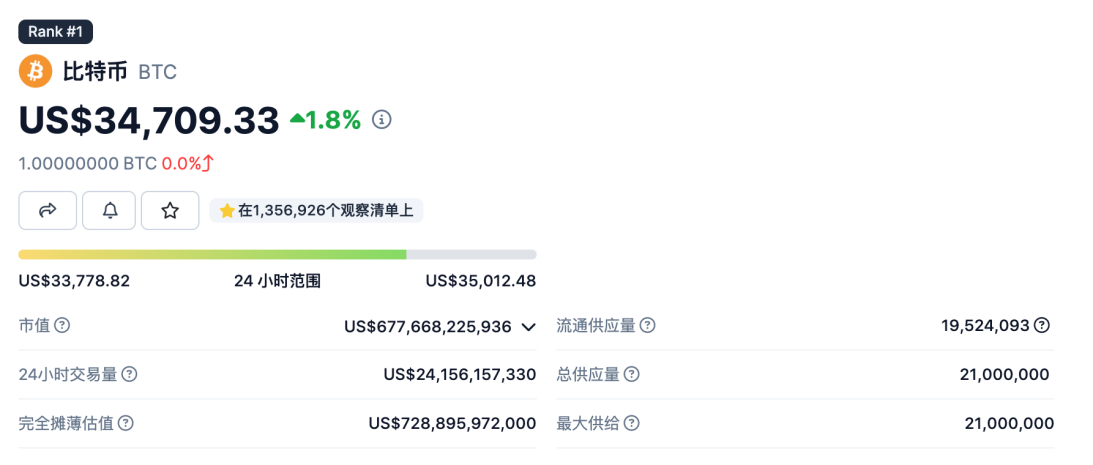
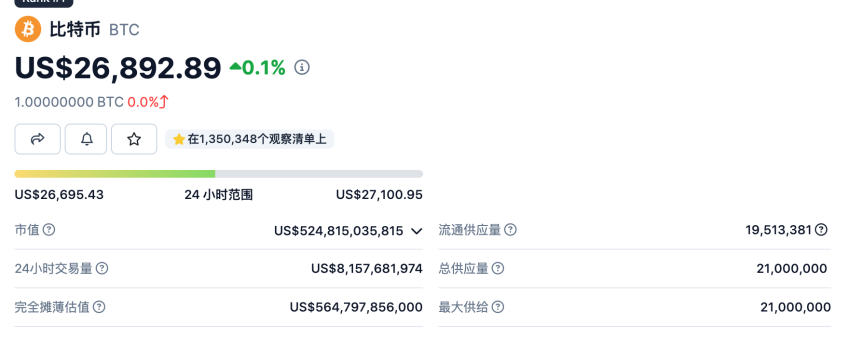
BTC 24 小时交易量约为 240 亿美元,其中主要的交易量发生在永续合约,近期 BTC 日均交易量上涨明显, 24 小时交易量约为黄金的 15% (本轮行情之前大概在不到 10% 的水平),现货和永续合约最大的交易场所都在币安。
当前 BTC 总市值 6777 亿美元,约为黄金总市值的 5.6% 。
二、黄金与 BTC 的价格影响因素
1、供需关系
黄金
黄金的供给
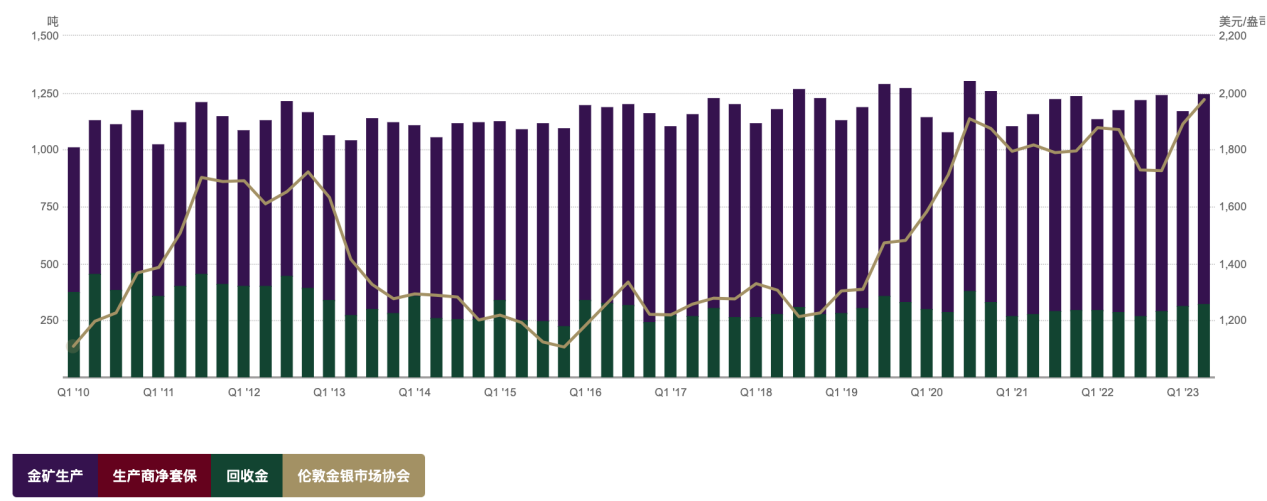
全球黄金每年的新增供应量较为稳定, 2016 – 2022 年维持在 4800 吨左右。由于黄金不易损耗,消费领域的黄金仍以某种形式存在,可以通过回收再次进入循环进供应。因此黄金供应来自于矿山生产及黄金回收两部分。2022 年黄金回收总量 1140.6 吨,矿山生产总量 3626.6 吨,约有四分之三供应来自于金矿山的开采,四分之一的供应来自于黄金回收。可以从下图发现黄金的供给稳定,多年来未出现趋势性大波动,因此黄金相对刚性的供给对价格的影响较小。
黄金的需求
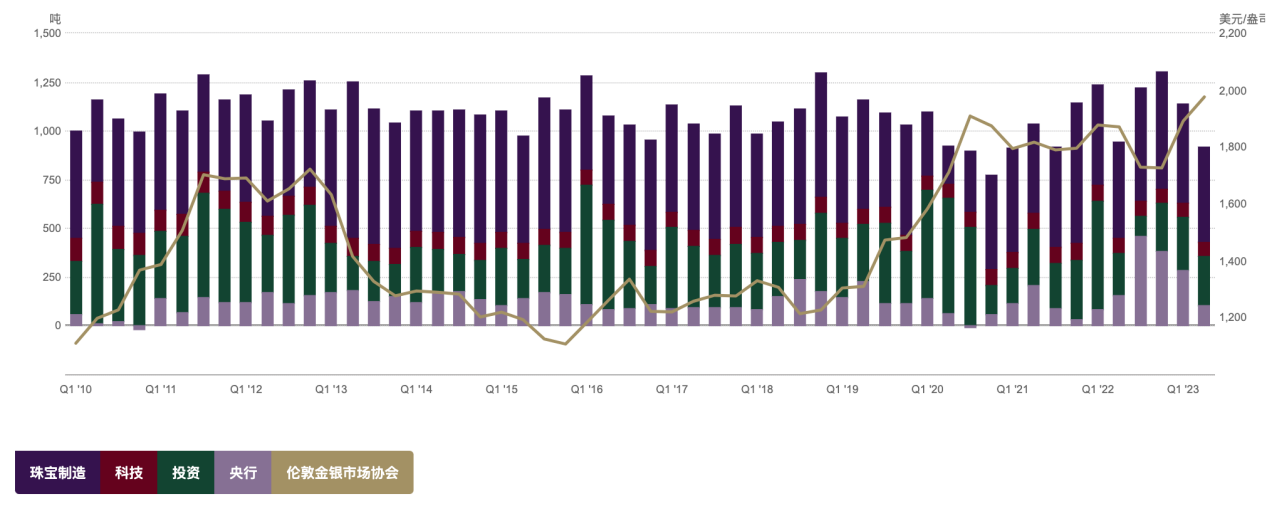
2022 年全球黄金需求总量 4712.5 吨, 2023 年上半年,全球黄金需求总量达到 2460 吨,同比增长 5% 。黄金的需求包括黄金饰品、医学科技等消费领域、投资需求、以及各国央行储备。2022 年珠宝制造、科技、投资和央行的黄金需求分别为 2195.4 吨、 308.7 吨、 1126.8 吨和 1081.6 吨,其中占比最大的是珠宝制造达到 47% ,央行需求占比为 23% 。受到传统文化影响,中印是全球最大金饰消费国, 2022 年中国和印度分别占到全球金饰需求占比的 23% 。
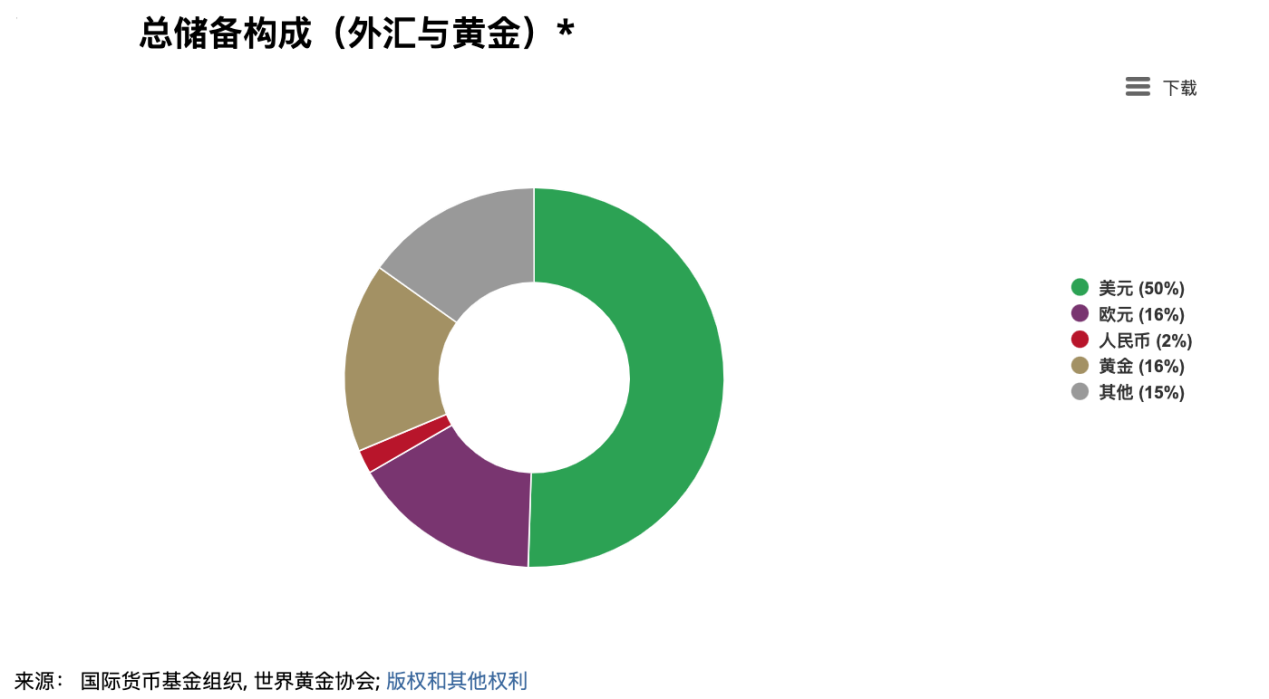
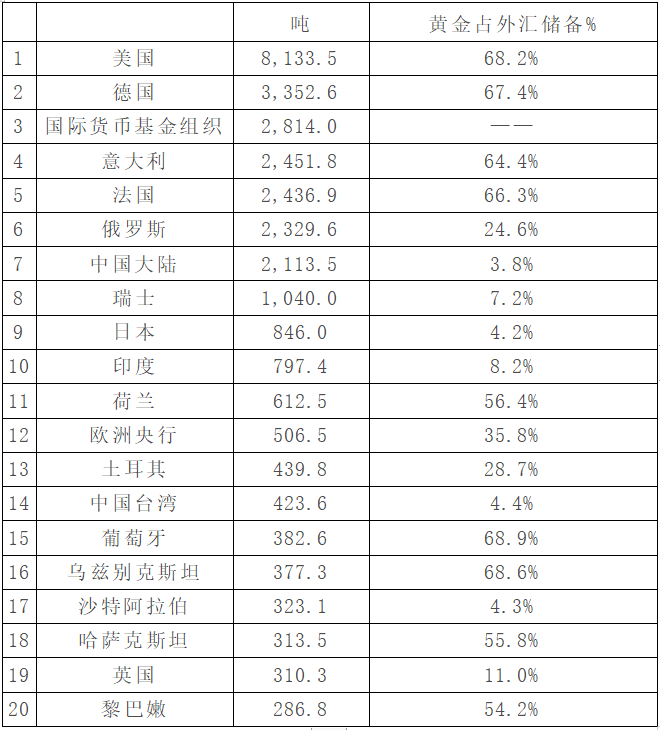
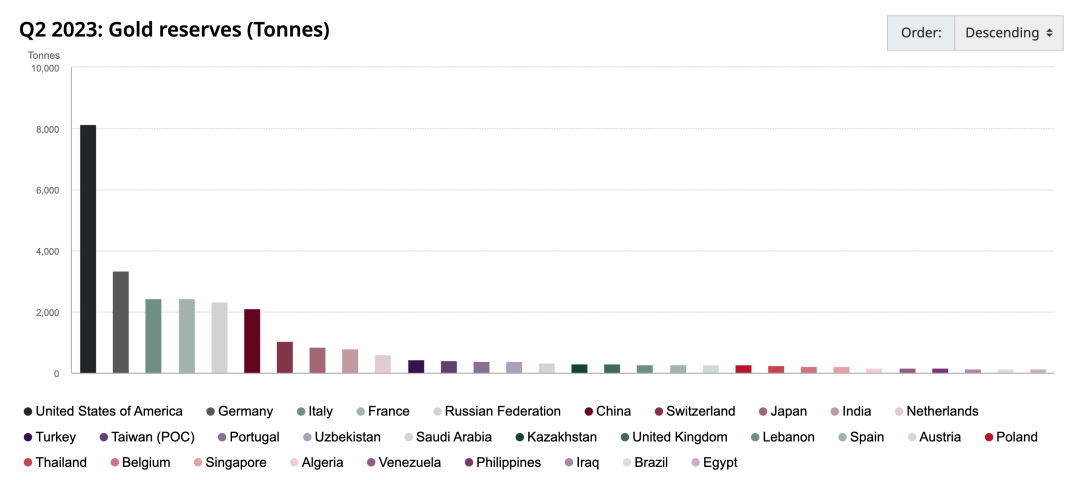
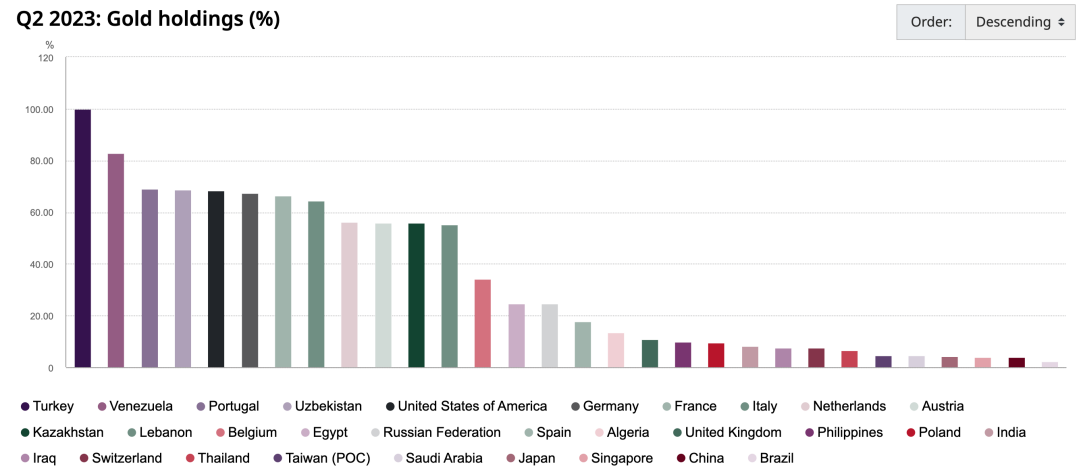
黄金是全球央行储备的重要组成部分,各个国家或地区黄金占央行储备的比例差异较大,比如美国和德国接近 70% ,而中国大陆仅为 3.8% ,日本为 4.2% 。俄乌冲突爆发后,美国与欧洲冻结俄罗斯央行美元外汇储备,导致非美经济体国家对美元安全性产生动摇,多元化外汇储备的需求上升,转向增加黄金储备。随着未来去美元化的推进,长期来看全球央行系统性增持黄金储备的趋势将愈加凸显。
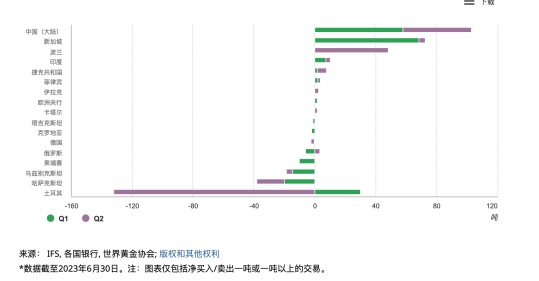
全球黄金储备前二十国家/组织
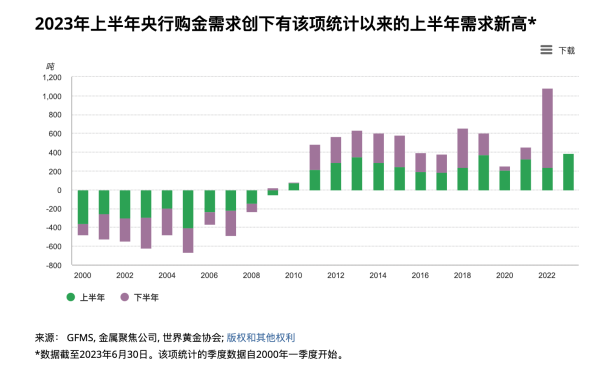
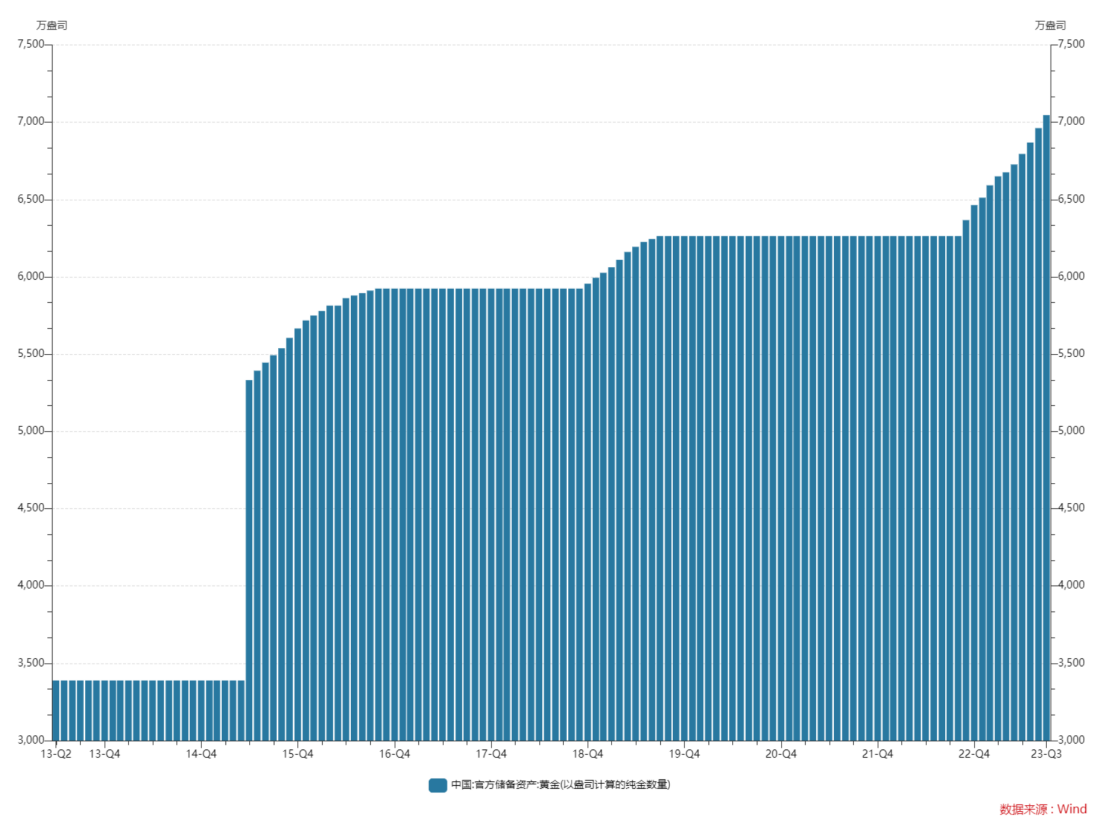
根据世界黄金协会的数据,从 2022 年下半年开始央行的购金需求有剧烈上升, 2022 年下半年总计购金 840.6 吨,为 2021 年全年总量的 1.8 倍。今年上半年央行购金需求相对去年下半年有所汇率,但也高达到 387 吨,创下自 2000 年以来有该项统计以来的新高。其中土耳其因政治局势一度不稳国内黄金需求旺盛,政府临时禁止部分金条进口并向国内市场出售黄金,不代表土耳其长期黄金战略的转变。总体上二季度土耳其的售金并未削弱整体央行黄金需求的积极趋势,其中购金数量最大的是中国大陆,一二季度分别购入 57.85 和 45.1 吨。10 月 13 日数据, 9 月末中国黄金储备报 7046 万盎司,环比增加 84 万盎司,为连续第 11 个月增加,过去 11 个月中国央行黄金储备累计增持规模达 782 万盎司。历史上中国央行购金呈现战略性特征几乎不抛售。
BTC
BTC 总供应量固定为 2100 万枚,当前的流通量为 1951 万个,占总供应量比例约为 90% 。
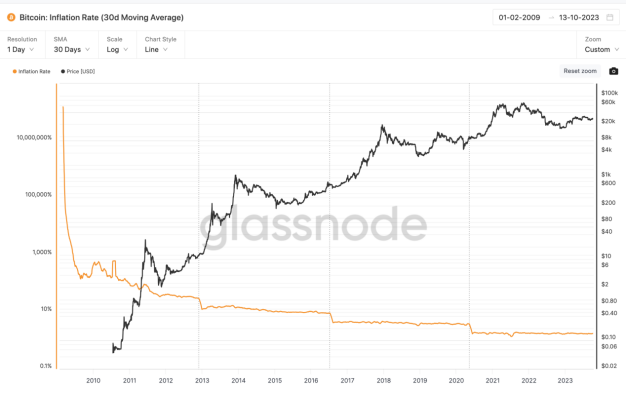
目前 BTC 的通胀率大概在 1.75% 左右,黄金每年的通胀率在 2% 左右,两者较为接近。由于比特币减半的设置未来比特币 BTC 的通胀率将会显著低于黄金,最近一次(2020 年)减半将每个区块中发行的比特币数量从 12.5 个减少到 6.25 个,下一次减半预计会发生在 2024 年的 4 月底。
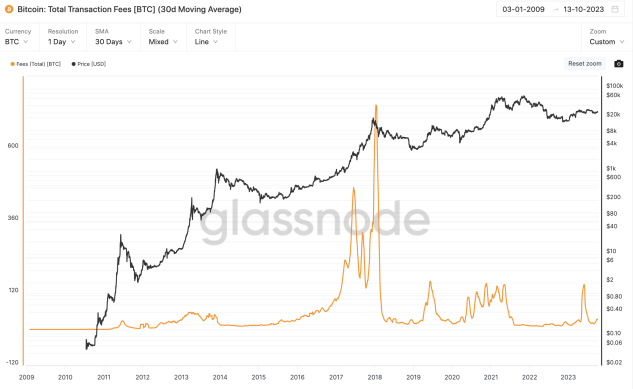
需求方面分为手续费和投资需求两部分。BTC 今年大部分时间每天消耗的手续费大约在 20 – 30 个 BTC,粗略估计手续费支出 1 年大约在 1 万个左右的水平,占到流通总量的 0.5% 。除此之外的部分即为投资或投机需求。
2、宏观环境
从布雷顿森林体系解体到 2000 年左右,通胀预期和避险需求是黄金价格的主要决定因素, 2004 年黄金市场开始引入 ETF,随着黄金 ETF 的推出以及黄金相关交易市场的扩容,黄金的金融属性增强,实际利率和美元指数成为黄金价格的重要影响因素。
美元指数
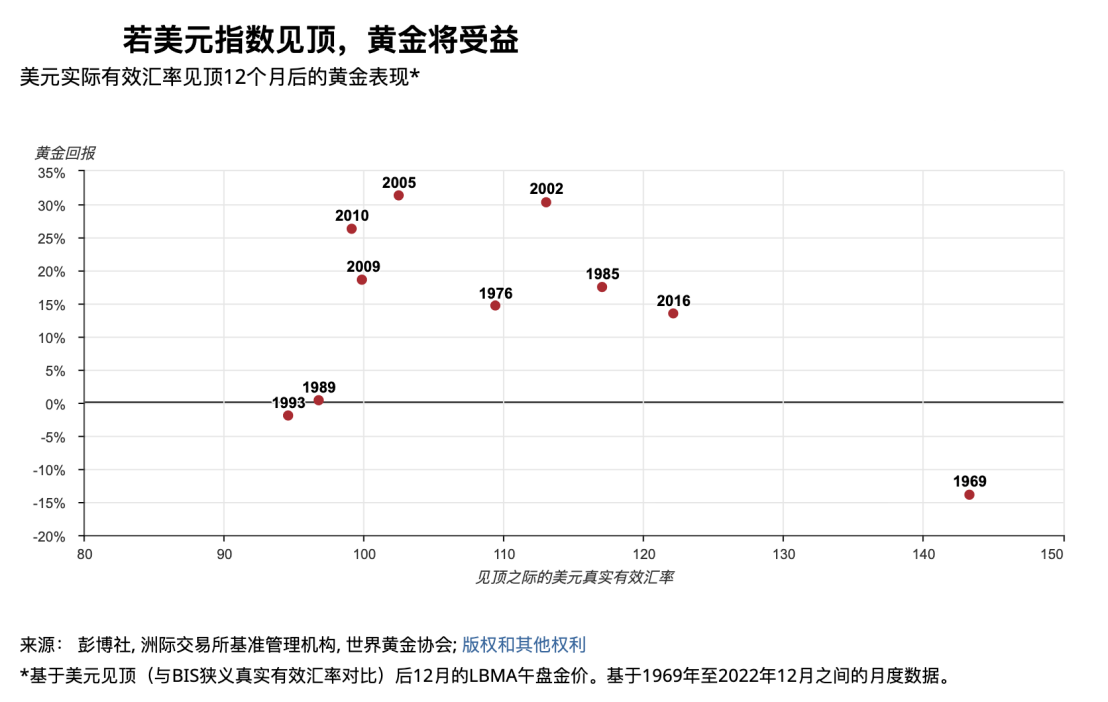
理论上黄金价格通常与美元的价值成反比,因为黄金以美元计价,美元上涨会使得黄金价格相对较高,黄金在本身价格不变的情况下变得更贵了,对金价形成向下的压力;从另一个角度,从长周期视角看,在布雷顿森林体系崩溃后美元脱离金本位,黄金本质上是信用货币(主要指美元)的对冲品,美元信用越强,黄金配置价值越低,美元信用越弱,黄金配置价值越高。黄金和美元同步上涨期的时期则通常伴随石油危机、次贷危机、债务危机等地缘政治或经济冲击发生,市场谨慎和避险情绪显著升温。
历史上美元指数在触顶 12 个月后 80% 的时间里黄金收益率为正值(平均收益率+ 14% ,中位数+ 16% )。
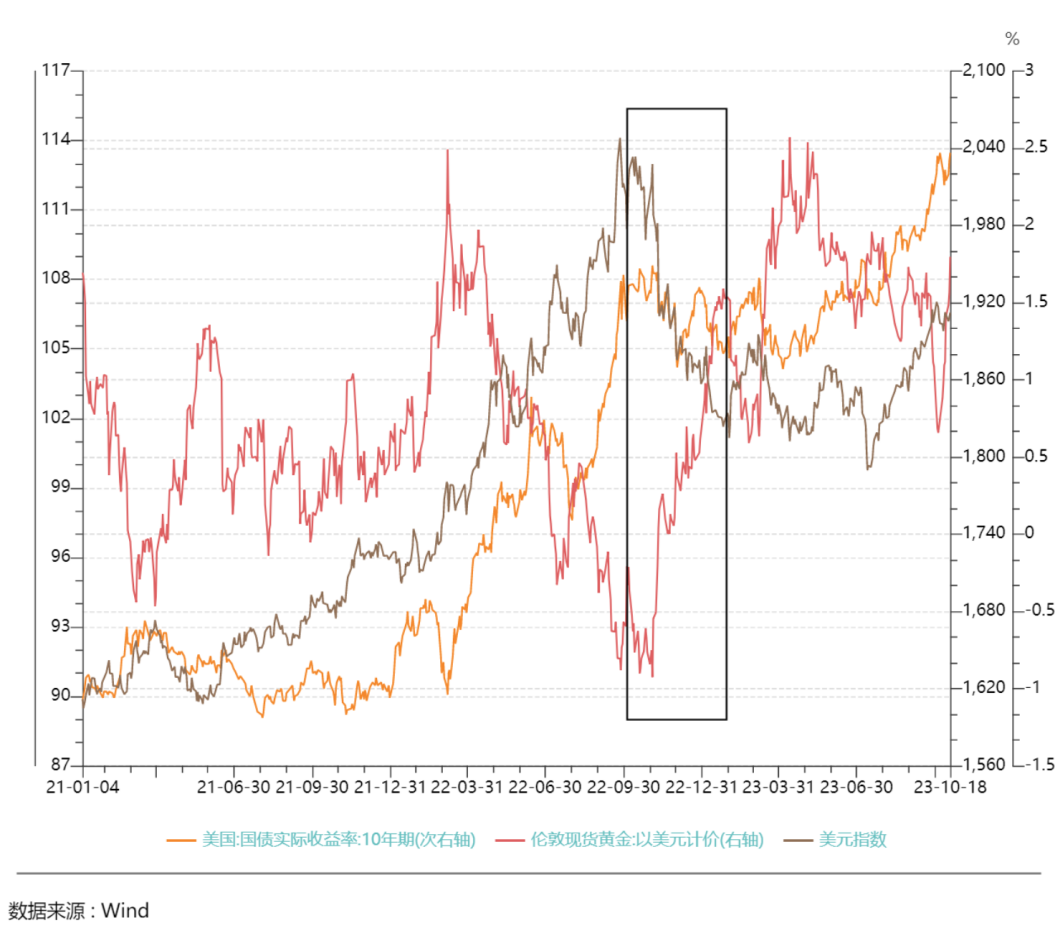
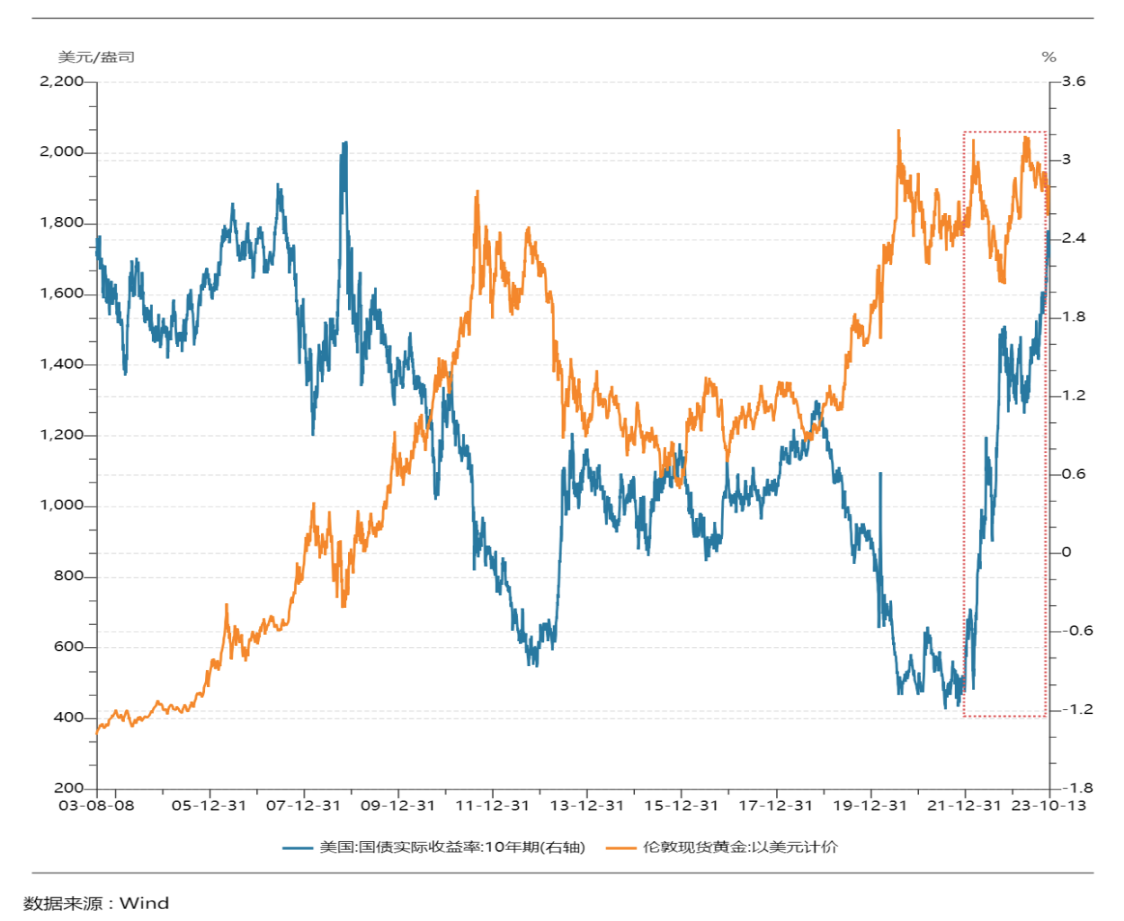
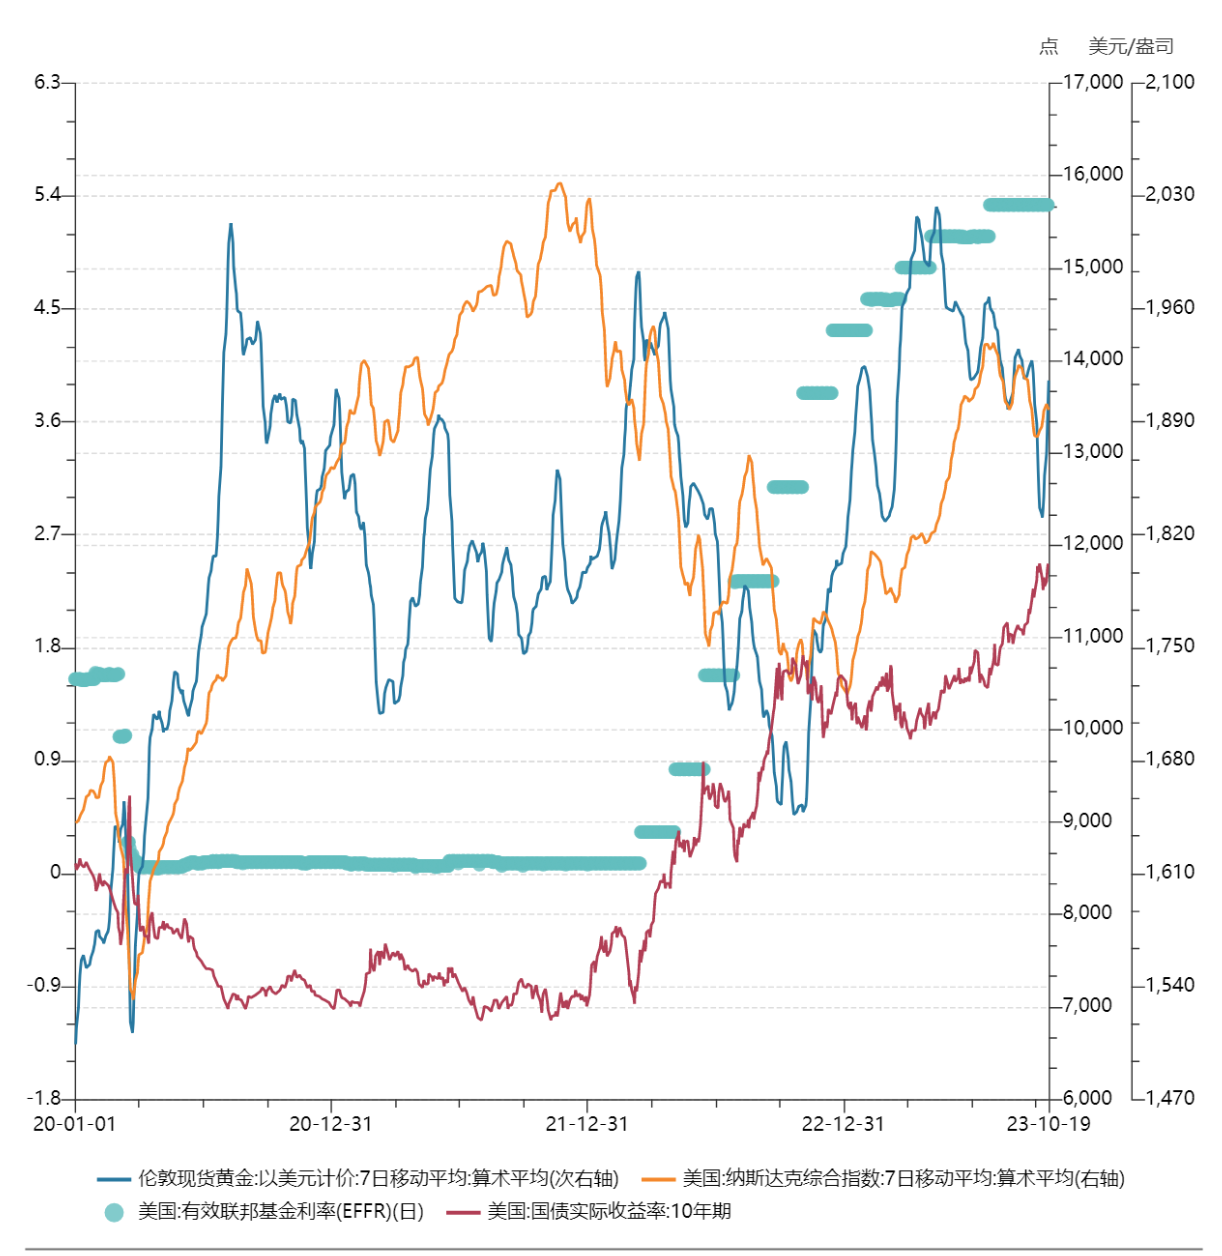
2022 年四季度到 2023 年初,美国 10 年期国债实际收益率保持震荡没有出现大幅波动,但金价从约 1600 美元的低点升至 2000 美元/盎司,金价偏离了美国长期收益率的掣肘。而从 2022 年 10 月到 2023 年 1 月,由于中国疫情放开后的经济复苏预期和欧洲经济反弹等原因,美国以外的增长势头更为强劲,导致 DXY 下跌了近 9% ,这段时期黄金体现出主要跟随 DXY 的上涨。
美债实际收益率
黄金是无息资产,美元是生息资产,美元收益率以及通胀预期是驱动黄金价格变化的两股力量,美国的实际利率(名义利率-通货膨胀预期)即是持有黄金的机会成本,理论上两者呈负相关的关系。从另一个角度美国实际利率代表了在美元体系中所能够实现的真实回报率水平,是可以用来衡量美元信用强弱的指标。
美元指数和美债实际收益率都可以用来解释黄金价格的变动,在不同的时期黄金与两者分别的相关性有所差异。二十一世纪以来,除了 2005 年之前的阶段,绝大部分的时间金价与 10 年期美国国债实际收益率呈显著的负相关关系,美国国债实际收益率主导金价的时间比美元指数时间相对更久,可以认为实际利率是影响黄金长期价格最重要的因素。
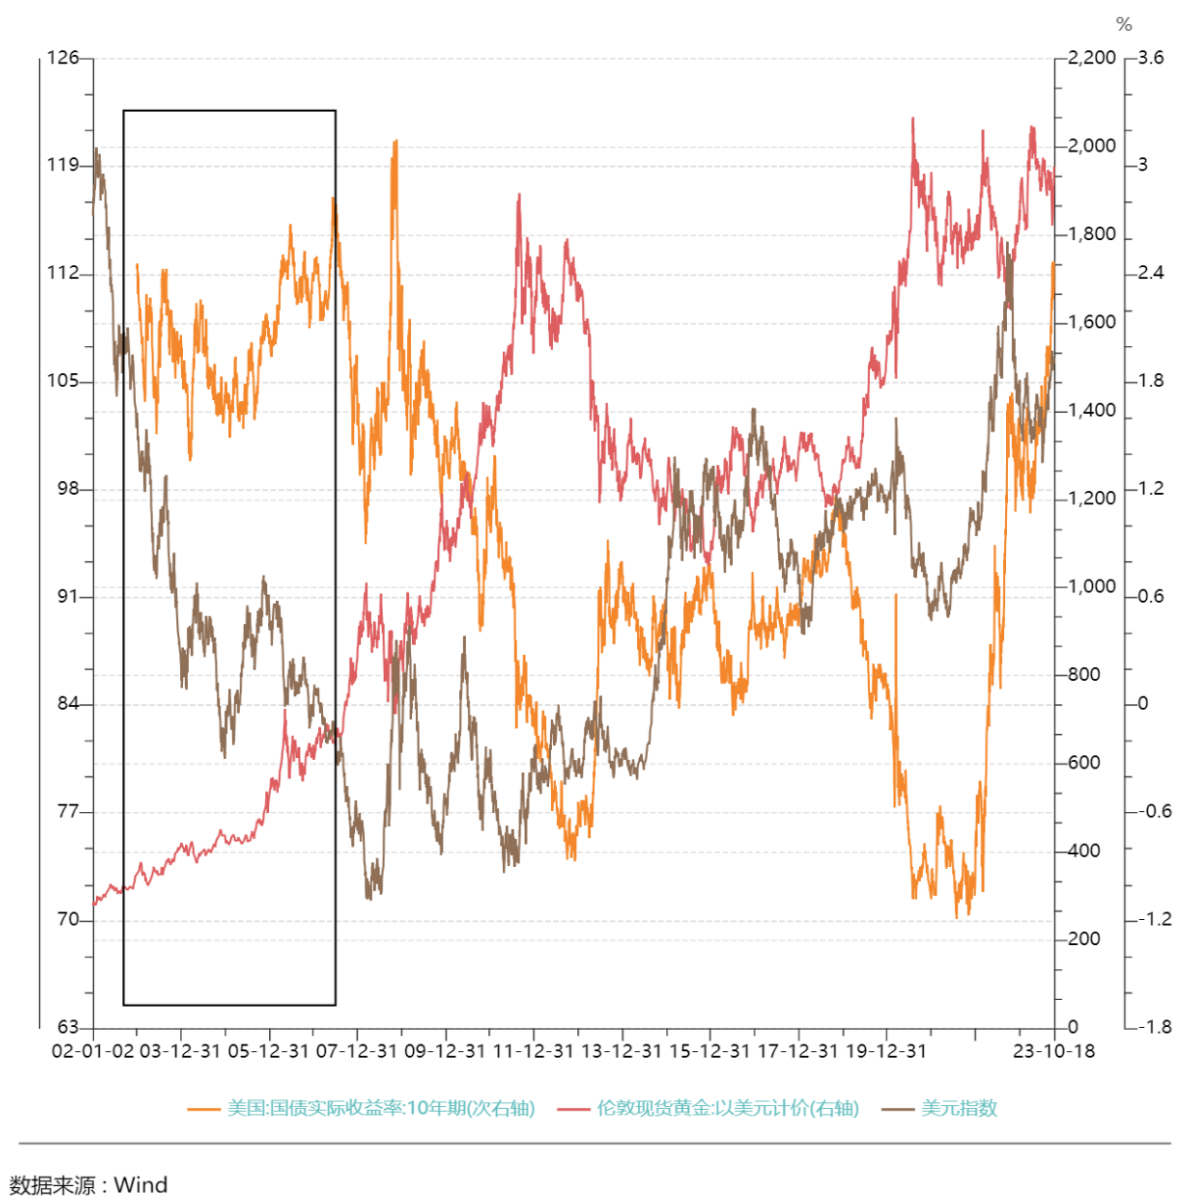
2022 以来黄金价格对实际利率的敏感程度有所下降,随着美债实际收益率快速上升,黄金价格下跌程度比历史上要低,体现出较好的韧性,实际收益率和美元指数都不能充分解释黄金这段时间的价格变化,这可能主要与 2022 年下半年开始的央行购金热有关。世界黄金协会 10 月 9 日发布报告称全球央行年度黄金储备总量将保持强劲增长态势, 8 月全球央行黄金储备增加 77 吨,较 7 月增加了 38% ,黄金市场需求端可能正在发生结构性的变化。
3、地缘政治
所谓乱世买黄金,地缘政治冲突的爆发会增加资金避险需求,刺激黄金价格短期较快上涨,如 2022 年俄乌和巴以冲突后金价都上涨 2000 美元/盎司附近,是美国实际收益率和美元未能解释的部分。
俄乌战争后的资产价格变化
2022 年 2 月 24 日,俄罗斯总统普京宣布:俄罗斯军队将进行一场“以乌克兰非军事化和去纳粹化”为目标的军事行动,俄罗斯军队没有占领乌克兰领土的计划,并支持乌克兰人民的自决权。普京讲话结束的几分钟后,俄罗斯军向基辅、哈尔科夫和第聂伯罗的军事基地和机场发射巡航导弹和弹道导弹,乌克兰国民卫队司令部被摧毁。随后俄军向乌克兰控制的卢甘斯克地区、苏梅、哈尔科夫、切尔尼戈夫、日托米密尔等地发起进攻,在乌克兰南部城市马里乌波尔和敖德萨两地,俄军开展大规模两栖登陆。
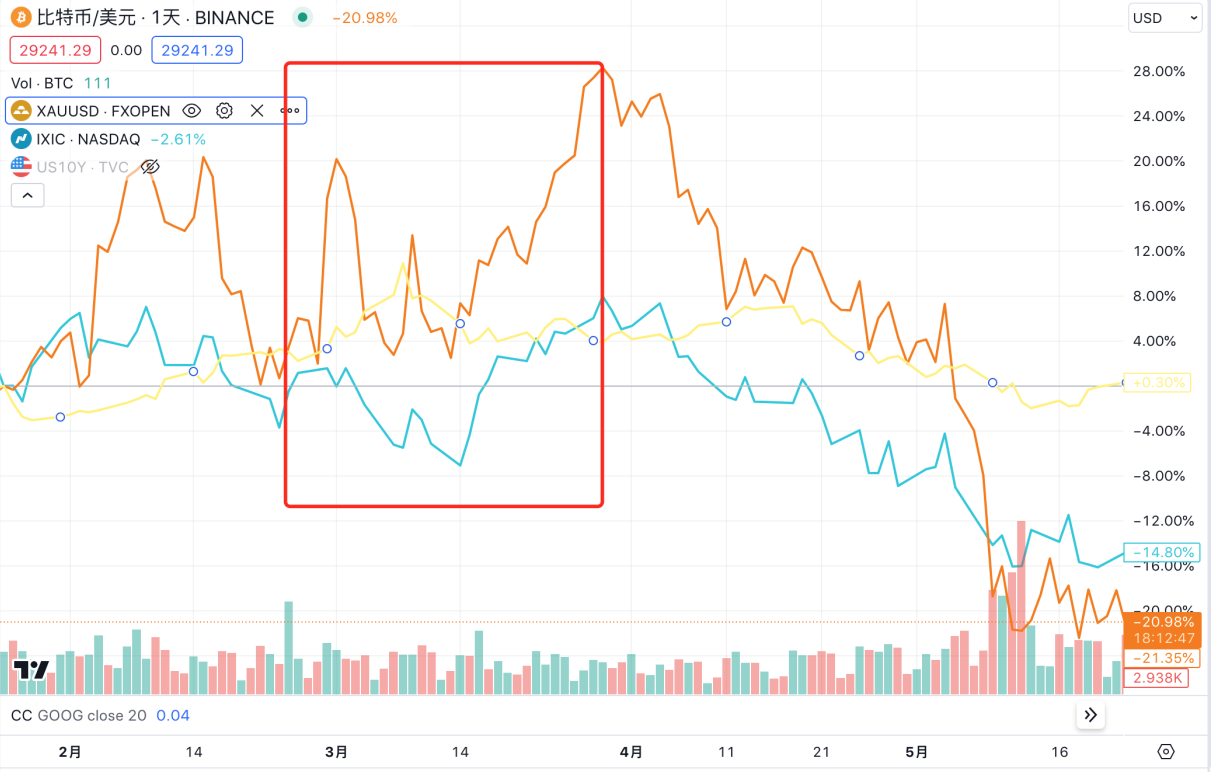
2 月 25 日至 3 月 8 日之间,黄金连续上涨约 8% ,BTC 在战争后的三四天内没有出现明显的波动, 3 月 1 日拉涨 15% ,但很快又回调至上涨之前的位置,截止黄金出现最高点的 3 月 8 日,BTC 报 38733 美元,较冲突发生前的价格上涨 4% ,纳斯达克指数下跌约 1.5% 。
3 月 9 日至 3 月底,随着欧美等国宣布对俄罗斯实施制裁,市场预期事件最坏的结果落地,金价随即自历史高点回落,BTC、纳斯达克指数在短暂波动了几天后从 3 月 14 日开始一起上涨,BTC 与纳指上涨过程中黄金价格原地波动。至 3 月底 BTC 上涨 20% ,黄金涨幅收窄至 2% (对比 2 月 24 日),纳斯达克上涨 6% 。
同时美联储于 2022 年 3 月开启了本轮的加息周期,俄乌战争对资产价格的影响逐渐减弱,交易逻辑转向美联储加息。
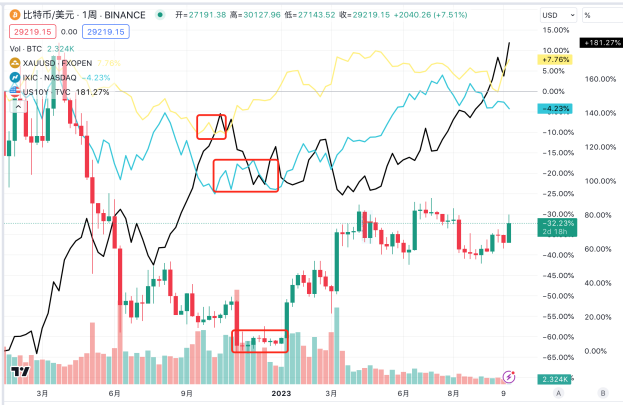
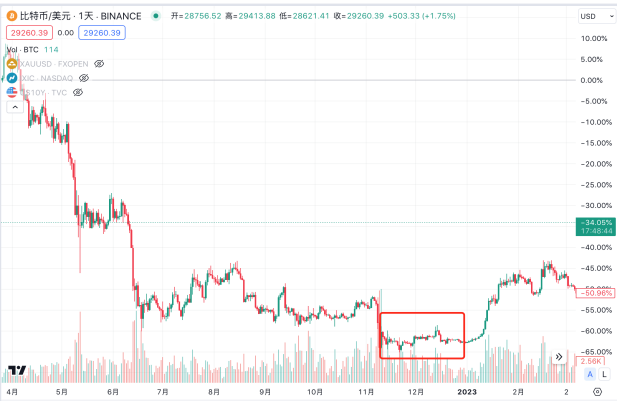
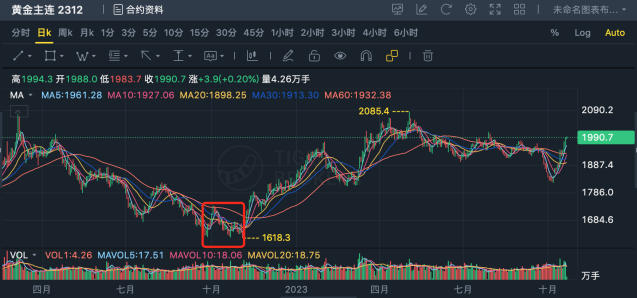
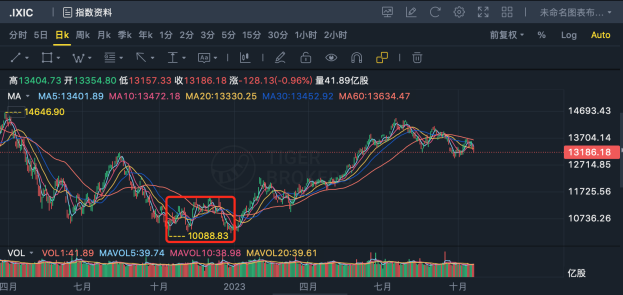
4 月份开始,伴随着加息 BTC 和纳斯达克指数同时开启了较长时间的下行期间,黄金价格在短暂上涨后于 4 月 19 日亦开启长期的下行区间。纳斯达克指数在 2022 年 10 月见底约 10000 点,从加息开始累计跌幅 28% ;黄金在 9、 10 月份见底 1615 美元,从加息开始累计跌幅 16% ;BTC 在 11 月份见底约 16000 美元,从加息开始累计跌幅 66% 。
见底之后黄金最先启动新一轮行情,从 11 月初开始连续上涨,高点出现在 5 月 4 日 2072 美元,较低点上涨 28% 。而 BTC 和纳斯达克指数的行情启动比黄金晚了 2 个月, 2023 年开始 BTC 和纳斯达克指数又再次同步开启上涨行情,BTC 与纳指高点同步出现在 7 月中旬,BTC 最高来到 31500 左右,较低点上涨接近 1 倍,纳指最高来到 14446 ,较低点上涨 44% 。
这一波的上涨主要与 11 月初美债利率阶段性见顶有关, 11 月上旬以来,美债利率下行驱动风险资产价格明显反弹。其主要触发因素是 10 月份 CPI、核心 CPI 数据双双超预期回落,同时 10 Y-2 Y 美债利差的倒挂进一步加深,反映市场对经济与通胀预期已有很大程度下修。美国 CPI 和核心 CPI 的见顶回落驱动了美债 10 年期收益率见顶回落,也导致美联储加息节奏出现放缓。之后由于纳指出现人工智能热潮,黄金和 BTC 也有各自的独立叙事加持,接力各市场进一步上行。
整体上从俄乌冲突后 BTC 价格与黄金的同步程度认为 BTC 没有体现出较强的避险属性。
巴以冲突以来资产价格变化
当地时间 2023 年 10 月 7 日清晨,巴勒斯坦伊斯兰抵抗运动(哈马斯)发起了代号“阿克萨洪水”行动,短时间内向以色列境内发射了 5000 多枚火箭弹,数千名武装分子以立体作战的方式从加沙地区进入以色列境内与以军发生冲突。以色列随后对加沙地带发起多轮空袭,以色列总理内塔尼亚胡宣布以色列进入“战争状态”,称以军将出动全部军事力量摧毁哈马斯。
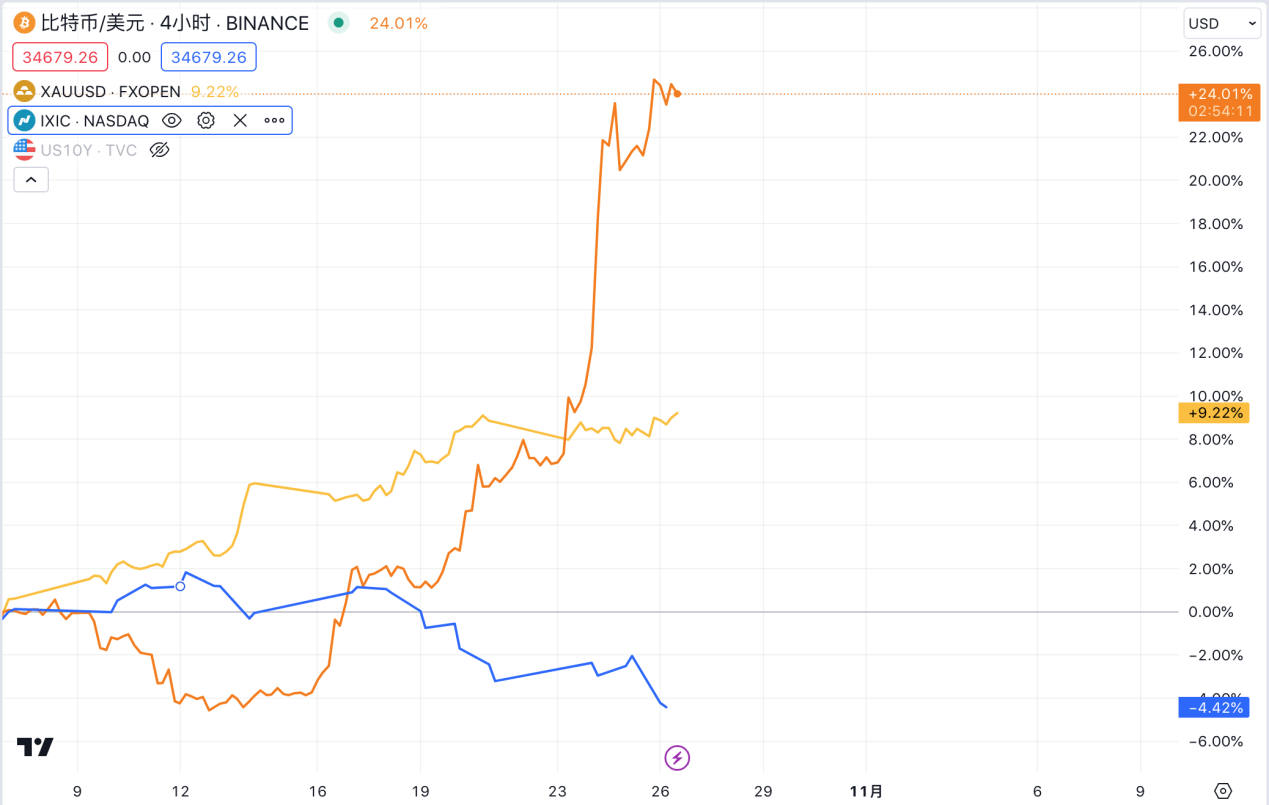
黄金是冲突以来上涨最为明显的资产,从 10 月 9 日的 1832 上涨至 10 月 26 日的近 2000 美元,上涨幅度约 8% ,巧合地与俄乌冲突中地涨幅一致;BTC 10 月 7 日至 13 日,从 28000 下跌至 26770 ,跌幅 4.4% , 13 日开始反弹, 16 日经历贝莱德 BTC ETF 申请通过的乌龙事件,日线经历大幅上涨后回调,收盘仍保留一半涨幅上涨至 28546 ,后 ETF 通过预期持续发酵,截止 25 日上涨至 34183 美元;纳指 10 月 9 日至 11 日小幅上涨, 12 日起开始下跌,从 13672 点下跌至 10 月 20 日的 125956.。
这一波 BTC 和纳指的走势几乎完全相反,走出了独立的行情,首先从战争发生后近一周的时间 BTC 的与黄金相反的价格表现认为 BTC 依旧不体现避险资产的属性,而后的反弹则是因为 SEC 不对灰度比特币信托案提出上诉后市场对 BTC 现货 ETF 通过的信心再次燃起和持续发酵。
三、BTC 是亦否属于避险资产
BTC 从供需、通胀等方面与黄金有较高相似度,从模型设计和逻辑上 BTC 应当具有避险属性。正如 Arthur Hayes 在《For the War》一文中的阐述,战争会导致剧烈的通货膨胀,普通公民保护自己财产的普遍方法就是选择黄金硬通货,但大规模战争如果在本土爆发,政府有可能会禁止私人拥有贵金属,限制贵金属交易,甚至迫使黄金所有者以低价将其金块出售给政府。持有强势货币也会受到严格的资本管制。唯有比特币的价值和传输网络并不依赖于政府特许的银行机构,且没有物理存在,普通人可以把他带到任何地方而不收到管制。面临真正的战争场景时,BTC 实际上是优于黄金和强势货币的最佳资产。
但从资产实际价格的截至目前 BTC 是并未现出明显的避险属性。
补充本轮美元潮汐俄乌冲突之前的资产价格变化以更好地窥探各类资产在一个完整周期中的变动情况。2020 年初开始爆发新冠疫情使得通胀预期急速下跌倒逼美联储大幅降息至 0 – 0.25% ,并在 2020 年 3 月下旬开启无限 QE。资产价格集体上涨,金价的上涨最为迅速,在 2020 年 8 月伦敦金价就创出历史新高 2075 美元/盎司,而后开始回撤;从 2020 年 3 月 30 日的 6631 到 2021 年 11 月 21 日的 16212 点,纳指共上涨 144% ;同时期 BTC 从 6850 美元上涨到 58716 ,共上涨 757% 。
2020 年以来随着传统资金的进入,BTC 价格越来越显现出一部分大类资产的特征,这期间 BTC 涨跌与纳指的走势更为契合,而黄金在这里价格表现的差异认为是体现了其在疫情特殊期间避险资产的功能,疫情恐慌情绪的蔓延和经济严重恶化的担忧是除了实际利率之外助力金价上涨的动因,另一方面新冠疫情也造成黄金了运输的层层障碍促使黄金价格较快上涨。
我们可以发现不论是从本轮美元潮汐的上涨和下行的长周期看,还是从地缘政治的短期冲突看,BTC 都没有表现出明显的避险属性,而是表现初与纳斯达克指数更高的相关性。需要指出的是所谓避险资产的黄金在大周期中的价格表现出非常强的金融属性,亦在较长区间受到利率的影响与纳指保持同方向的价格走势。
四、未来走势展望
10 月份多位联储官员发表偏鸽派言论,如之前较为鹰派的达拉斯联储主席 Logan 称, 美债收益率上行可能降低加息的必要性;联储副主席 Jefferson 称,在判断未来货币政策时会考虑近期债券收益率上行导致金融条件的收紧。10 月 19 日周四美联储主席鲍威尔在纽约经济俱乐部发表的讲话中暗示了只要近期降通胀的努力继续取得进展,长期美债收益率的上涨可能会令央行在下次会议继续暂停加息,但同时美联储将继续致力于将通胀可持续地降至 2% ,不排除未来再次加息的可能性,鲍威尔讲话之后,CME 利率期货隐含的 11 月不加息概率已上升至 99.9% ,但 10 年美债利率上周再度上冲并于盘中一度突破 5.0% ,短期内加息预期已经不再是美债收益率交易者博弈的点,发言当天利率的上涨一方面可能是将鲍威尔偏谨慎的发言解读为鹰派论调,另一方面也是对美国财政可能继续扩张和发债增加的担忧。
总体看来猜测基于当前的经济数据十年期美债收益率 5% 的水平是联储认为的顶部位置,短期美债收益率还将在高位持续运行,长期根据点阵图及市场预测明年美联储大概率将开始降息,届时美联储货币政策主轴的转变将会在 2024 年改变全球大类资产配置的最重要的底层逻辑,总体上黄金和 BTC 的配置窗口已近,更多是择时的问题。
1、黄金
美债实际收益率依然是黄金价格的主要驱动因素,明年周期反转后黄金与 10 年期美债实际收益率的负相关关系会重振,美债实际收益率再次成为金价的主要和持续的价格驱动因素;其次国际货币体系多极化大势所趋,“逆全球化”的推动以及非美货币的崛起将在长周期打击美元信用,支撑央行的持续购金动作。因此长期看来黄金有望在周期反转和结构性变革力量的双重影响下迎来上行周期,突破此前的历史高点。
短期金价仍将保持波动,地缘政治依旧是主要影响因素,价格走势要取决于巴以冲突是否扩大到中东其他地区。笔者认为若冲突局限在巴以双方,黄金的长势大概率就此偃旗息鼓,突破 2000 美元/盎司的心理压力位较为困难;若巴以冲突蔓延到周边如伊朗、沙特等产油国甚至在极端情况下引发石油禁运或产量骤降,则可能对原油供应链产生较大影响,促使原油和黄金的进一步上涨,同时能源价格上涨和传导至其他商品价格促使 CPI 增速反弹,使宏观环境产生更多变数。基于目前情况看来第一种的情况的概率可能更高。
2、BTC
同样的伴随着 2024 年美联储开启下一轮周期,市场整体流动性改善,全球投资者的风险偏好提高,叠加独有的自身市场逻辑,受 ETF 和减半行情的影响,比特币将再现牛市,亦有望突破前高。短期内的驱动因素依旧是 SEC 批准 BTC ETF 现货,BTC 价格近期已大幅上涨至 34000 美元以上。关于现货 ETF 对 BTC 价格的具体影响和通过后 BTC 价格预测我们将在未来的研报作深入探讨,敬请关注。
本文仅为作者个人观点,不对任何人构成投资建议。


