Original source:Binance Reseach
Original compilation: PANews
Original source:
Original compilation: PANews
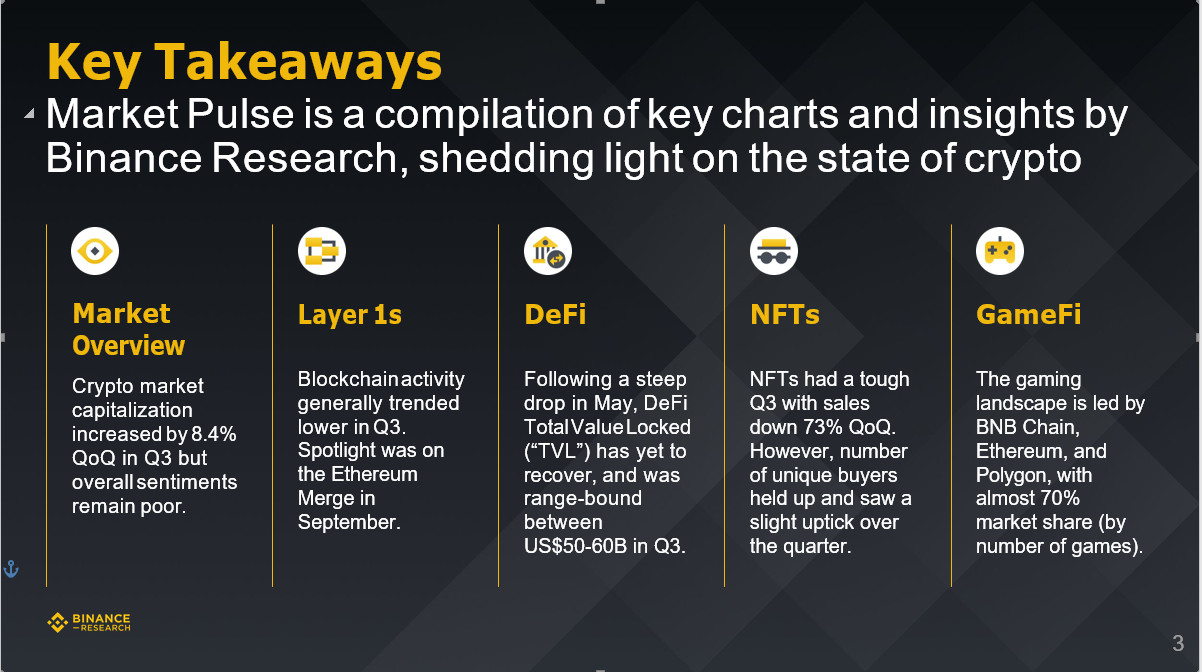
MarketPlus is a research report on the state of the encryption market launched by Binance Research. In the third quarter, the report involved several key vertical fields including the overview of the encryption market, DeFi, NFT, and GameFi. The key data are as follows.
Encrypted market overview: In the third quarter, the market value of encrypted currencies increased by 8.4% month-on-month, but the overall market sentiment is still not good.
Layer 1: Blockchain activity generally declined in the third quarter, but the Ethereum merger in September has aroused widespread concern in the market.
DeFi: Following a sharp drop in May, DeFi Total Value Locked (“TVL”) has yet to recover, largely hovering in the $50-60 billion range in Q3.
Binance Research Institute: Review the market status of the five key tracks in the third quarter
first level title
1. Encryption market overview
According to data from Coinmarketcap and Binance Research as of September 30, 2022, the market value of cryptocurrencies increased slightly in the third quarter, with a quarter-on-quarter increase of 8.4%.
Binance Research Institute: Review the market status of the five key tracks in the third quarter
image description
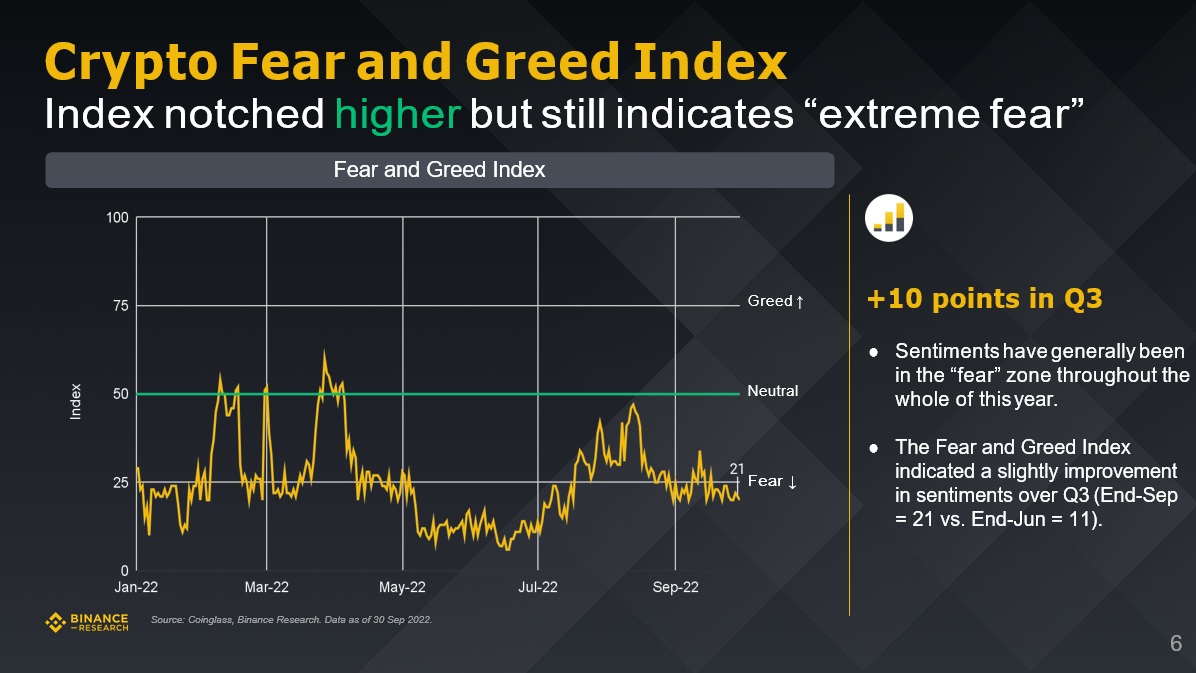
Crypto Fear and Greed Index
The Crypto Fear and Greed Index edged higher and remains in a state of "extreme fear." Crypto Fear and Greed rose 10 points in Q3.
Binance Research Institute: Review the market status of the five key tracks in the third quarter
image description
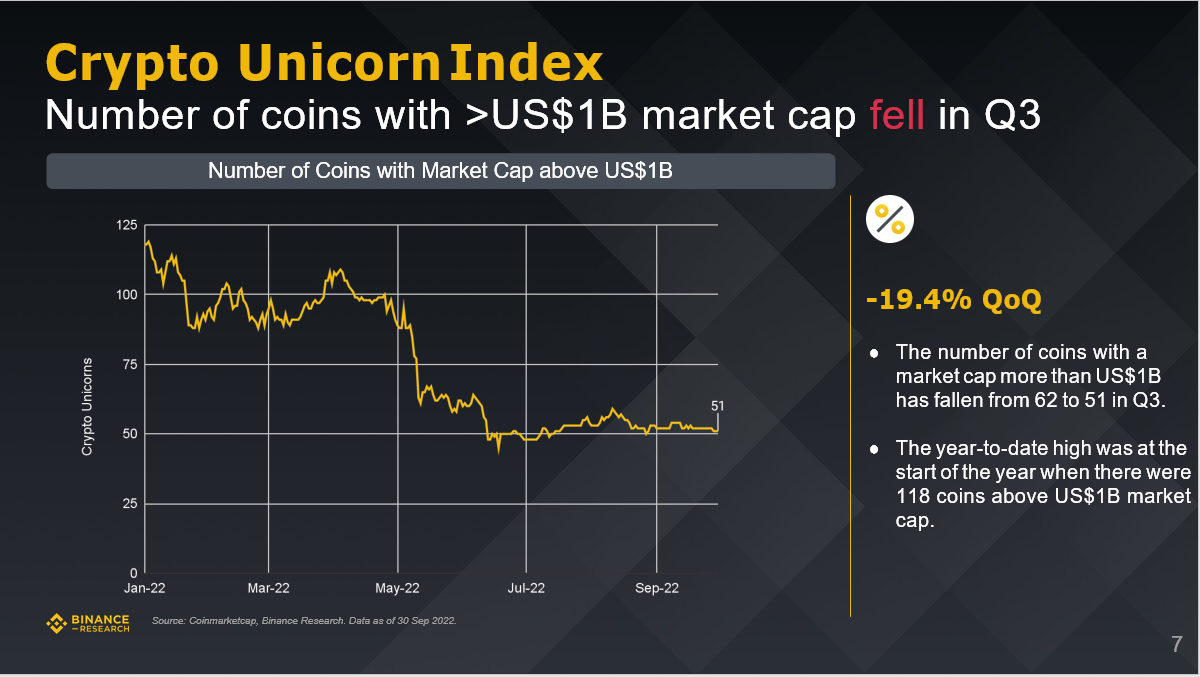
Crypto Unicorn Index
In the third quarter, the number of cryptocurrencies with a market value of more than $1 billion decreased, down 19.4% from the previous quarter.
Binance Research Institute: Review the market status of the five key tracks in the third quarter
image description
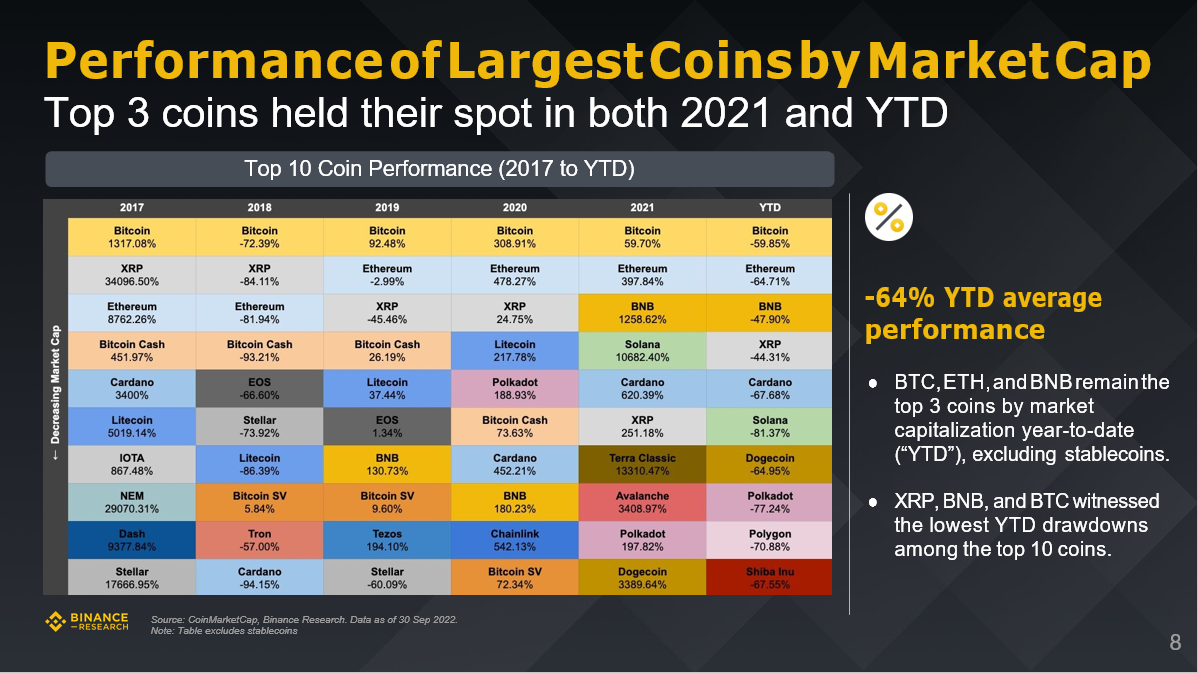
Cryptocurrency performance with the highest market capitalization
For the whole of 2021 and so far in 2022, the top three currencies by market capitalization have not changed, namely: Bitcoin, Ethereum and BNB.
Binance Research Institute: Review the market status of the five key tracks in the third quarter
image description
cryptocurrency market share
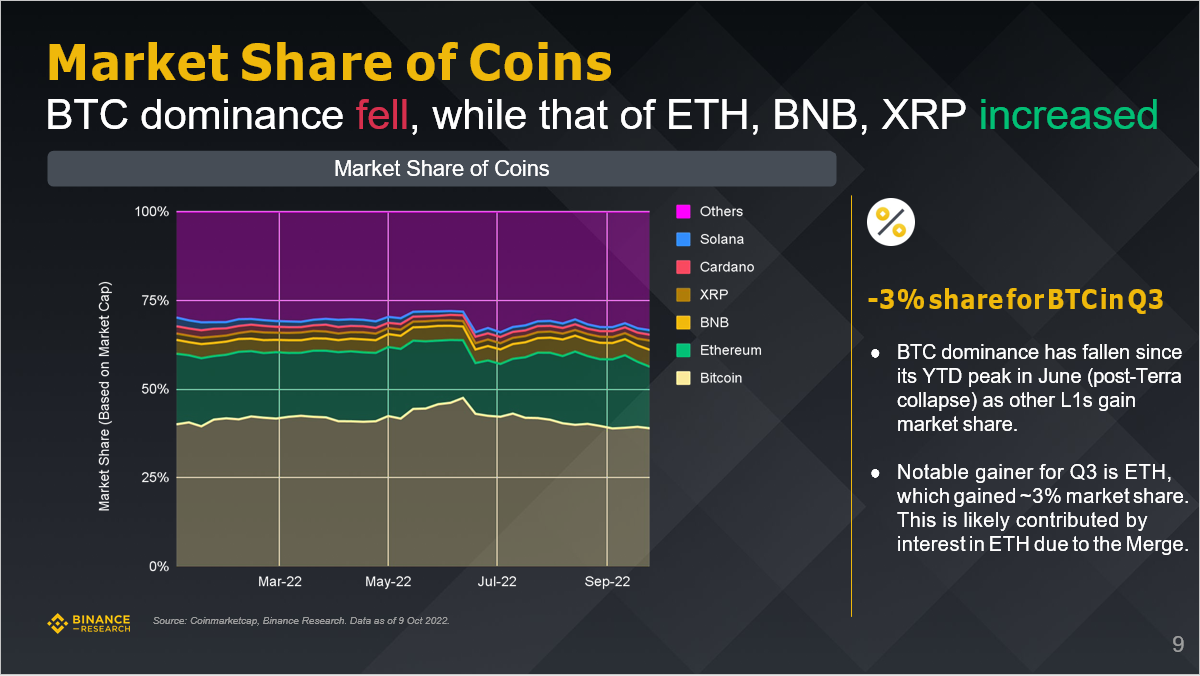
Bitcoin’s market dominance fell while Ethereum, BNB, and XRP gained market share.
Bitcoin’s market share fell by 3% in the third quarter.
BTC’s market dominance has declined since its year-to-date peak in June (since the Terra crash) as other Layer 1 market shares have increased.
The market share that showed a significant increase in the third quarter was ETH, which increased its market share by about 3%, which may be due to the increased investor interest in ETH due to the merger.
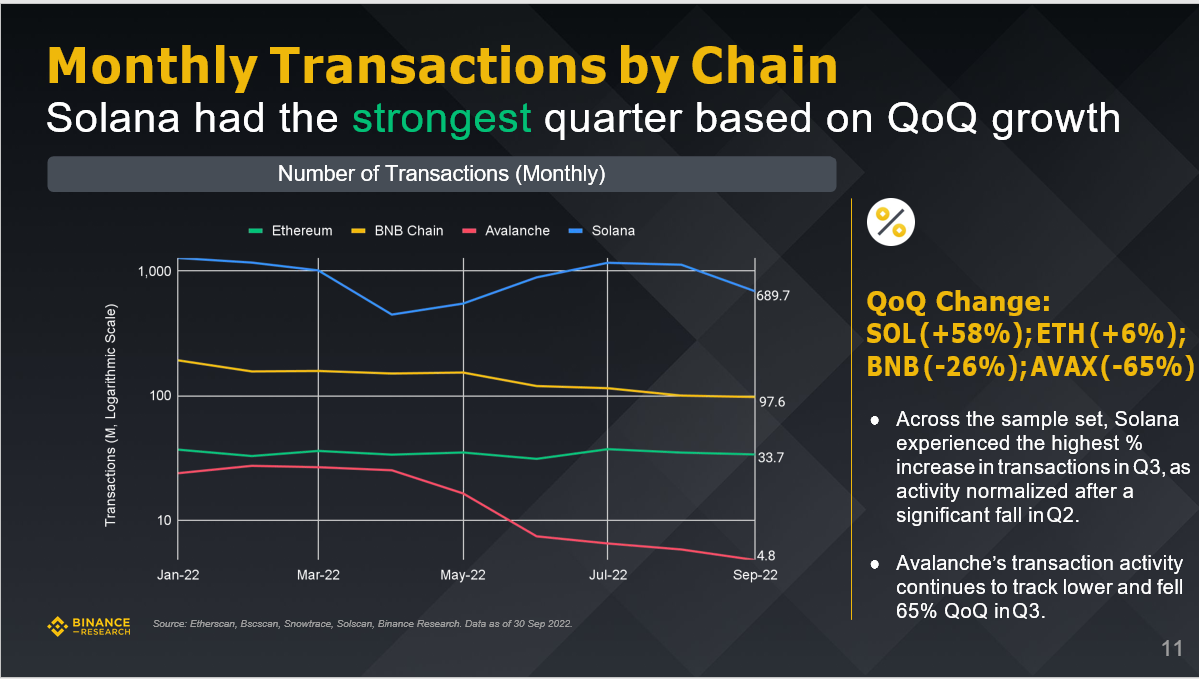
According to data from Etherscan, Bscscan, Snowtrace, Solscan, and Binance Research as of September 30, 2022, Solana had the strongest quarterly performance in terms of blockchain monthly transaction volume.
Binance Research Institute: Review the market status of the five key tracks in the third quarter
Quarter-to-quarter changes: SOL (+58%), Ethereum (+6%), BNB (-26%), AVAX (-65%).
Transaction activity on the Avalanche chain continued to decline, falling 65% quarter-on-quarter in the third quarter.
Binance Research Institute: Review the market status of the five key tracks in the third quarter
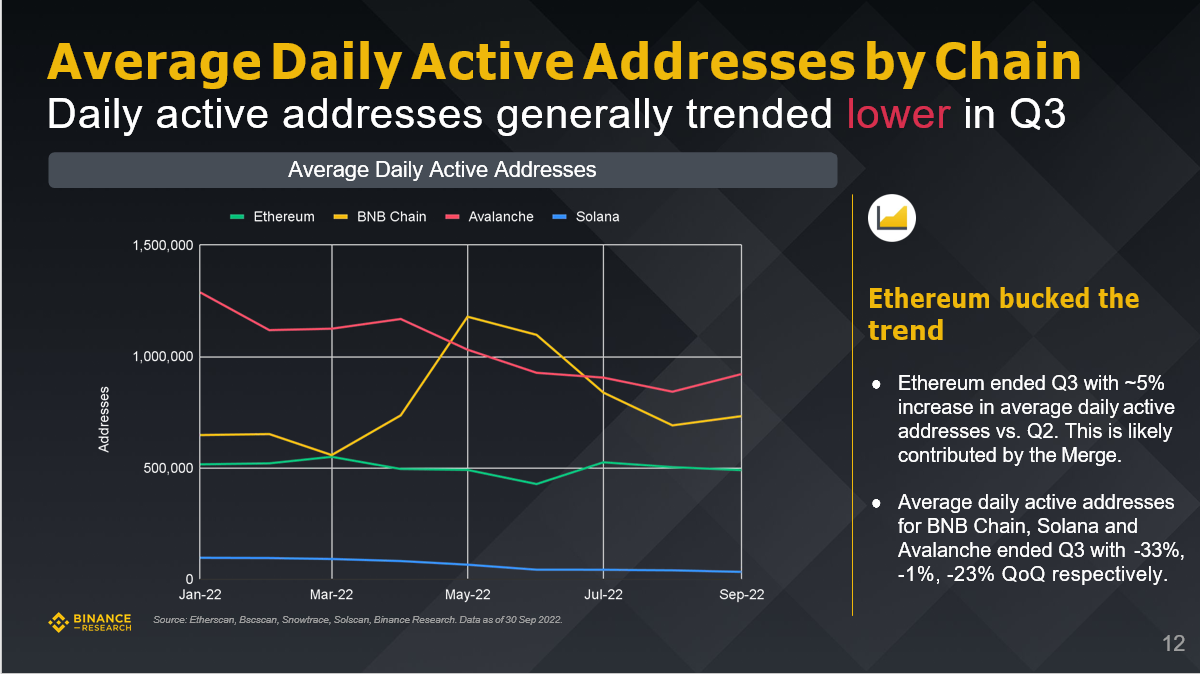
The average daily active address data of the blockchain generally showed a downward trend in the third quarter, but Ethereum bucked the trend.
Binance Research Institute: Review the market status of the five key tracks in the third quarter
image description
twitter follower
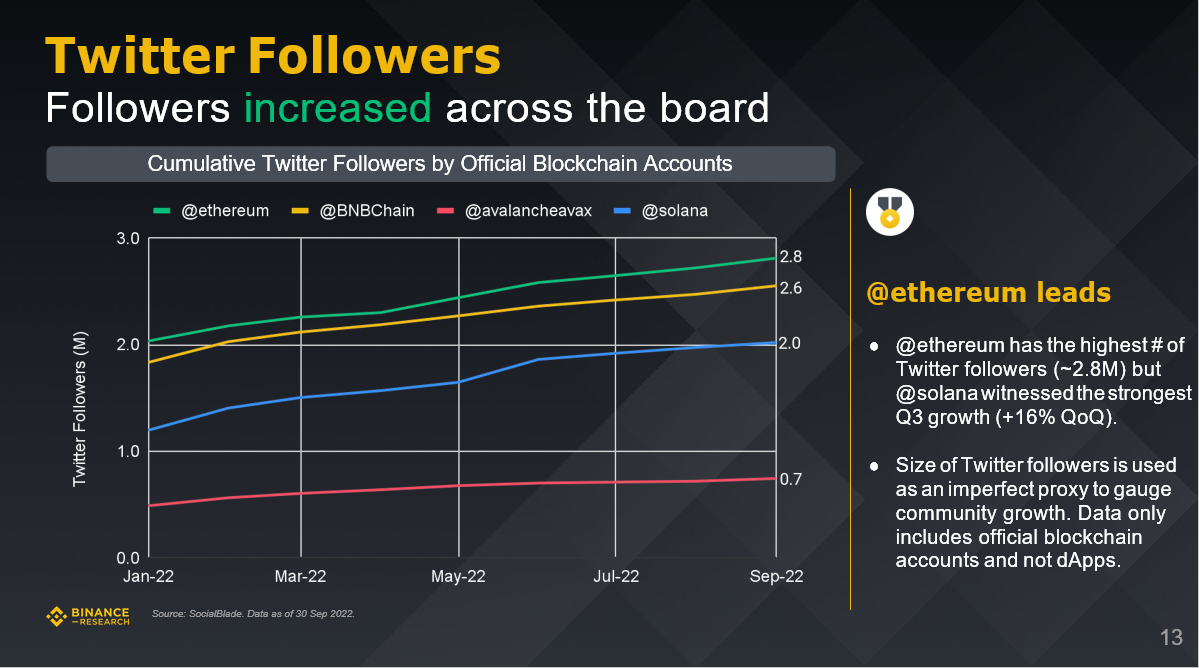
According to SocialBlade data as of September 30, 2022, the number of Twitter fans following the cryptocurrency industry has grown across the board in the third quarter, with the number of fans of the @ethereum account growing the most.
The indicator of the number of Twitter fans is used to measure the growth trend of the community (note: the data only includes official blockchain accounts, excluding dApps).
Binance Research Institute: Review the market status of the five key tracks in the third quarter
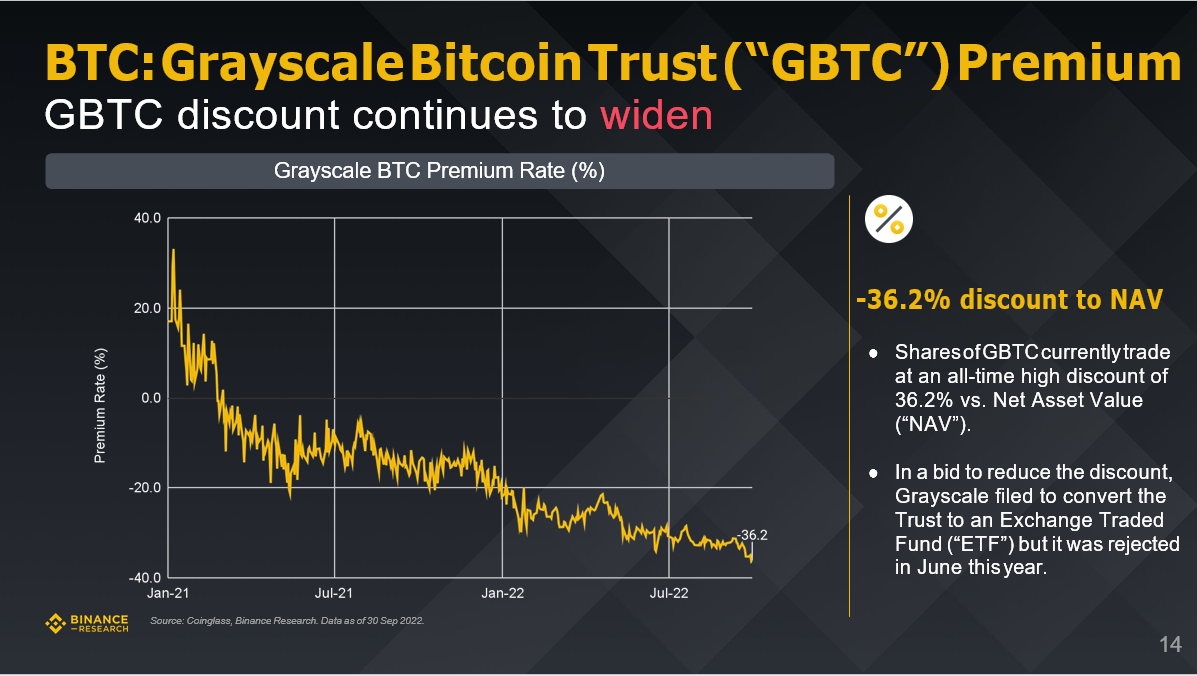
The grayscale Bitcoin Trust (“GBTC”) premium, the GBTC discount range continued to expand, and the net asset value fell by 36.2%.
Binance Research Institute: Review the market status of the five key tracks in the third quarter
image description
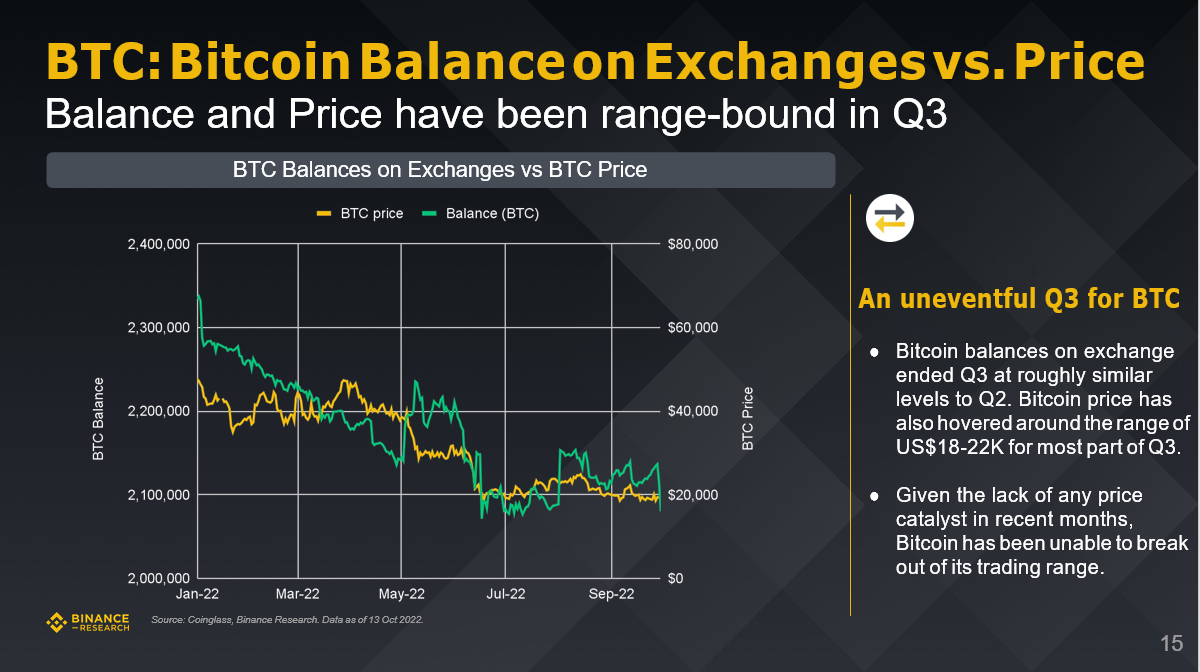
Exchange Bitcoin Balances and Prices
The balance and price of Bitcoin on exchanges fluctuated in a range in the third quarter.
Binance Research Institute: Review the market status of the five key tracks in the third quarter
image description
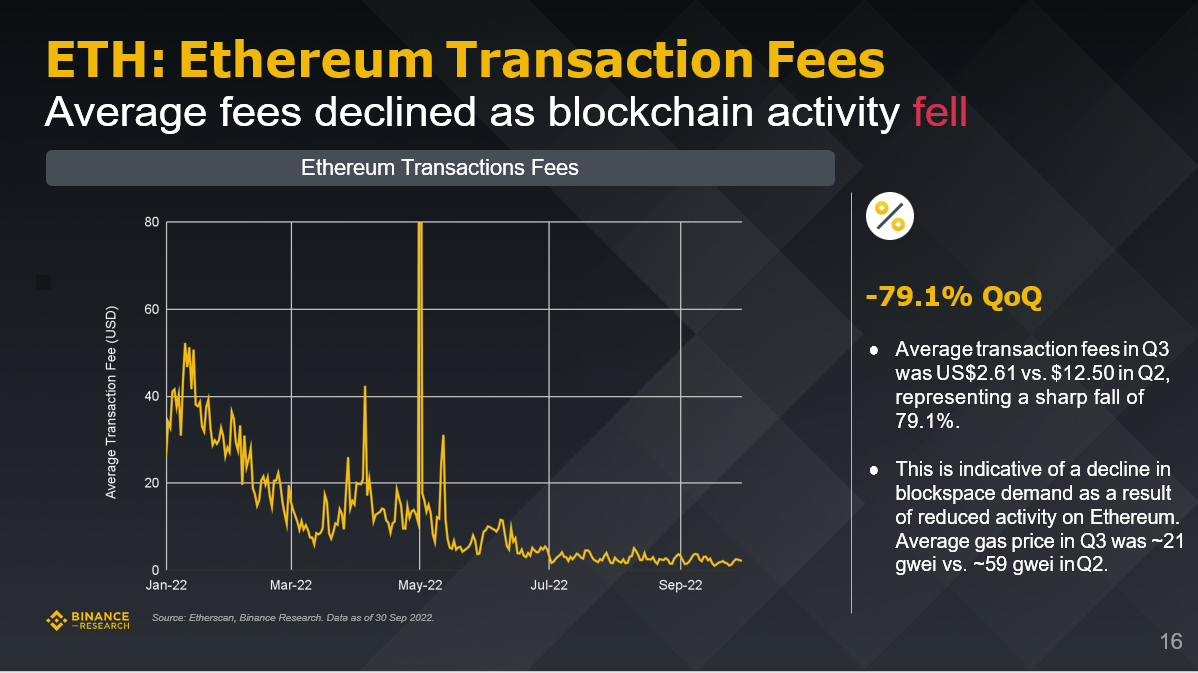
Ethereum transaction fees
According to data from Etherscan and Binance Research as of September 30, 2022, as the activity on the Ethereum chain decreased, the average transaction fee decreased by 79.1% quarter-on-quarter.
Binance Research Institute: Review the market status of the five key tracks in the third quarter
image description
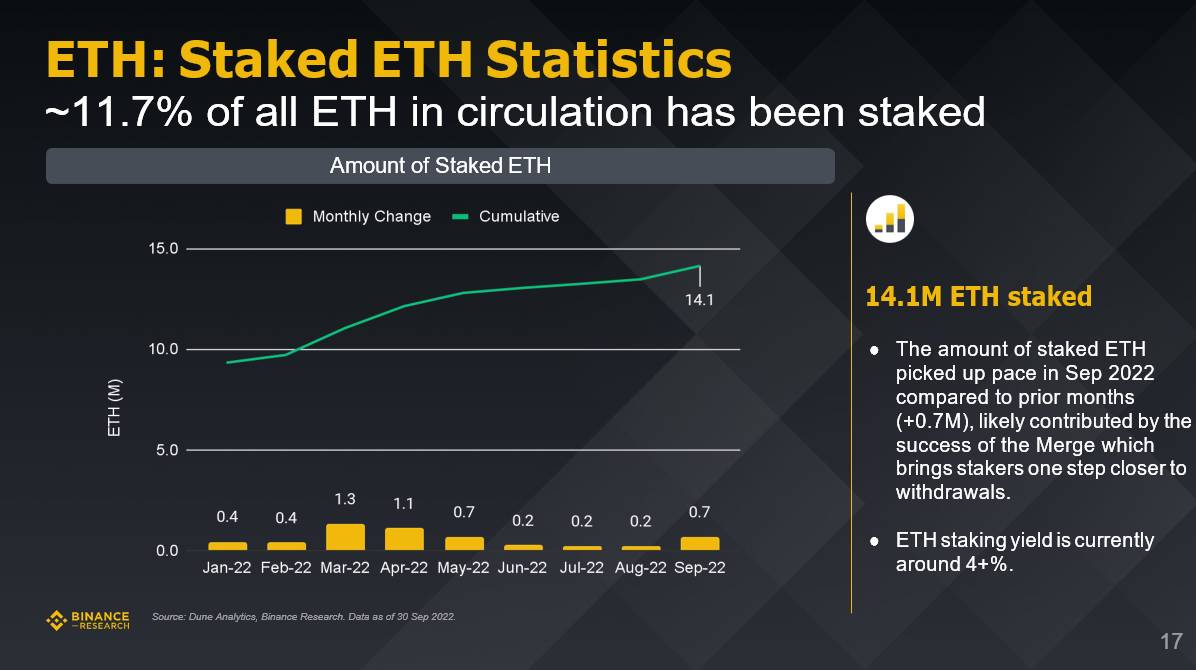
Staking data on the Ethereum chain
According to data from Dune Analytics and Binance Research as of September 30, 2022, about 11.7% of the circulating ETH is currently pledged, with a total of about 14.1 million.
Binance Research Institute: Review the market status of the five key tracks in the third quarter
image description
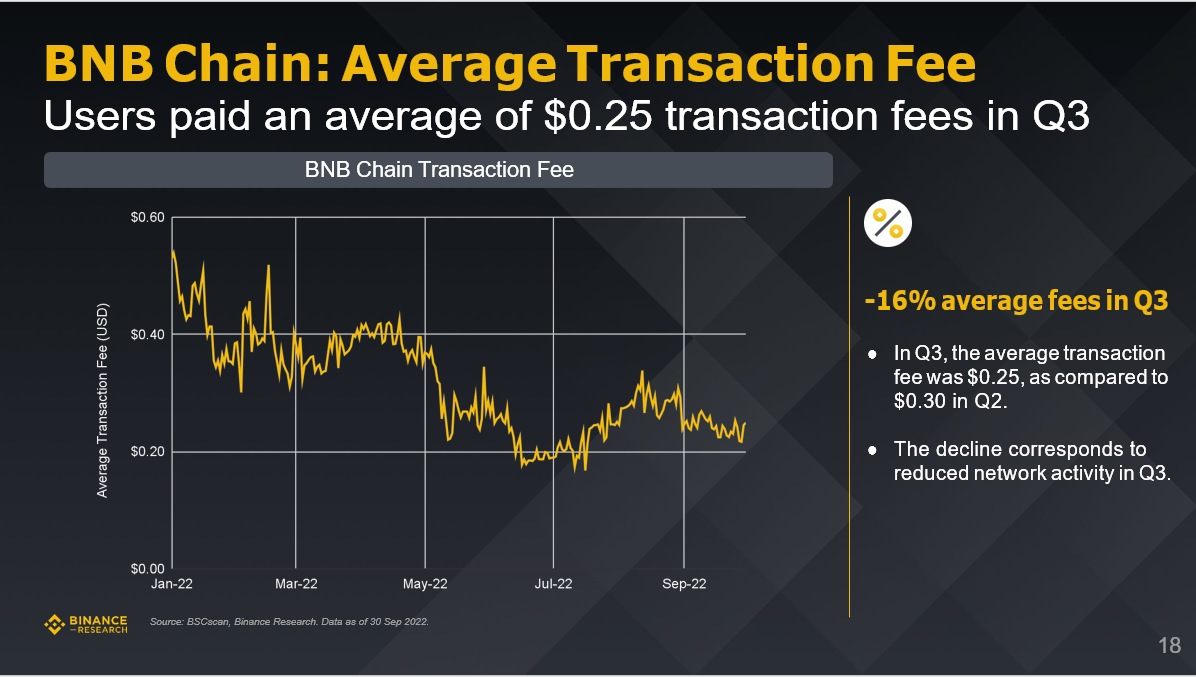
BNB chain average transaction fee
According to data from BSCscan and Binance Research as of September 30, 2022, the average transaction fee on the BNB chain in the third quarter was approximately $0.25, a decrease of 16%.
Binance Research Institute: Review the market status of the five key tracks in the third quarter
image description
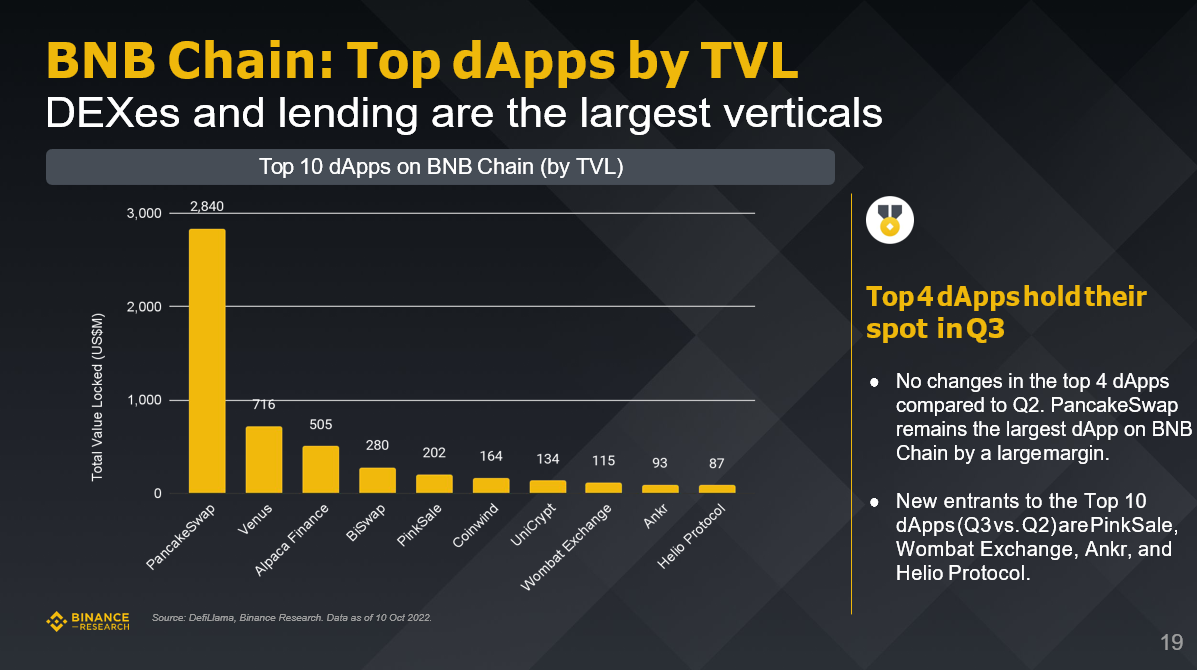
The lock-up amount of the head dApp on the BNB chain
According to data from DefiLlama and Binance Research as of October 10, 2022, DEX and lending applications on the BNB chain are still the largest top dApps.

Binance Research Institute: Review the market status of the five key tracks in the third quarter
first level title
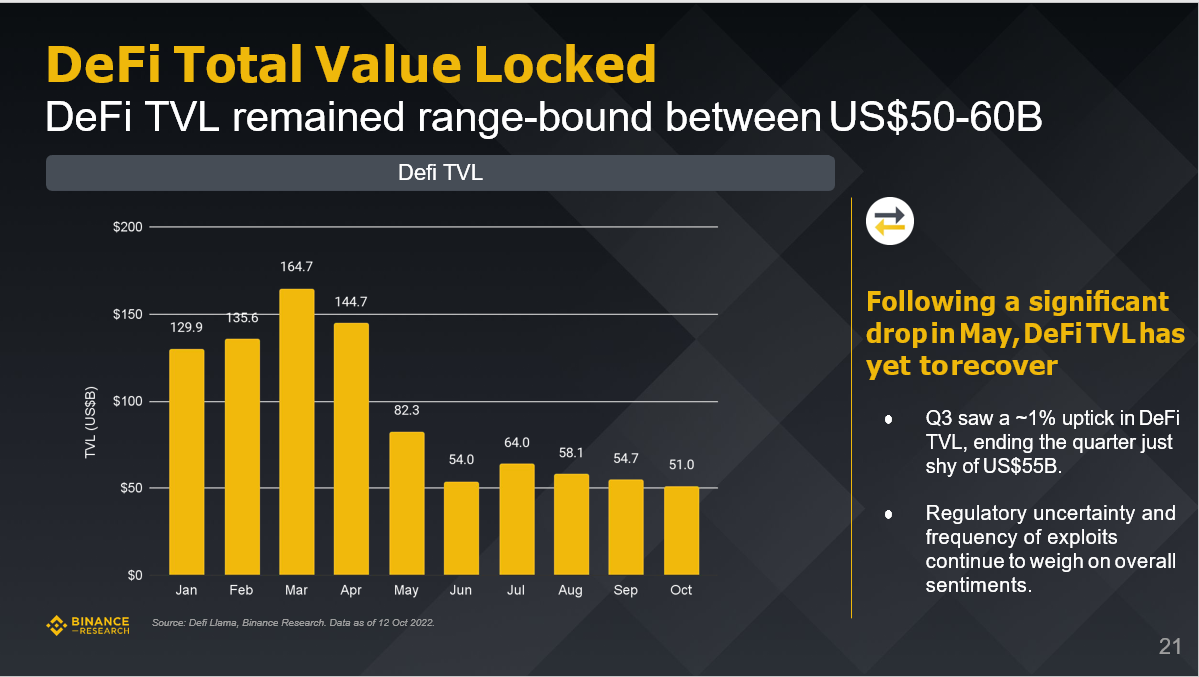
According to data from Defillama and Binance Research as of October 12, 2022, the DeFi market has yet to recover after a sharp drop in May, and the total locked positions of DeFi in the third quarter remained in the range of US$50-60 billion.
Binance Research Institute: Review the market status of the five key tracks in the third quarter
Binance Research Institute: Review the market status of the five key tracks in the third quarter
image description
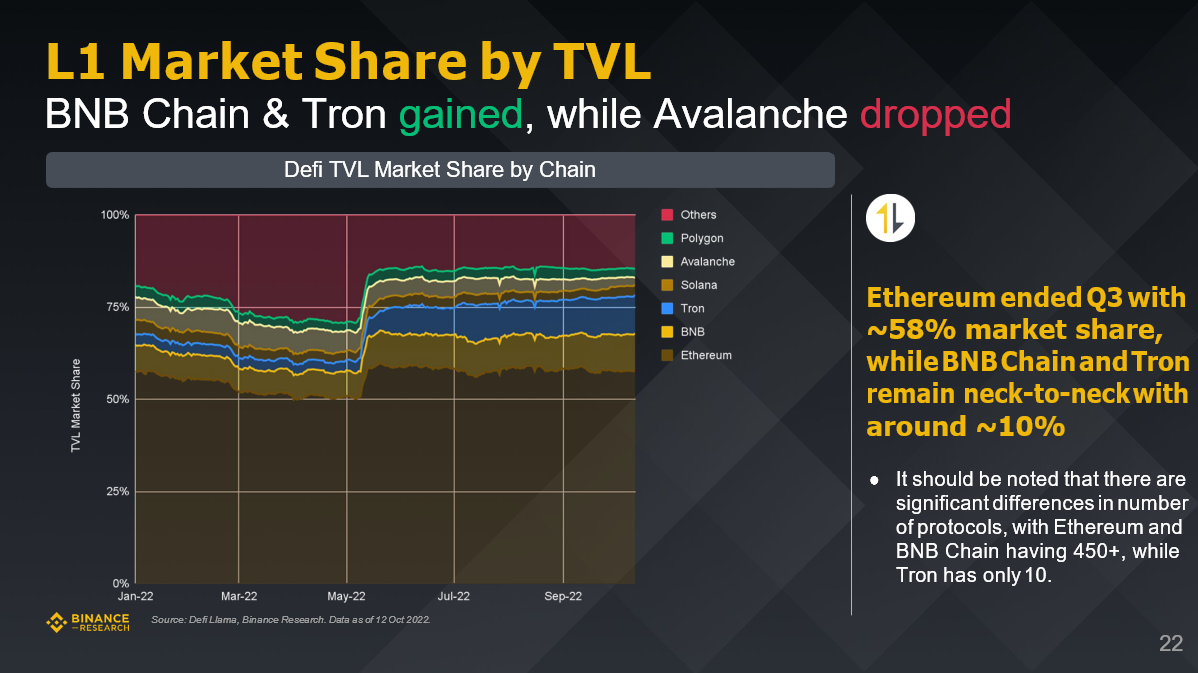
Divide Layer 1 market share by locked amount
The market share of BNB Chain and Tron grew, but Avalanche fell.
Binance Research Institute: Review the market status of the five key tracks in the third quarter
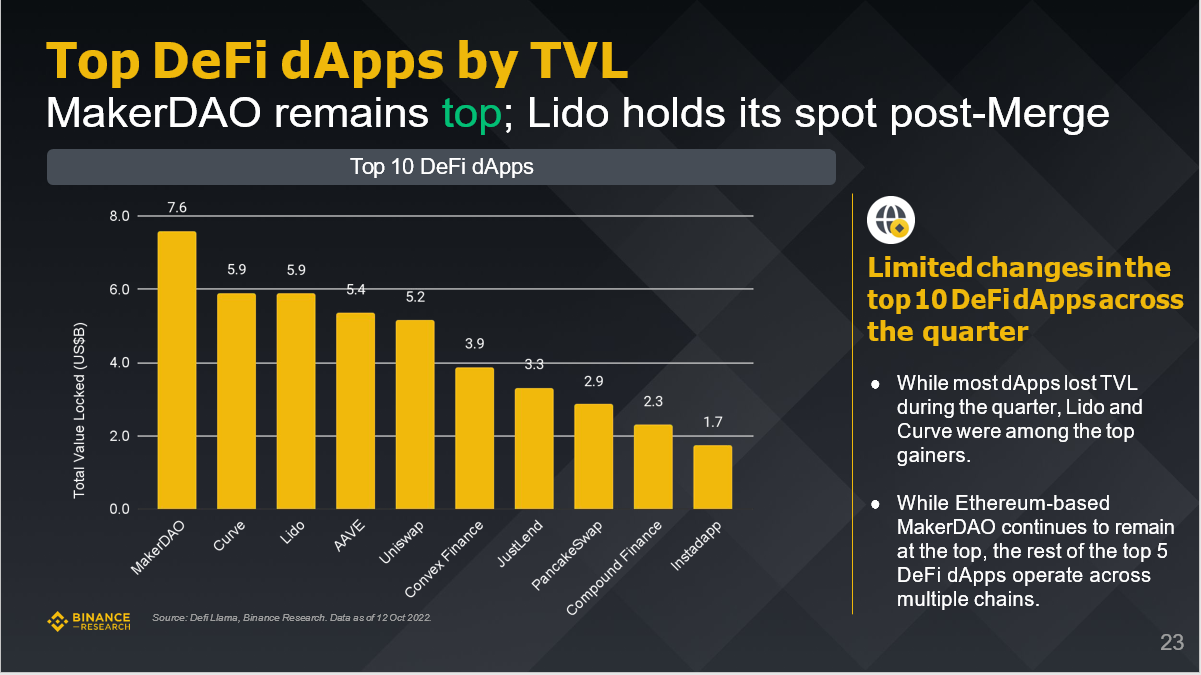
image description
Distinguish top DeFidApps by lockup amount
The top ten DeFidApps did not change much in the third quarter, MakerDAO maintained its lead, and Lido performed well after the merger of Ethereum.
Binance Research Institute: Review the market status of the five key tracks in the third quarter
image description
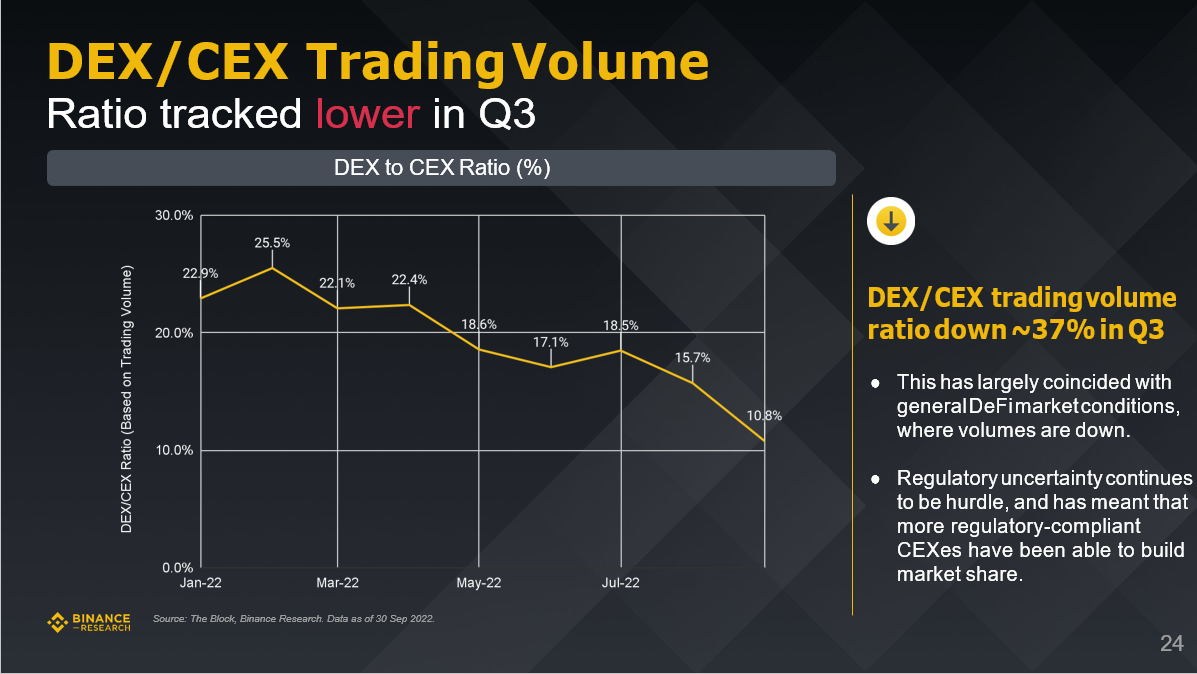
DEX/CEX trading volume
According to data from TheBlock and Binance Research as of September 30, 2022, the trading volume of DEX/CEX in the third quarter decreased by about 37% month-on-month.
Binance Research Institute: Review the market status of the five key tracks in the third quarter
image description
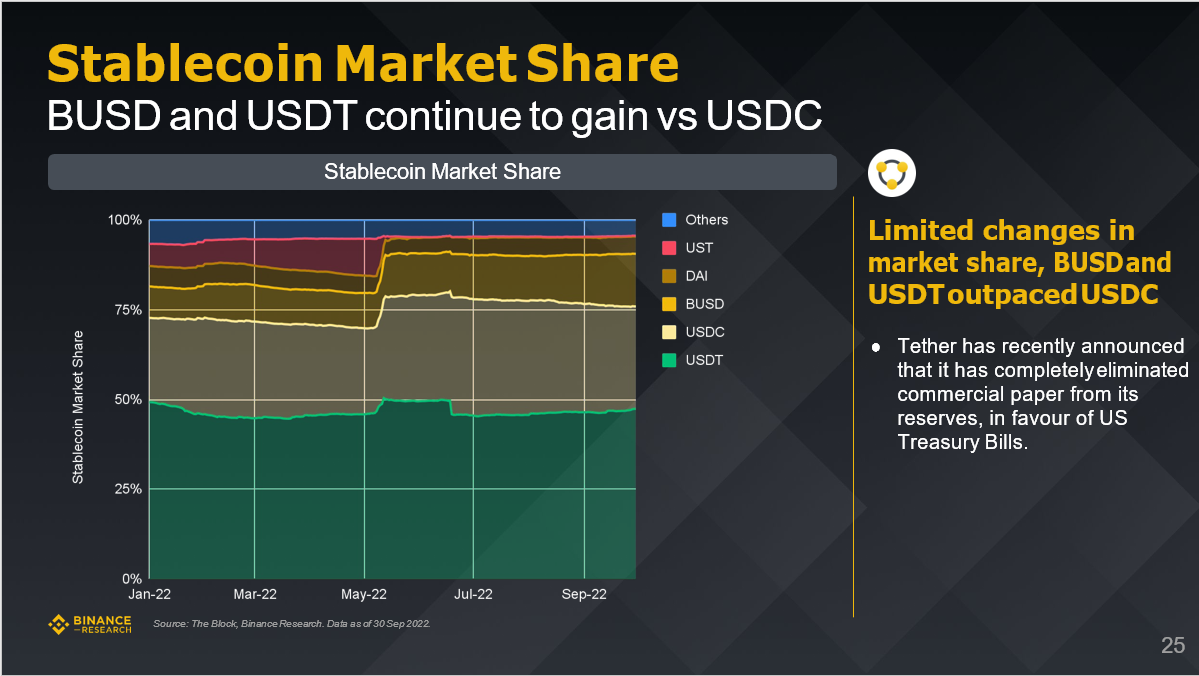
Stablecoin Market Share
The market share of BUSD and USDT increased, while USDC decreased.
Binance Research Institute: Review the market status of the five key tracks in the third quarter
image description
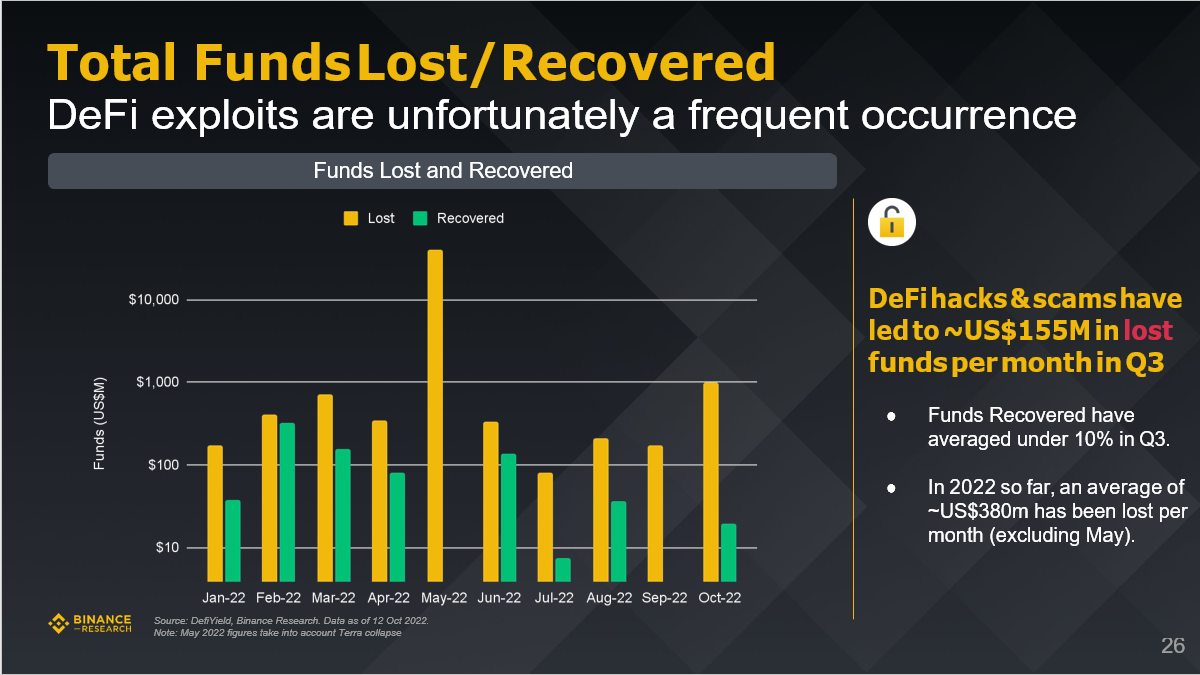
Total funds lost/recovered
According to data from DefiYield and Binance Research as of October 12, 2022, DeFi vulnerabilities occurred frequently in the third quarter, and DeFi hacks and scams resulted in a monthly loss of $155 million in funds in the third quarter.
Binance Research Institute: Review the market status of the five key tracks in the third quarter
image description
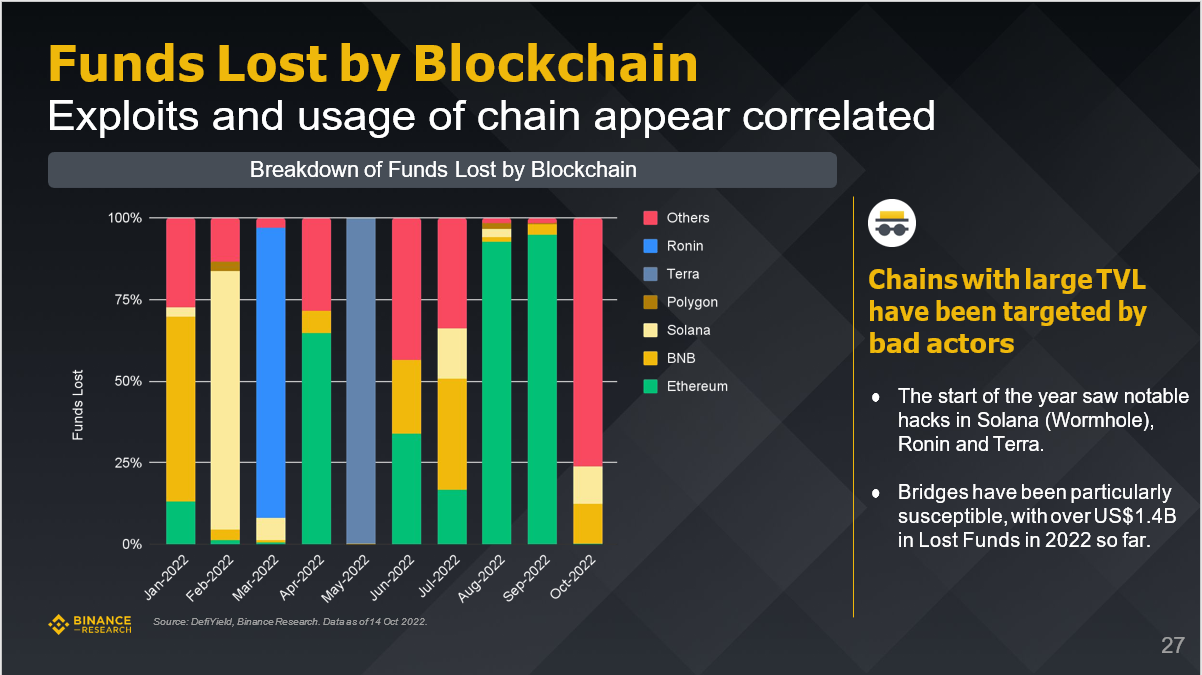
Funds lost on the blockchain
The Solana (Wormhole), Ronin, and Terra blockchains have all seen massive hacks this year.
first level title
4. NFT
image description
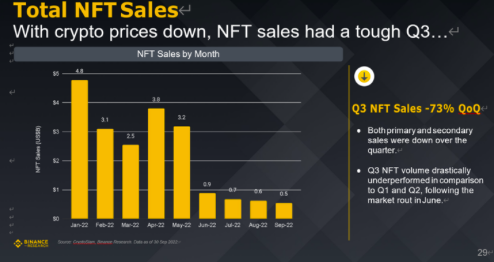
Total NFT sales
According to data from CryptoSlam and BinanceResearch as of September 30, 2022, with the decline in cryptocurrency prices, NFT sales in the third quarter suffered from Waterloo, down 73% from the previous quarter.
Binance Research Institute: Review the market status of the five key tracks in the third quarter
image description
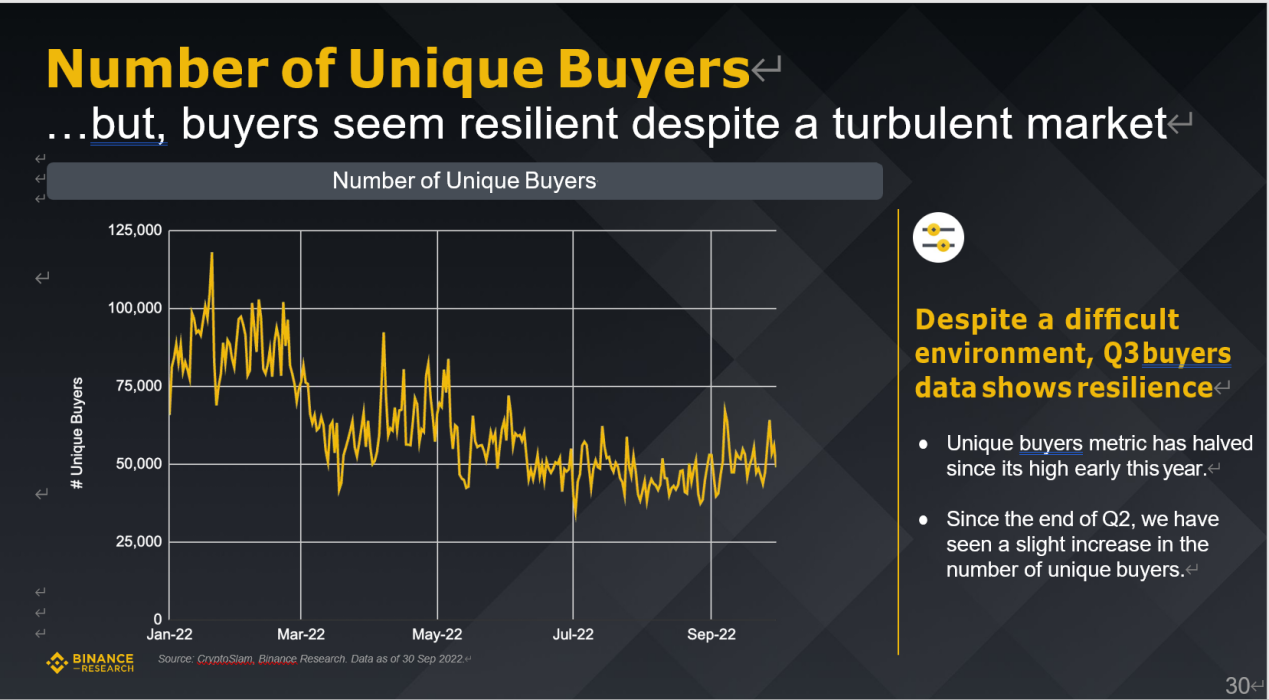
Number of Unique Buyers
According to the data from CryptoSlam and Binance Research as of September 30, 2022, despite market turbulence and a harsh environment, the number of buyers seems to have rebounded, and the number of buyers in the third quarter has rebounded to a certain extent.
Binance Research Institute: Review the market status of the five key tracks in the third quarter
image description
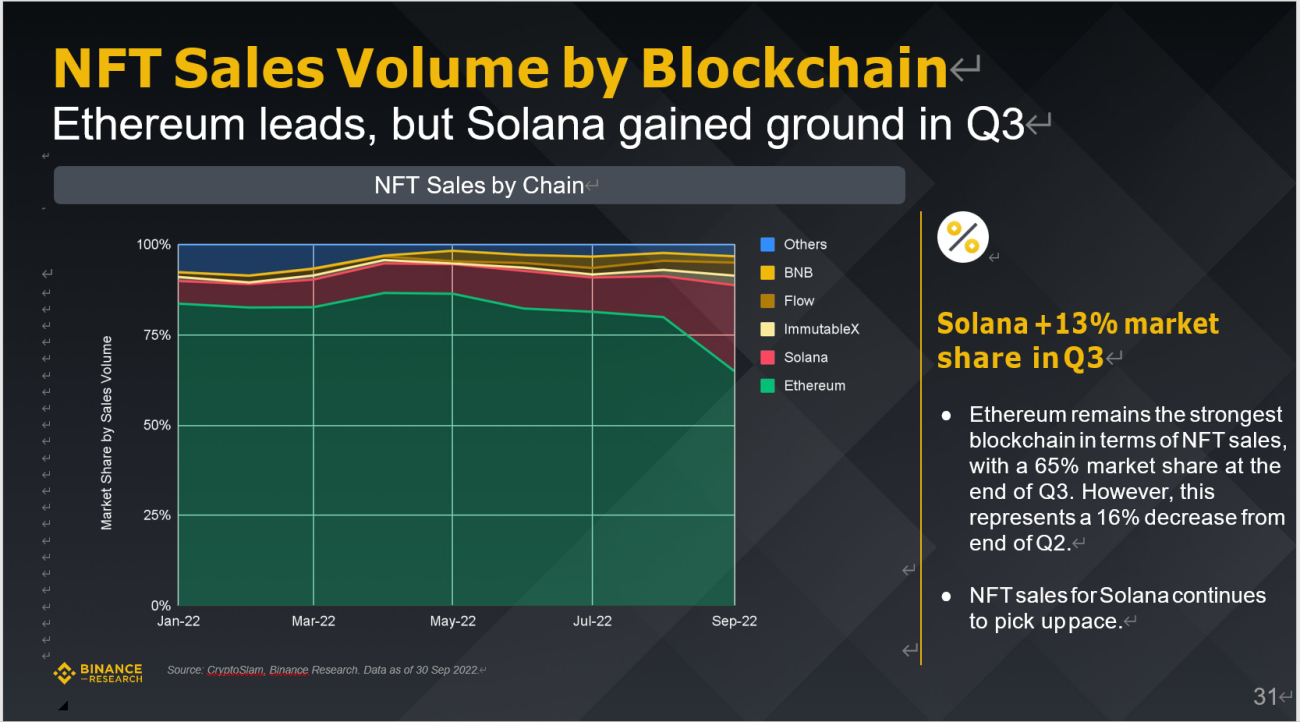
NFT Sales on Major Blockchains
According to data from CryptoSlam and Binance Research as of September 30, 2022, Ethereum is still in the leading position, but Solana has the fastest growth in the third quarter, increasing its market share by 13%.
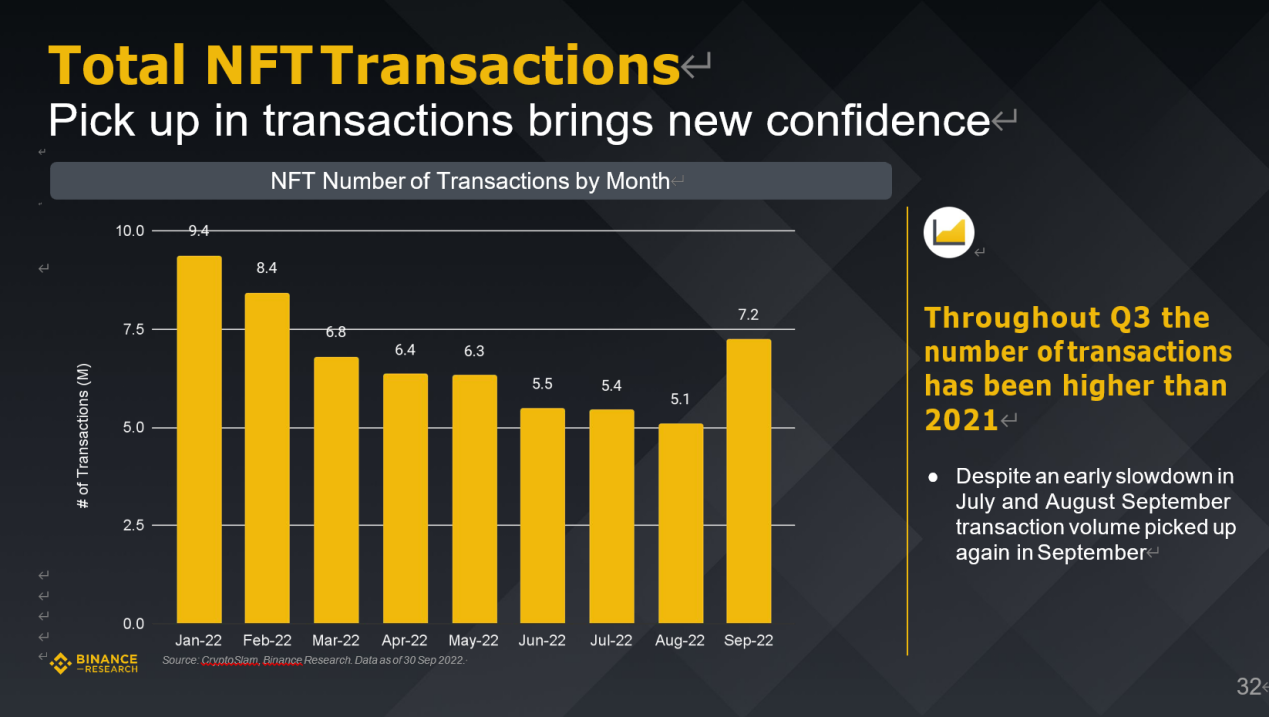
Binance Research Institute: Review the market status of the five key tracks in the third quarter
image description
Binance Research Institute: Review the market status of the five key tracks in the third quarter
image description
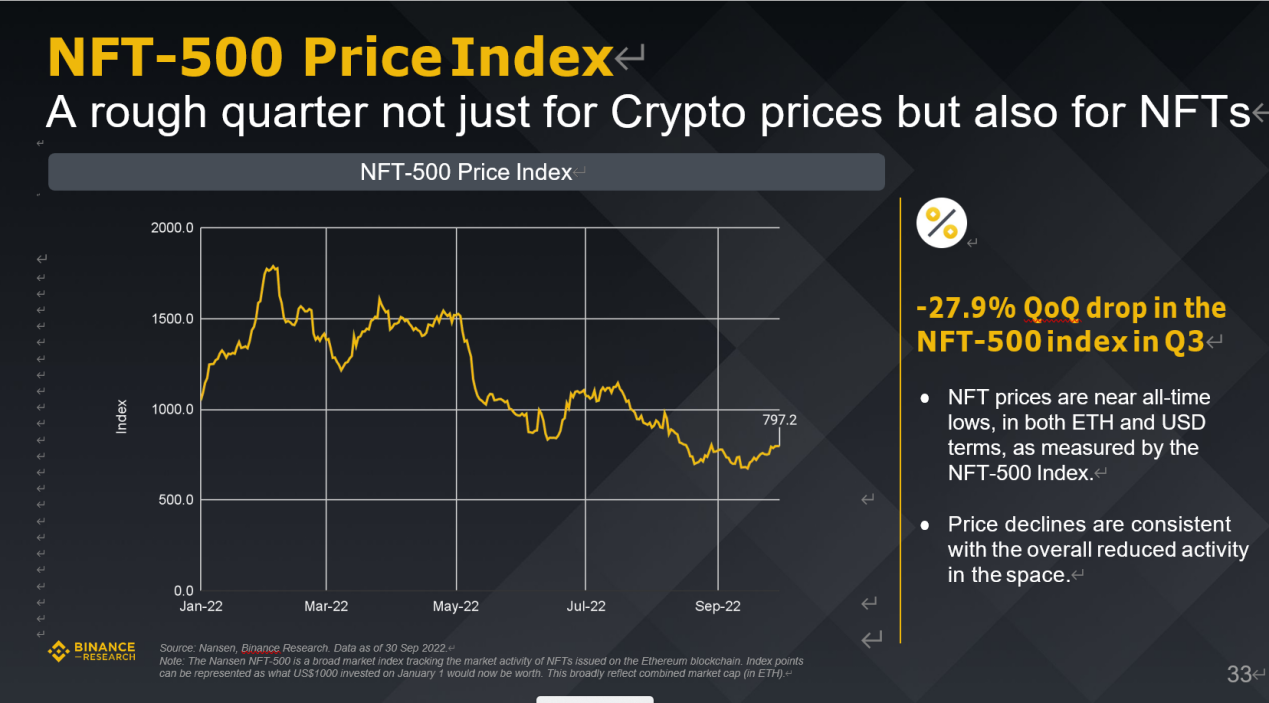
NFT-500 Price Index
According to data from Nansen and Binance Research as of September 30, 2022, the third quarter was very difficult for the entire encryption market. Not only cryptocurrencies, but NFT prices are also very unstable. The NFT-500 index fell by 27.9% month-on-month. (Note: Nansen NFT-500 is an NFT market index to track NFT market activities on the Ethereum blockchain.)
Binance Research Institute: Review the market status of the five key tracks in the third quarter
image description
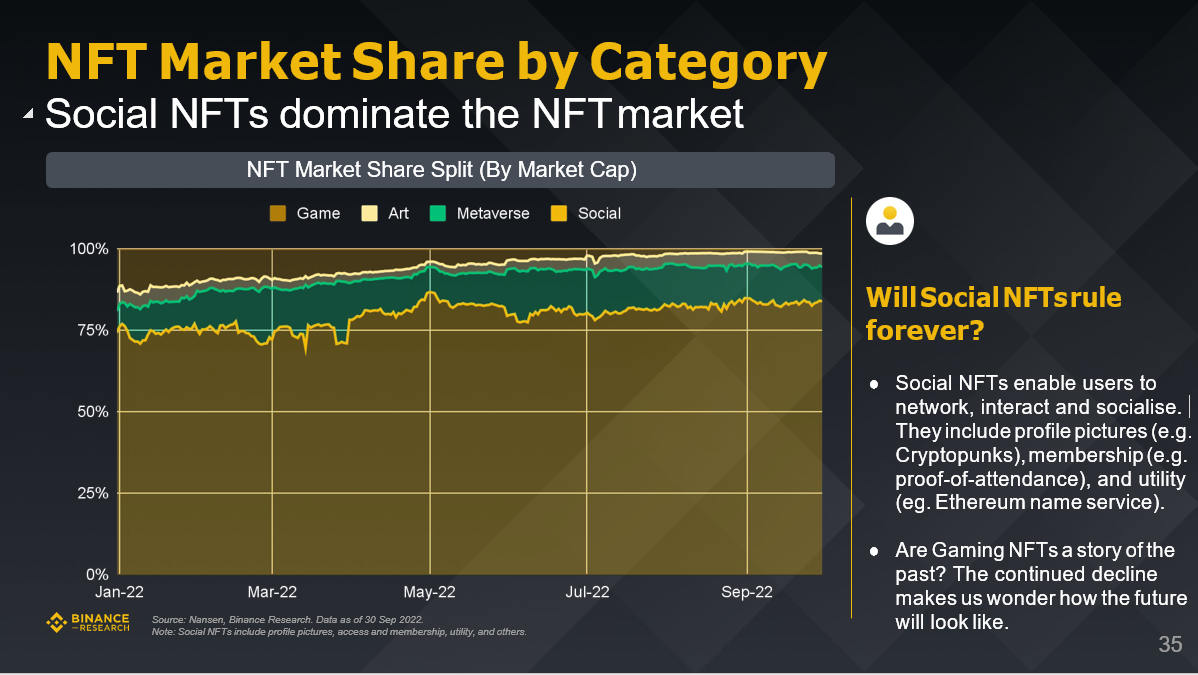
NFT Market Share by Category
According to data from Nansen and Binance Research as of September 30, 2022, social NFT dominates the NFT market (note: social NFT includes types such as PFP pictures, access rights and membership, utilities, etc.).
Binance Research Institute: Review the market status of the five key tracks in the third quarter
image description
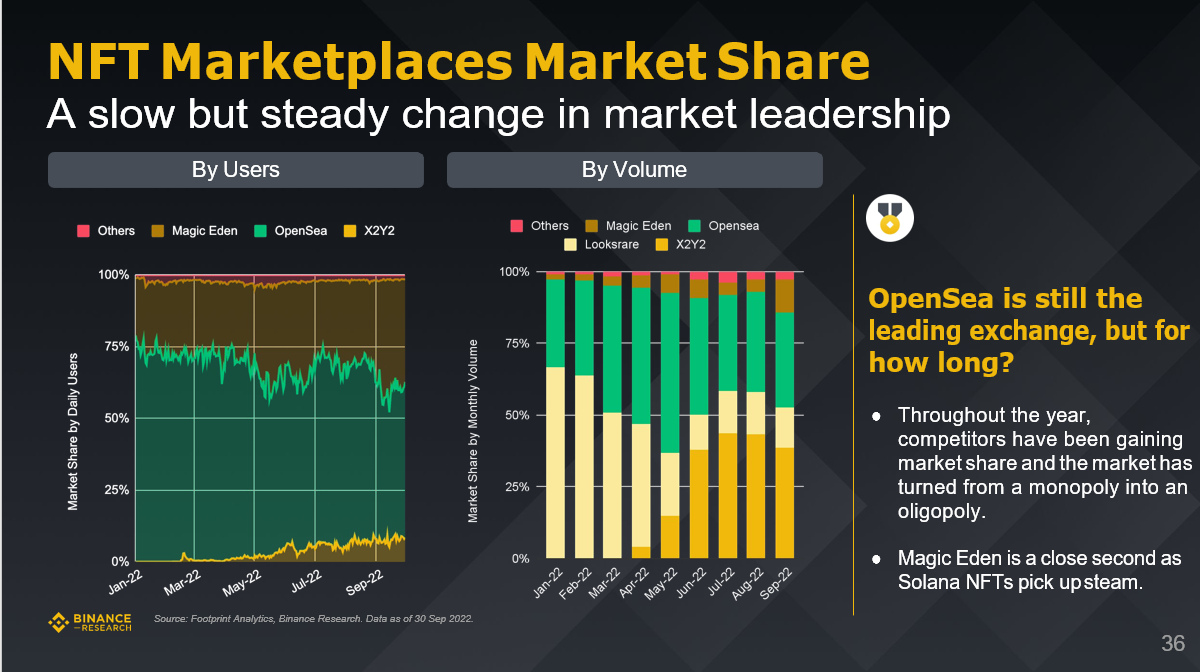
NFT market share
According to the data of Footprint Analytics and Binance Research as of September 30, 2022, the NFT market leadership has undergone slow and steady changes. OpenSea is still the leading NFT trading platform, but how long can this state last?
Binance Research Institute: Review the market status of the five key tracks in the third quarter
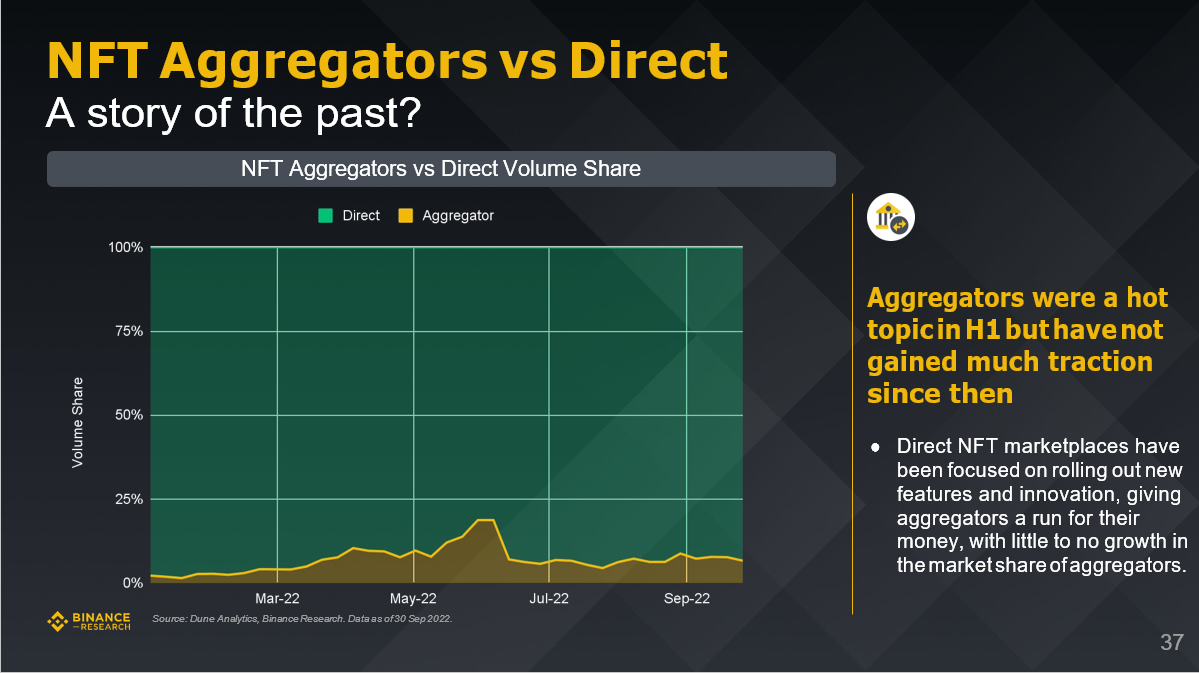
NFT aggregator and direct connection service provider
Aggregators are a hot topic in the NFT market in the first half of 2022, but have not gained much attention since then. In contrast, the direct-to-NFT market has been focused on launching new features and innovations, and in this case, the market share of NFT aggregation service providers has barely increased.
Binance Research Institute: Review the market status of the five key tracks in the third quarter
image description
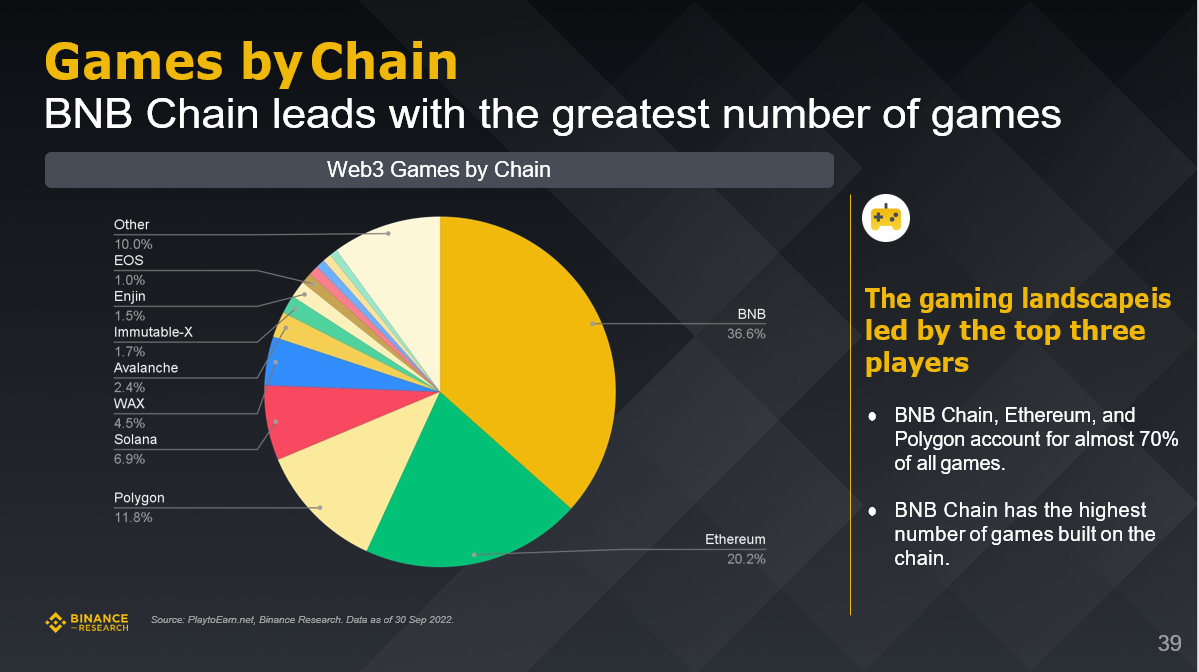
The blockchain chosen by Lianyou
According to data from PlaytoEarn.net and BinanceResearch as of September 30, 2022, the chain game industry is mainly led by BNB Chain, Ethereum, and Polygon.
Binance Research Institute: Review the market status of the five key tracks in the third quarter
image description
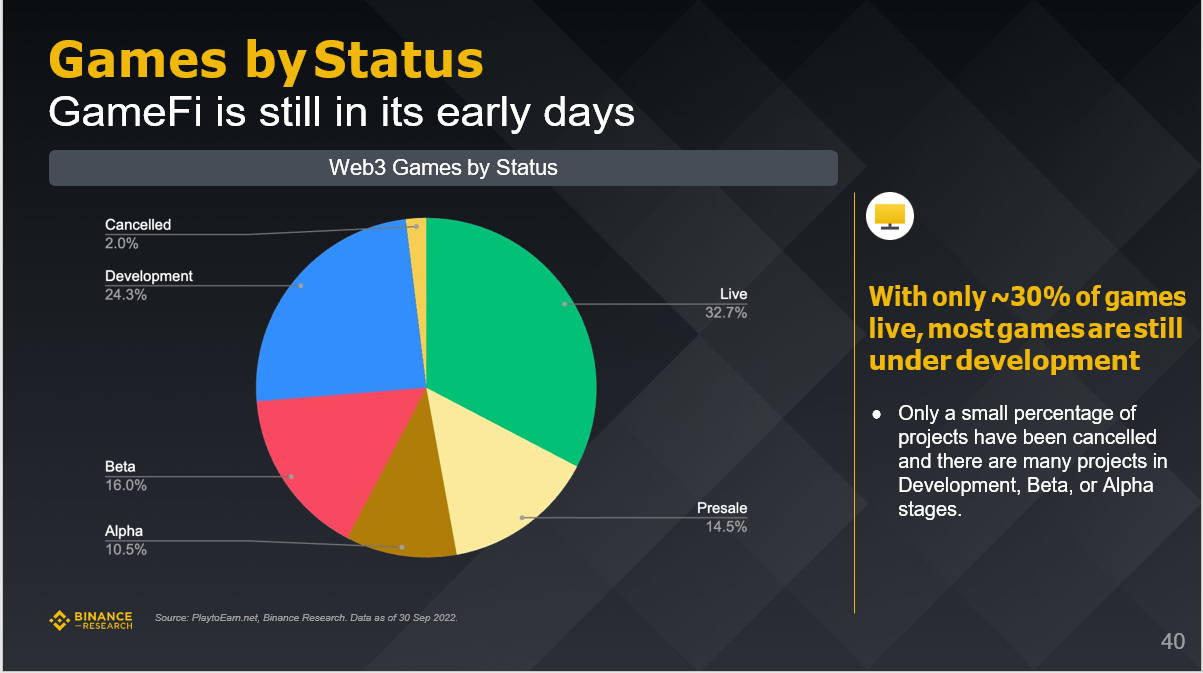
Chain game development status
According to data from PlaytoEarn.net and Binance Research as of September 30, 2022, GameFi is still in its early stages.
Binance Research Institute: Review the market status of the five key tracks in the third quarter
image description
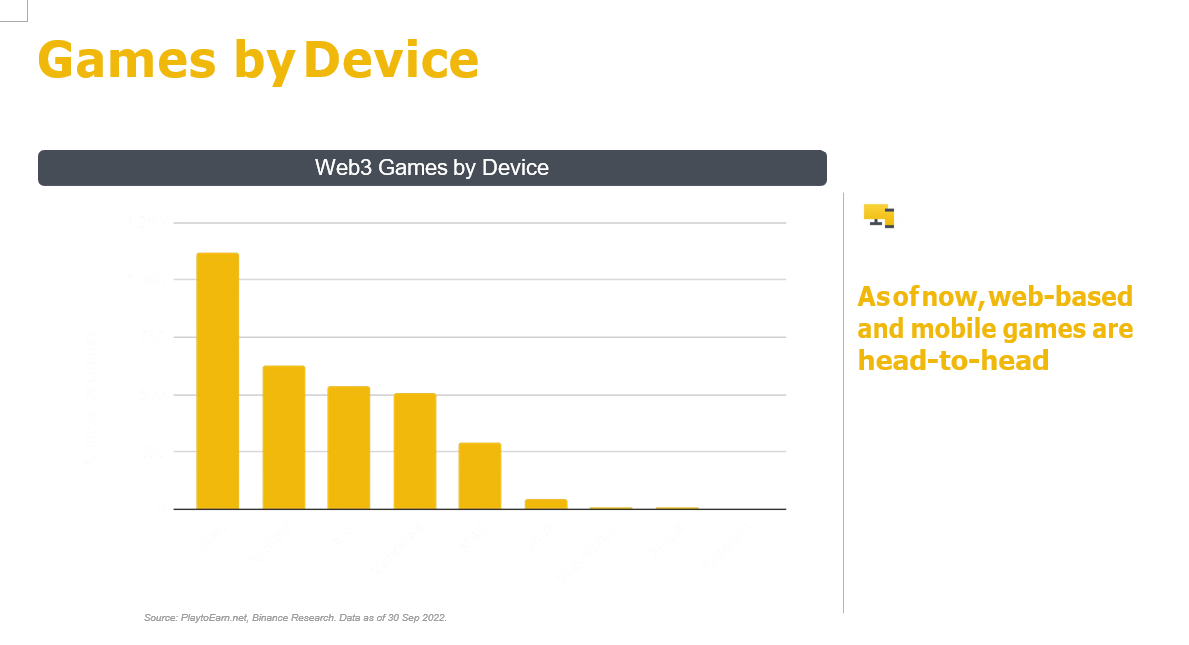
Equipment type
According to data from PlaytoEarn.net and BinanceResearch as of September 30, 2022, players are more willing to choose online games and mobile games.
At this stage, online games and mobile games are beginning to compete head-on.
Binance Research Institute: Review the market status of the five key tracks in the third quarter
image description
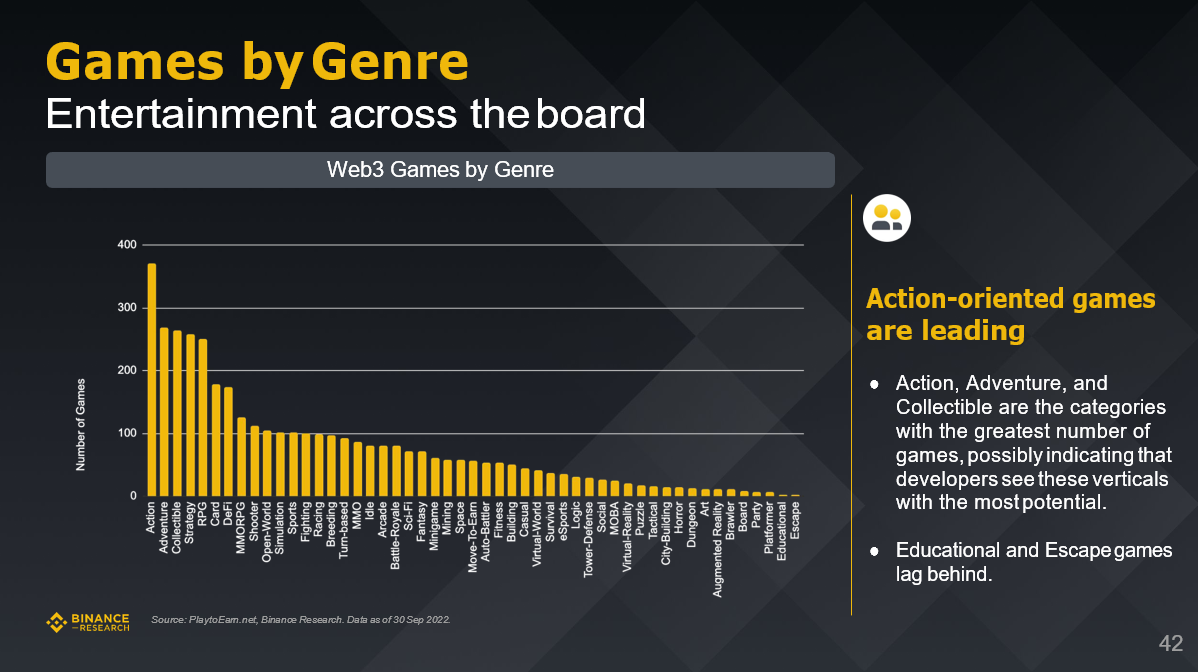
game type
The current action games are in the leading position.
Binance Research Institute: Review the market status of the five key tracks in the third quarter
image description
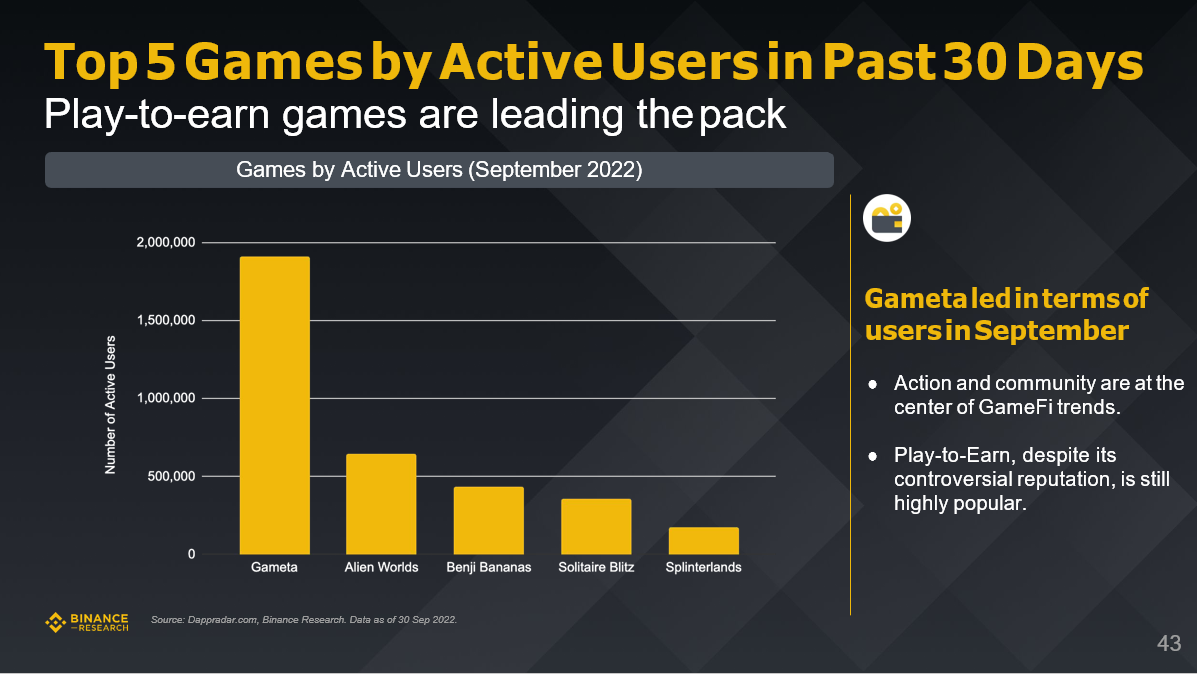
Top 5 games by active users in the past 30 days
According to data from Dappradar.com and Binance Research as of September 30, 2022, "play and earn" P2E games are leading the trend.
Binance Research Institute: Review the market status of the five key tracks in the third quarter
image description
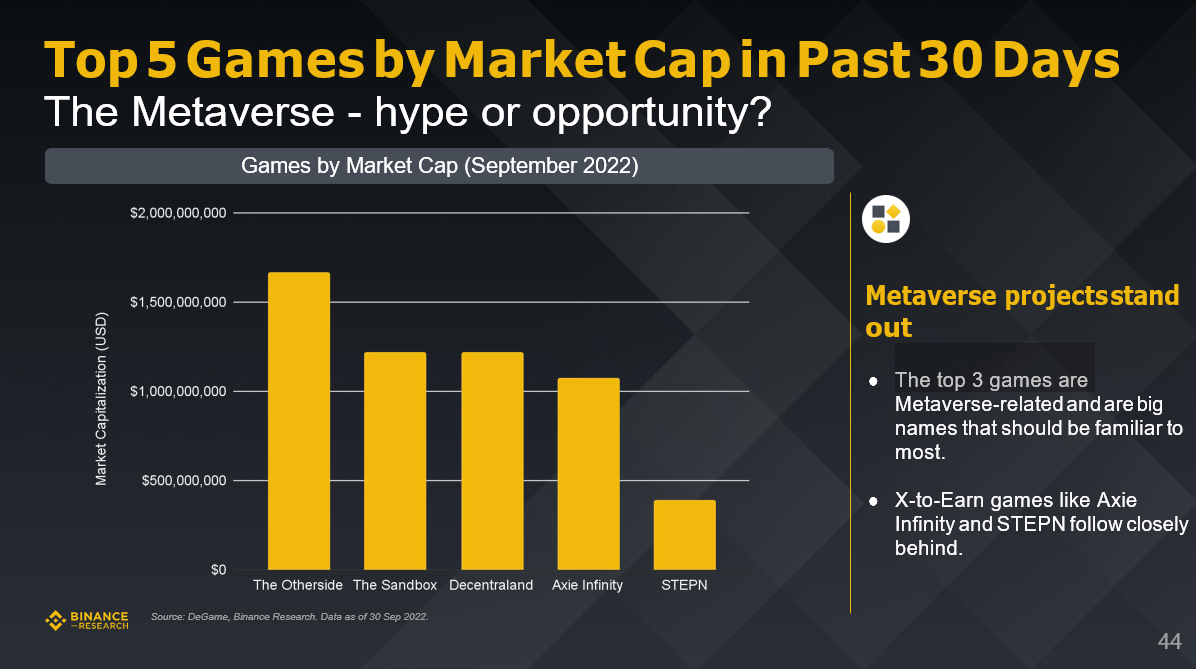
Top 5 games by market capitalization in the past 30 days
The Metaverse – Hype or Opportunity?


