






Glassnode: 암호화폐 시장, 바닥 다지기 후반 단계 진입


- 핵심 의견: 비트코인 시장은 약세장 후반부의 특징을 보이고 있으며, 가격이 5개월 연속으로 깊은 저평가 구간에 머물러 있습니다. 장기 보유자의 손절 압박은 2022년 12월 이후 최고치를 기록했지만, 시장 바닥 다지기에 필요한 조건은 대부분 충족되었으며, 반전을 위해서는 핵심 신호가 출현할 때까지 기다려야 합니다.
- 핵심 요소:
- 가격 현황: 비트코인의 현재 가격(약 64,400달러)은 실제 시장 평균 가치인 76,600달러와 단기 보유자 원가선인 72,200달러에 현저히 미치지 못하며, 할인 상태가 약 5개월간 지속되어 역사적으로 깊은 저평가 구간에 있습니다.
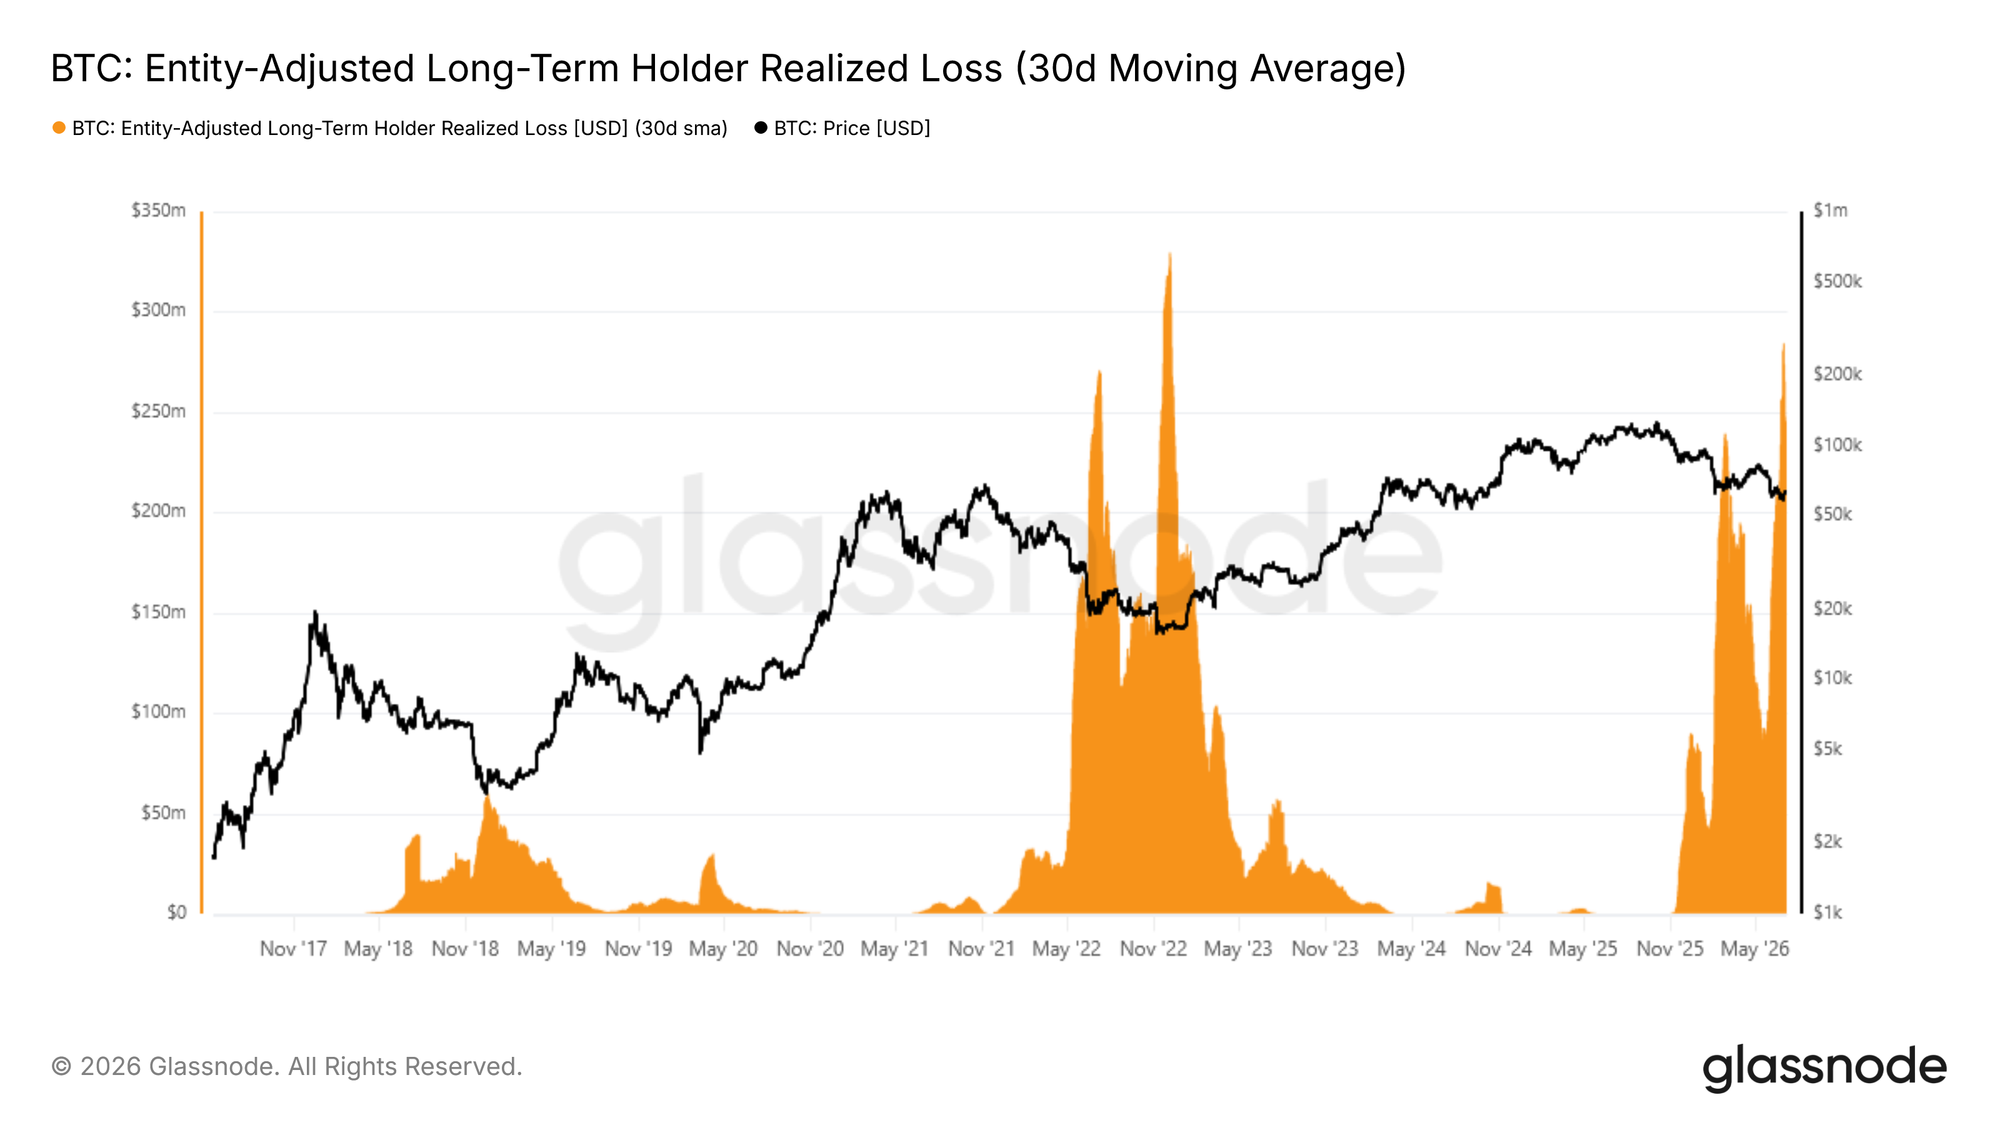
- 장기 보유자 매도 압력: 장기 보유자의 손실 실현이 체인상 총 손실 비율에서 차지하는 비중이 43%까지 상승했으며, 일일 손실 실현 최고치는 2억 8천만 달러에 달해 2022년 12월 이후 최고 수준입니다. 매도 압력이 아직 약화될 조짐을 보이지 않고 있습니다.
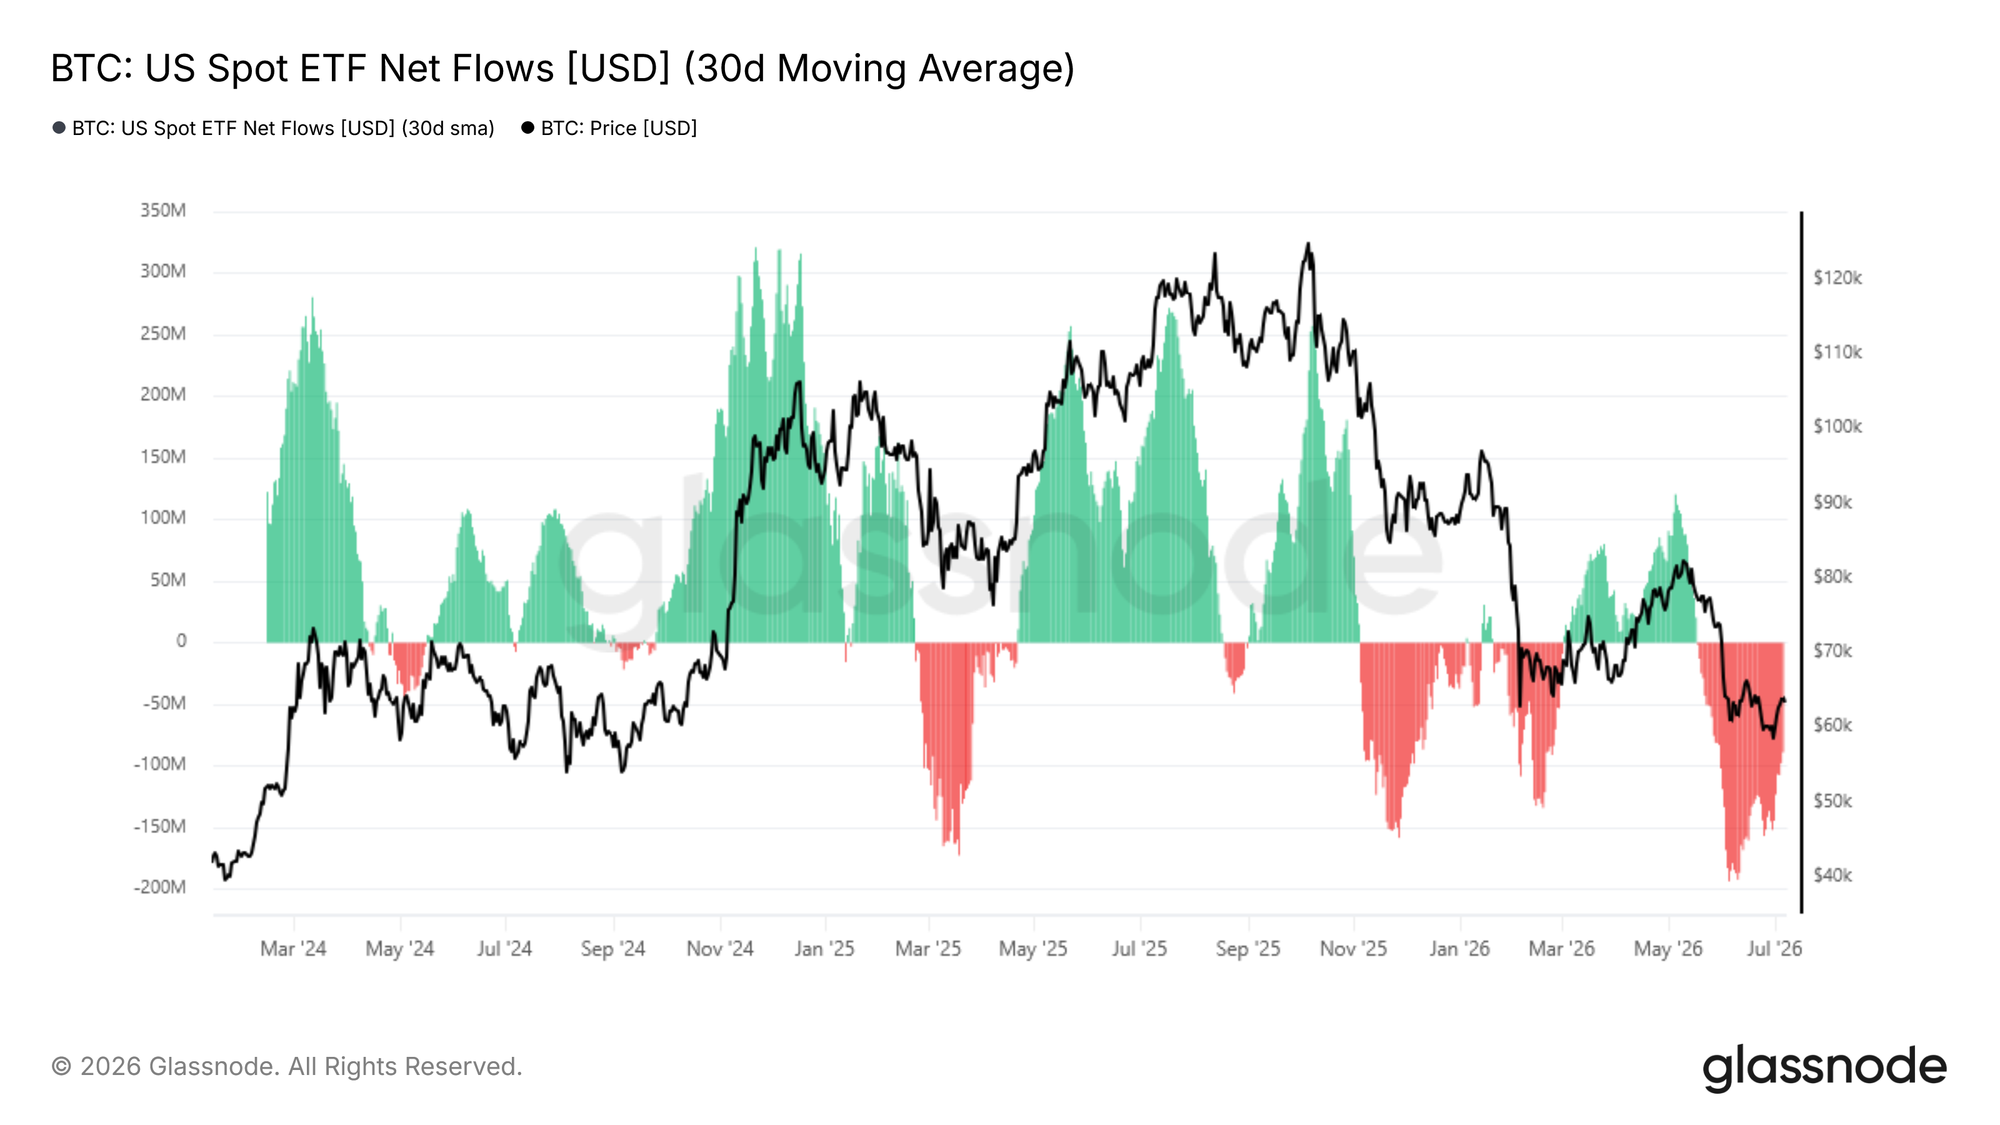
- ETF 자금 흐름: 현물 ETF의 자금 유출 규모는 6월 초 최고치(일 1억 9,300만 달러)에서 일 8,890만 달러로 완화되었지만, 여전히 월간 순유출을 유지하며 기관 매수 수요가 안정화되지 않았습니다. 일평균 거래량은 2025년 10월 최고치 대비 약 80% 감소했습니다.
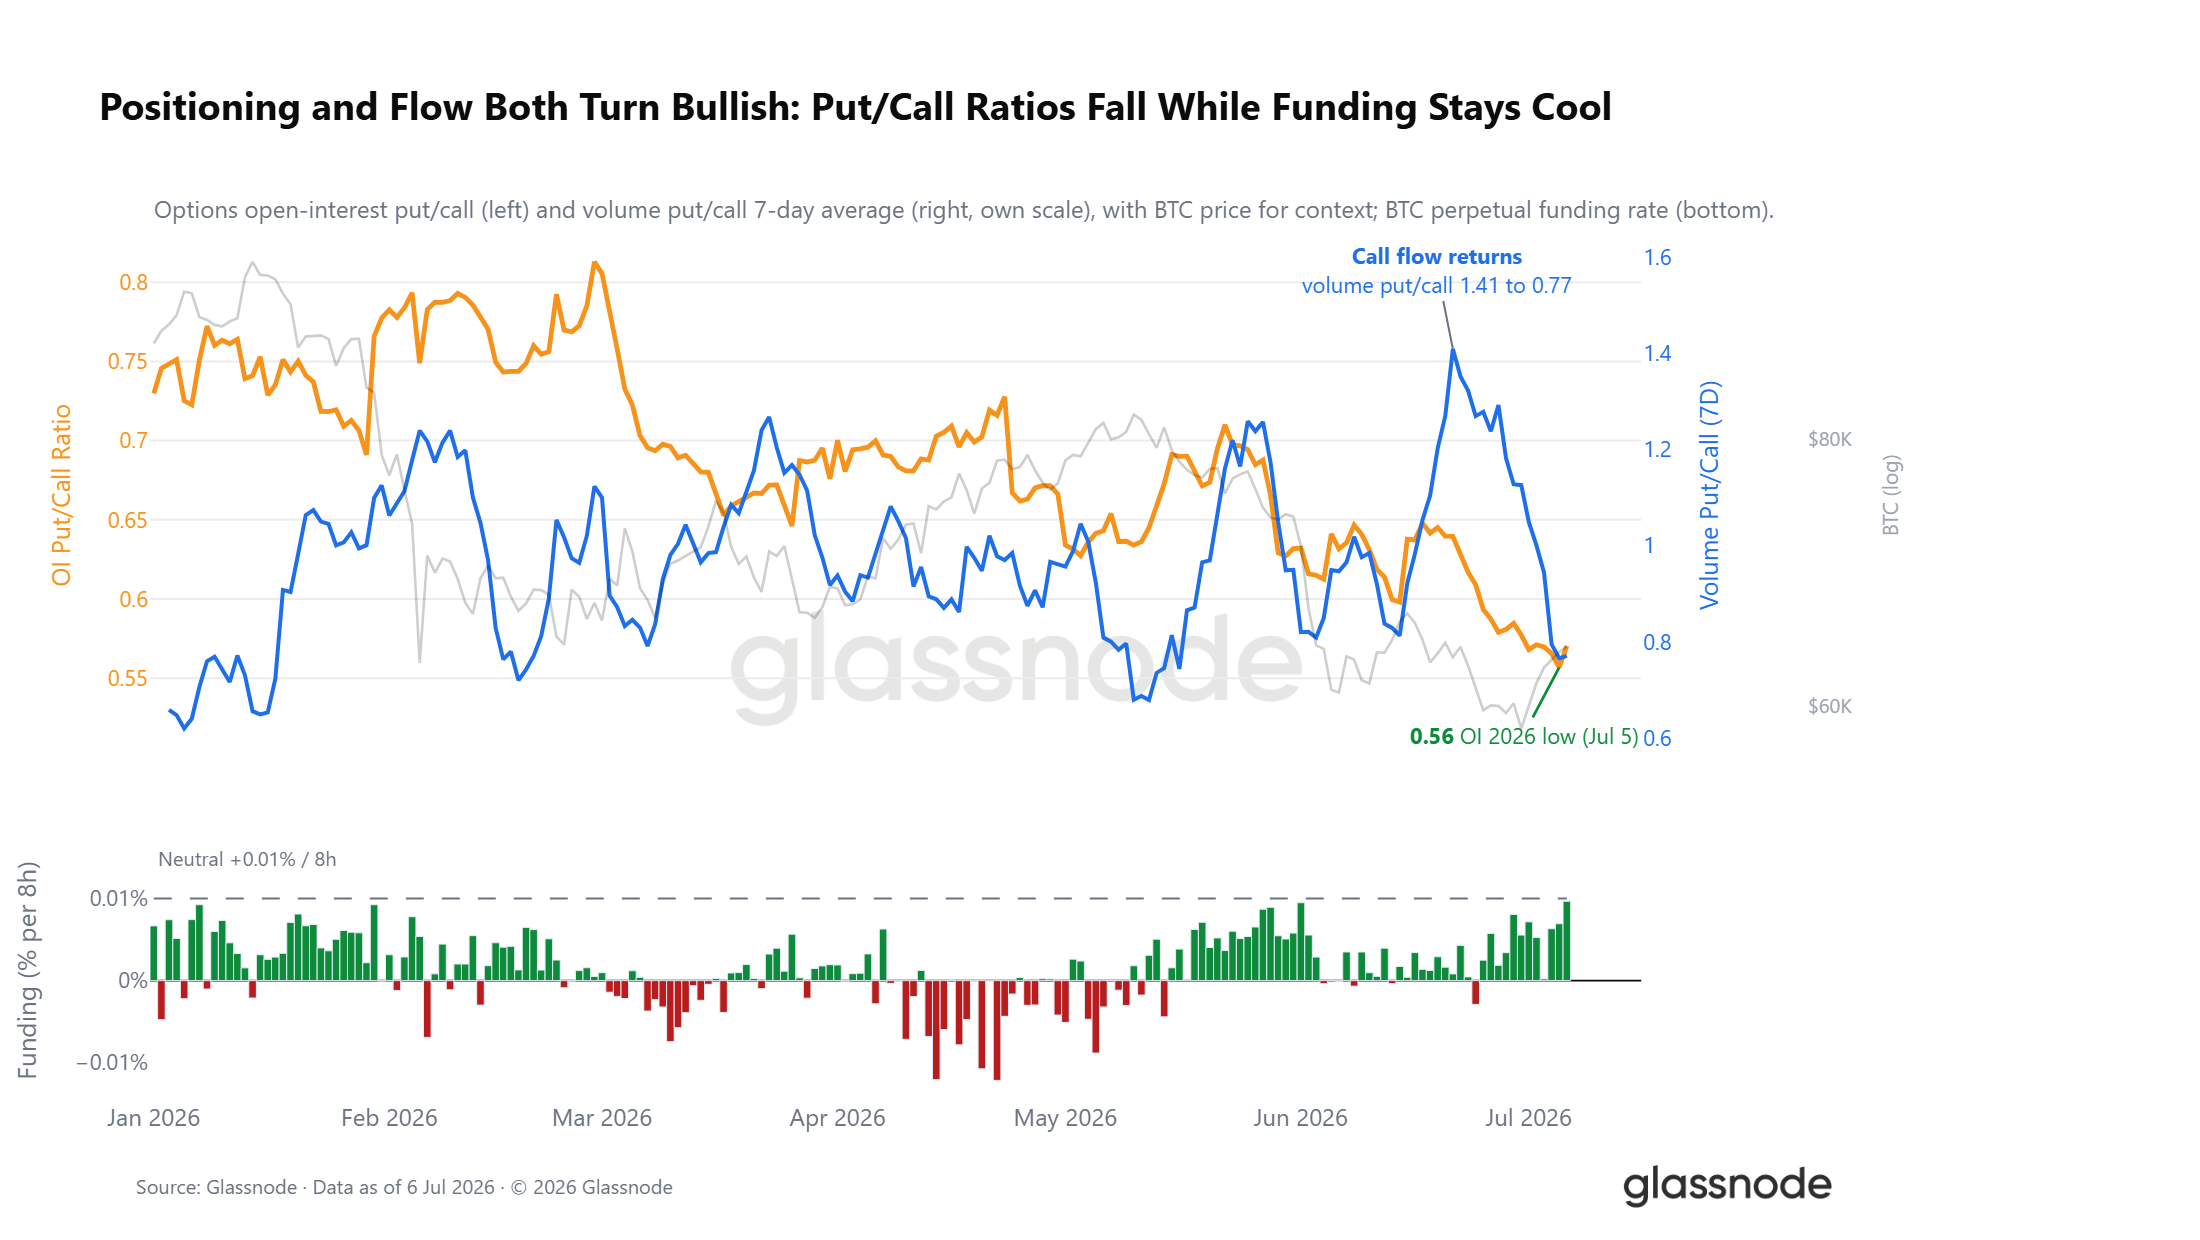
- 파생상품 포지션: 옵션 풋/콜 비율은 0.56까지 하락하며 연중 최저치를 기록했습니다. 무기한 계약 자금비용은 0.01% 균형선을 밑돌아, 시장은 군중 속의 공매도에서 신중한 매수 우위로 전환되었습니다.
- 변동성 및 헤징 비용: 옵션 표면은 여전히 하방 위험을 가격에 반영하고 있으며, 25델타 변동성 스큐는 프리미엄을 유지하고 있습니다. 그러나 실제 헤징 비용은 하락하고 있으며, DVOL 변동성 지수는 12개월 최저치로 떨어져 헤징 수요가 점차 사라지고 있습니다.
Original Authors: CryptoVizArt, Frederik Theissen, Glassnode
Original Translation: Luffy, Foresight News
Bitcoin's price has been trading below its realized market price and short-term holder cost basis for five consecutive months, placing it in a deeply undervalued zone.
The proportion of realized losses from long-term holders relative to total on-chain realized losses has risen to 43%, with daily realized losses peaking at $280 million, the highest level since December 2022. Spot ETF outflows have moderated but remain in a net monthly outflow state; the average daily trading volume of ETFs is between $650 million and $950 million, down approximately 80% from the peak in October 2025. Institutional buying demand has yet to stabilize.
Derivatives positioning has shifted to a cautiously bullish stance, with the put/call ratio dropping to its lowest point in 2026; however, the options volatility surface still maintains a defensive premium, with the spot price significantly below the max pain price. The market has entered the later stages of bottoming, and the sustained narrowing of selling pressure from long-term holders is a crucial prerequisite for a trend reversal and recovery.
Macro Perspective
Crude Oil Surges, Risk Assets Under Pressure
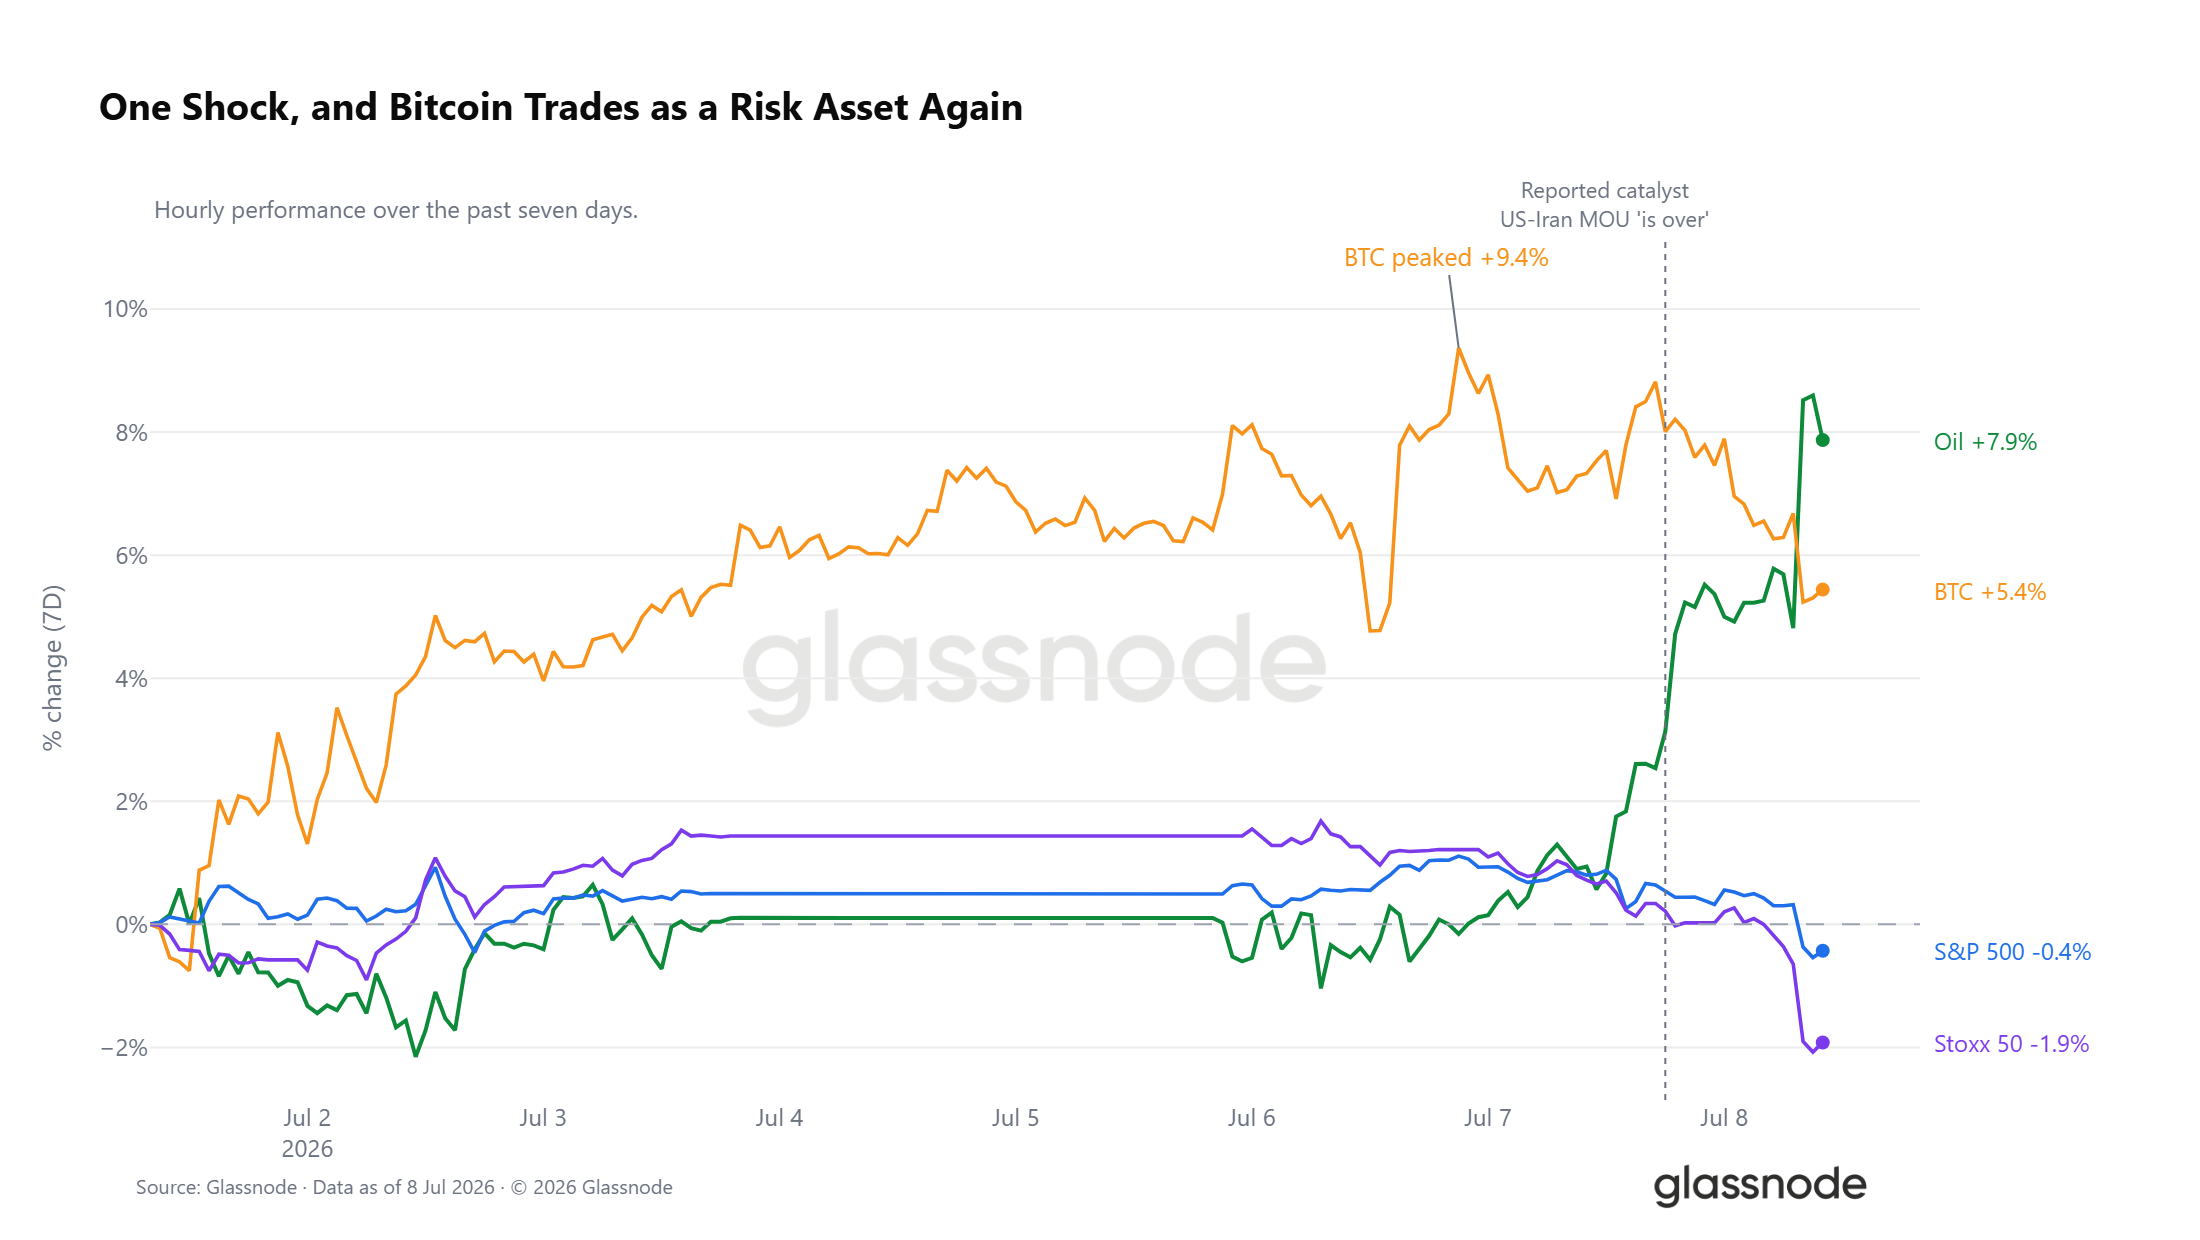
WTI crude oil has risen by 7.9% over the past 7 trading days, with the majority of gains concentrated recently, following news that the US-Iran Memorandum of Understanding has expired. This shock has affected all asset markets. Bitcoin saw a weekly high of 9.4% gains, but has since pulled back to a 5% weekly gain; the S&P 500 and Euro Stoxx indexes have turned negative, with European stocks leading the decline in global risk assets. Currently, Bitcoin's price movement is highly correlated with risk assets.
Liquidity Environment: Intensifying Bull-Bear Contradiction
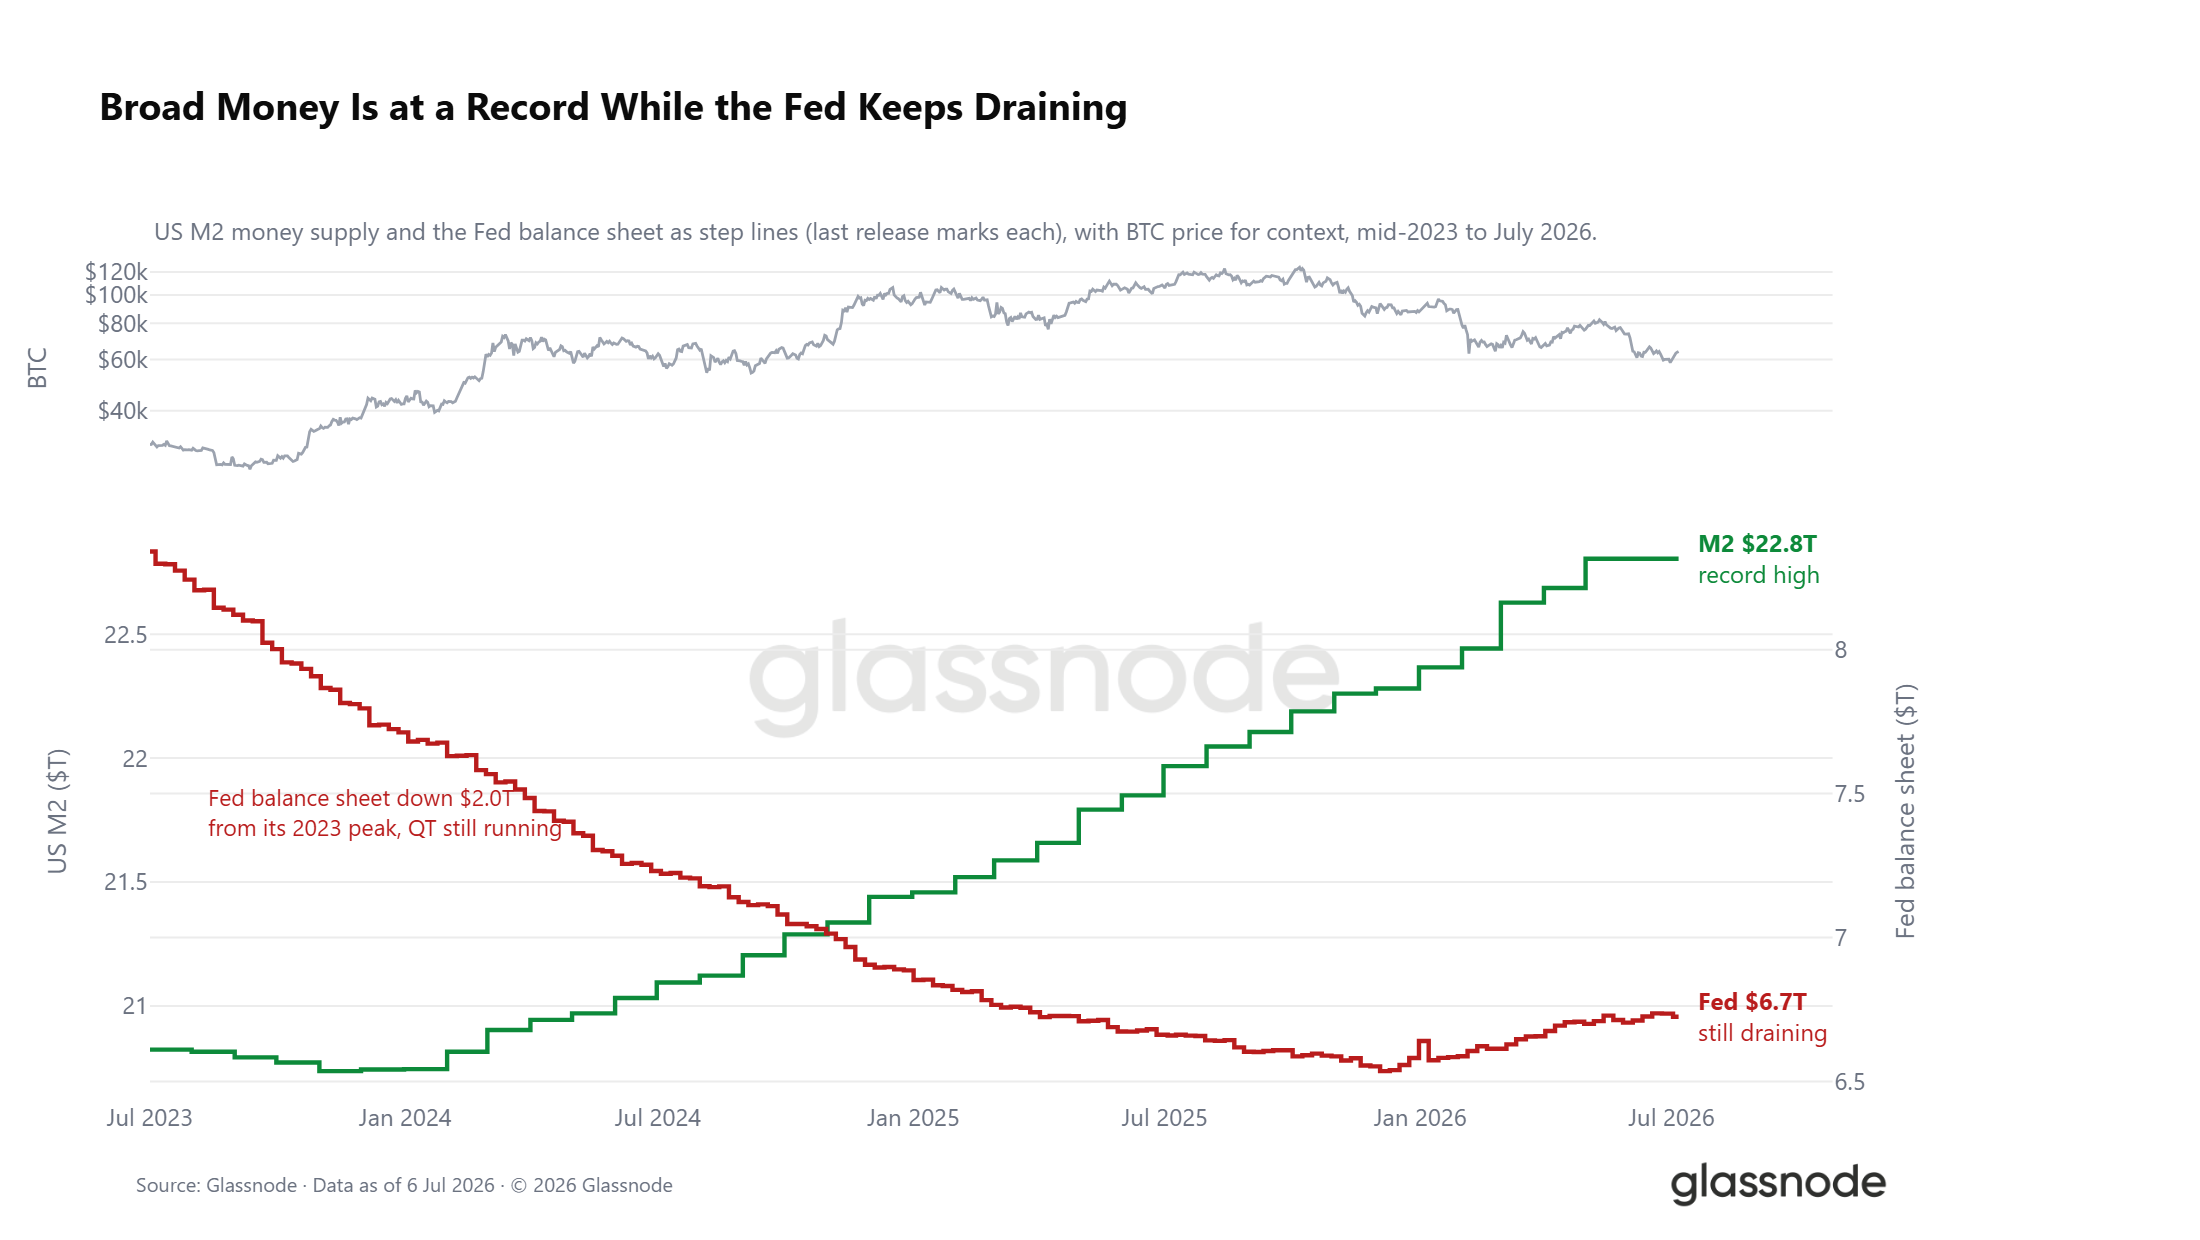
Amidst the external shock from crude oil, the market liquidity environment presents a fragmented pattern. The US broad money supply M2 has climbed to a record high of $22.8 trillion. Historically, periods of broad money expansion often boost market risk appetite; however, the Federal Reserve's balance sheet continues to shrink, currently $2 trillion below its 2023 peak. These two liquidity signals create a strong hedge: the broad money supply continues to rise, but quantitative tightening (QT) persists, with real interest rates hovering around 1%, keeping the opportunity cost of holding non-yielding digital assets high. The window of opportunity from the macro perspective hasn't completely closed, but neither has it formed clear accommodative support.
On-Chain Data
Five-Month Period of Deep Undervaluation
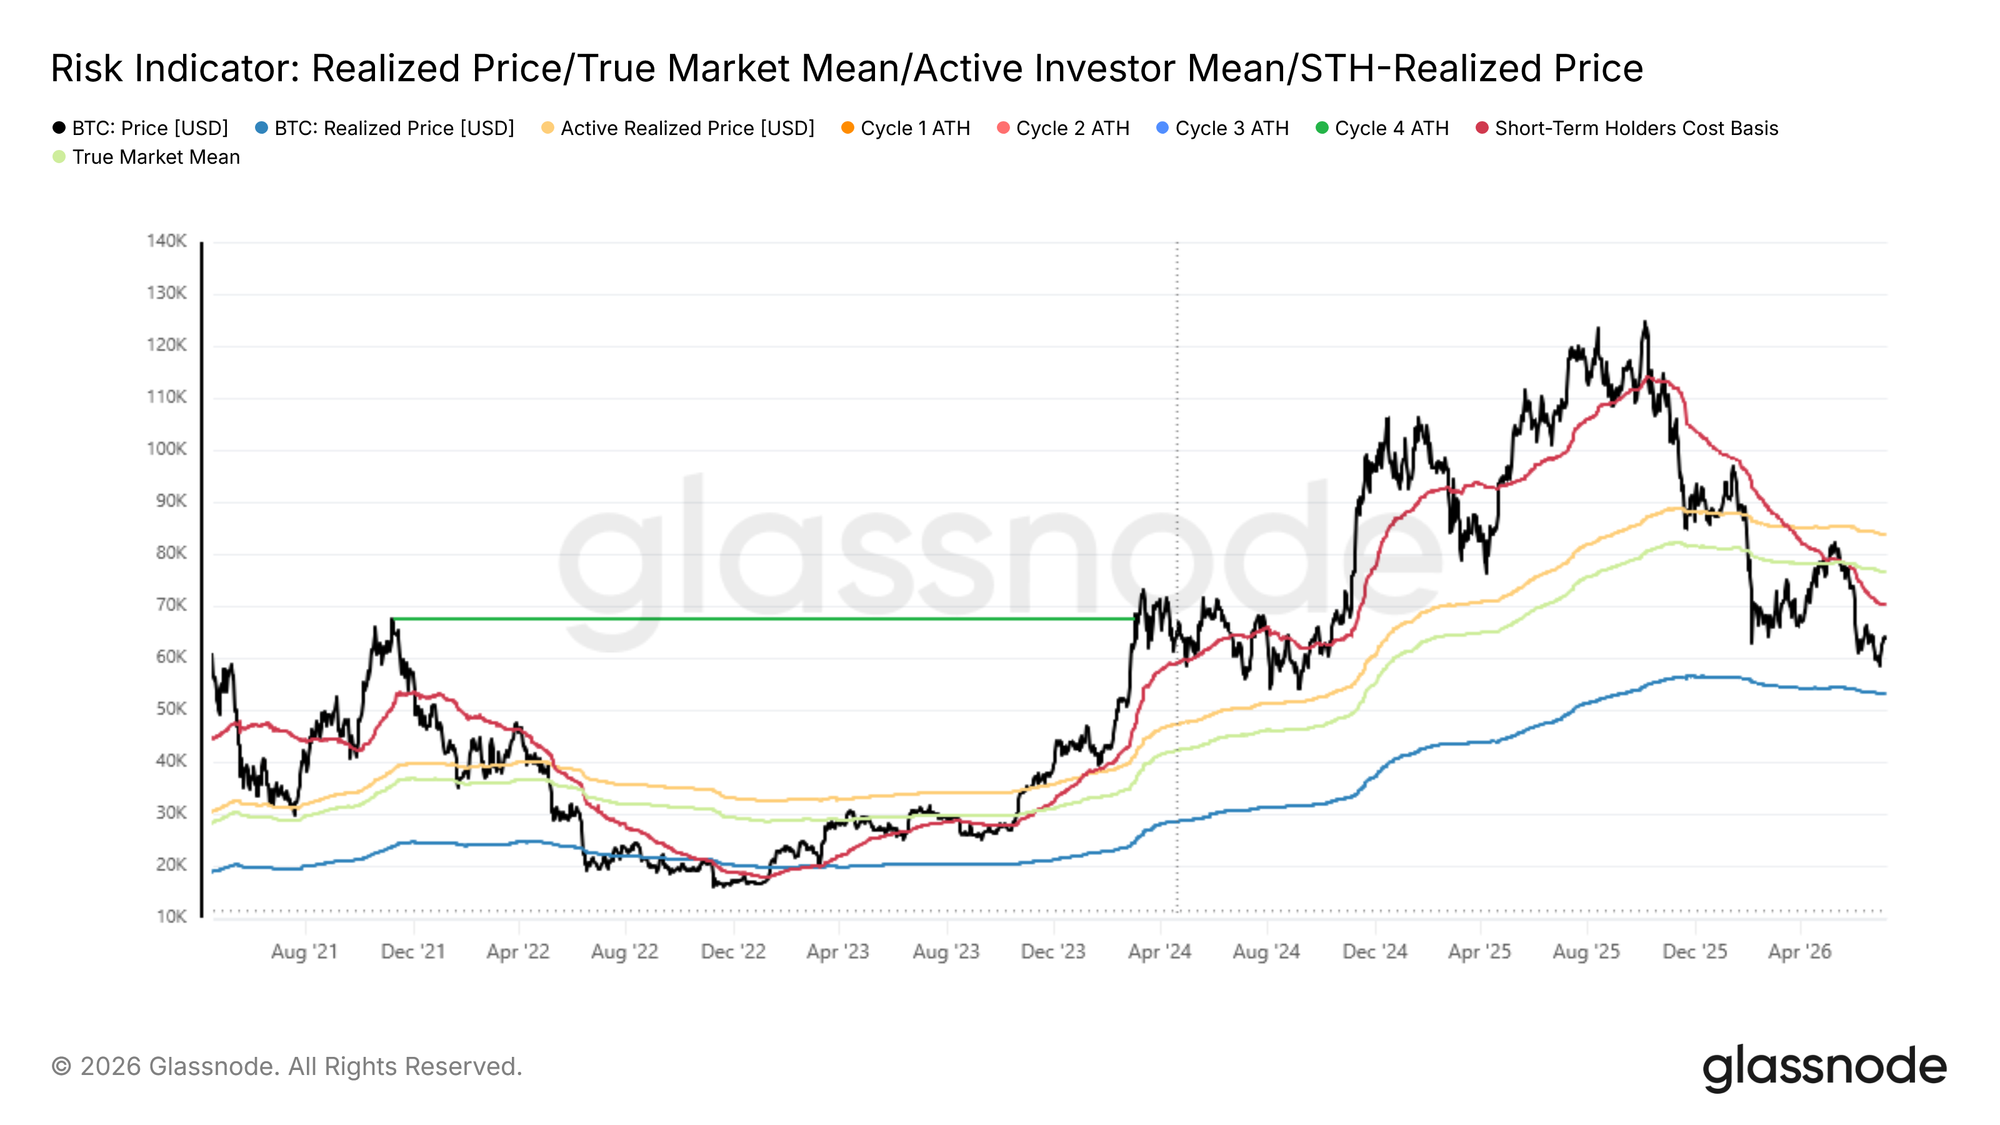
Over the past week, Bitcoin bounced from $58,300 to $64,400, showing short-term price recovery, but it remains significantly below the realized market price of $76,600 and the short-term holder cost basis of $72,200. Only when the price reclaims these two key levels can the market escape the deep undervaluation zone; otherwise, the market remains vulnerable to external negative catalysts.
The duration of this discount period warrants close attention. Since early February 2026, the price has been trading below the active investor cost basis and the breakeven point for recent entrants, a period lasting nearly five months. This represents one of the longest deep discount cycles in Bitcoin's history.
Continuous coin turnover within this prolonged discount zone, with new capital entering below the cost basis of previous buyers and the overall market active cost, has historically formed the foundation for cycle bottoms. This presents attractive long-term allocation opportunities for value investors. Various indicators suggest the bottoming process is in its late stages, but a pullback to $53,000 cannot be entirely ruled out.
Concentrated Stop-Losses from Long-Term Holders
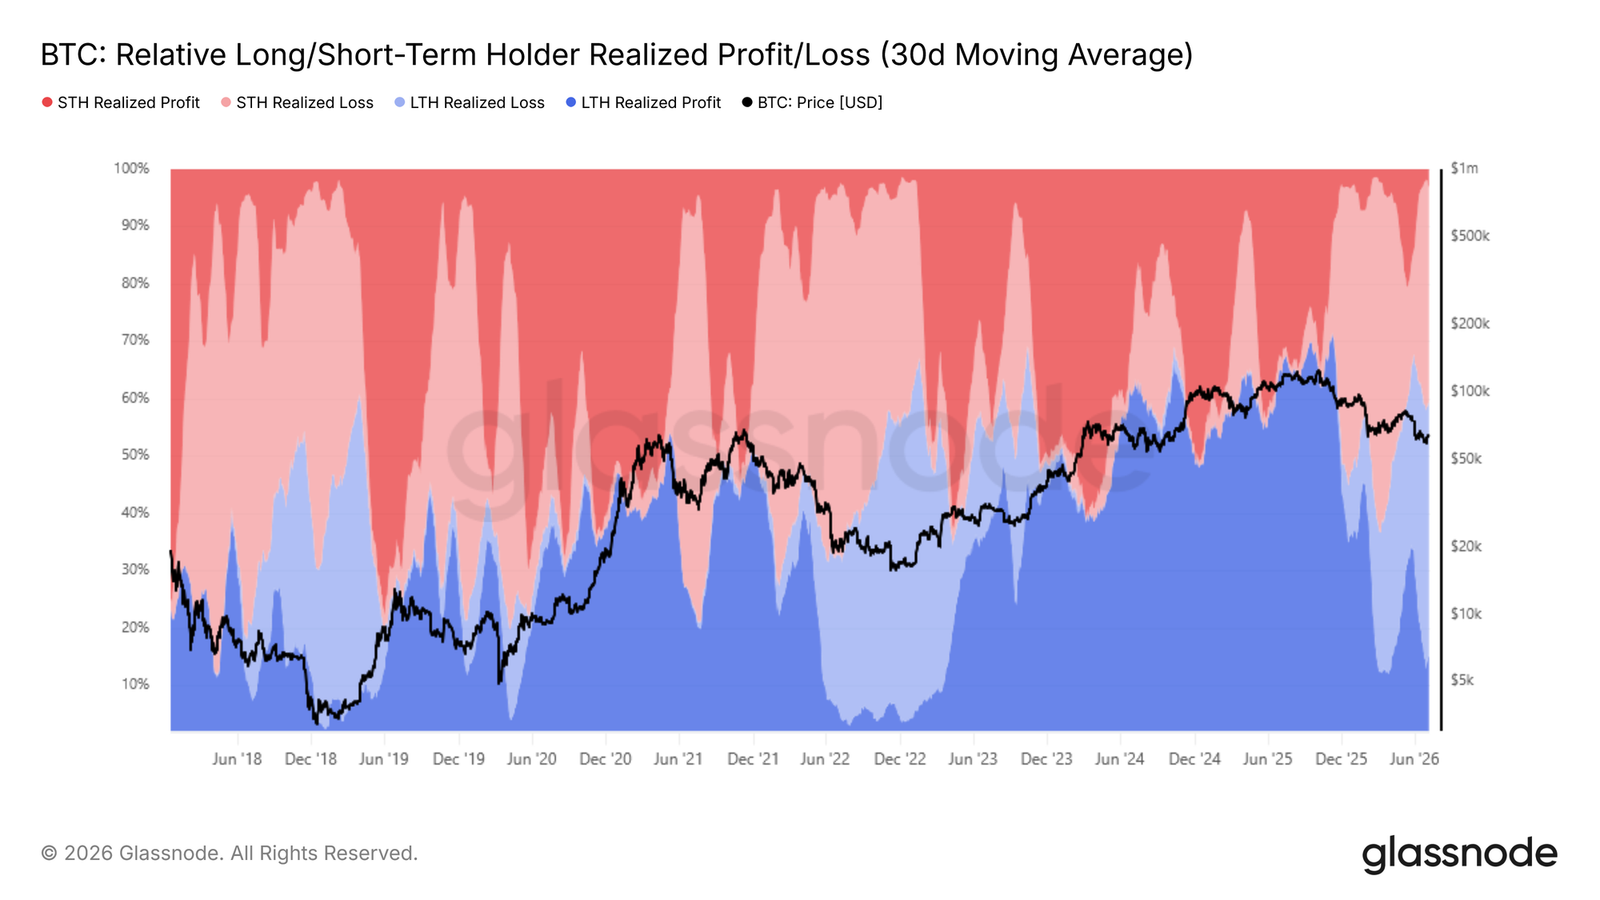
The market is forming a cycle bottom, and the core question is identifying the primary source of downward selling pressure. The relative profit-taking/loss realization indicator between long-term and short-term holders calculates the proportion of total on-chain realized profits/losses attributable to these two groups, directly revealing the share of gains/losses being locked in by each type of holder.
After the price fell below the realized market price, the 30-day moving average proportion of losses realized by long-term holders (LTH-SOPR) surged from 15% in early February 2026 to its current 43%. The selling pressure from stop-losses triggered by unrealized losses in this group has become the most dominant bearish force suppressing the price.
Most of these investors entered near the cycle peak. After months of deep retracement, their holding confidence has gradually eroded, leading to a concentrated exit. This coin structure directly explains why every rebound faces concentrated selling from deeply entrenched positions, making it difficult for the price to firmly hold above the current range.
Stop-Loss Pressure Shows No Signs of Abating
Loss realization by long-term holders has become the primary market pressure. The next key observation point is whether this selling pressure begins to subside.
The entity-adjusted Long-Term Holder Realized Loss (30-day SMA) indicator tracks the loss amount from sales by users holding coins for over 155 days, filtering out internal address transfers to accurately reflect real stop-loss exit behavior. Recently, this indicator hit a new daily peak, with a single-day loss realization of approximately $280 million, the highest since December 2022 and the second major wave of long-term holder capitulation in this bear market.
A key difference is that after the first peak in stop-losses, the pressure declined periodically, whereas this wave of selling has yet to show a contraction in scale. A clear downward trend in this indicator is a fundamental condition for the market to transition into a bull market. Over the coming weeks or months, the trajectory of this indicator will be crucial for determining whether the market has truly finished flushing out selling pressure.
Off-Chain Market
ETF Outflows Slow, But Trend Not Reversed
Shifting from on-chain to off-chain, spot ETF capital flows provide direct insight into institutional behavior. The 30-day moving average of ETF net flows smooths out daily fluctuations, revealing underlying trends in institutional holdings.
Since mid-May 2026, this indicator entered a monthly net outflow zone. After a single-day outflow peak of $193 million in early June, it has eased to a daily net outflow of $88.9 million. The slowdown in outflows is a mildly positive sign, but the market continues to bleed capital monthly, indicating institutional buying demand hasn't stabilized. Only when capital flows consistently narrow to a balanced range can one anticipate an expansive bullish short-term move.
Institutional Trading Volume Remains Low
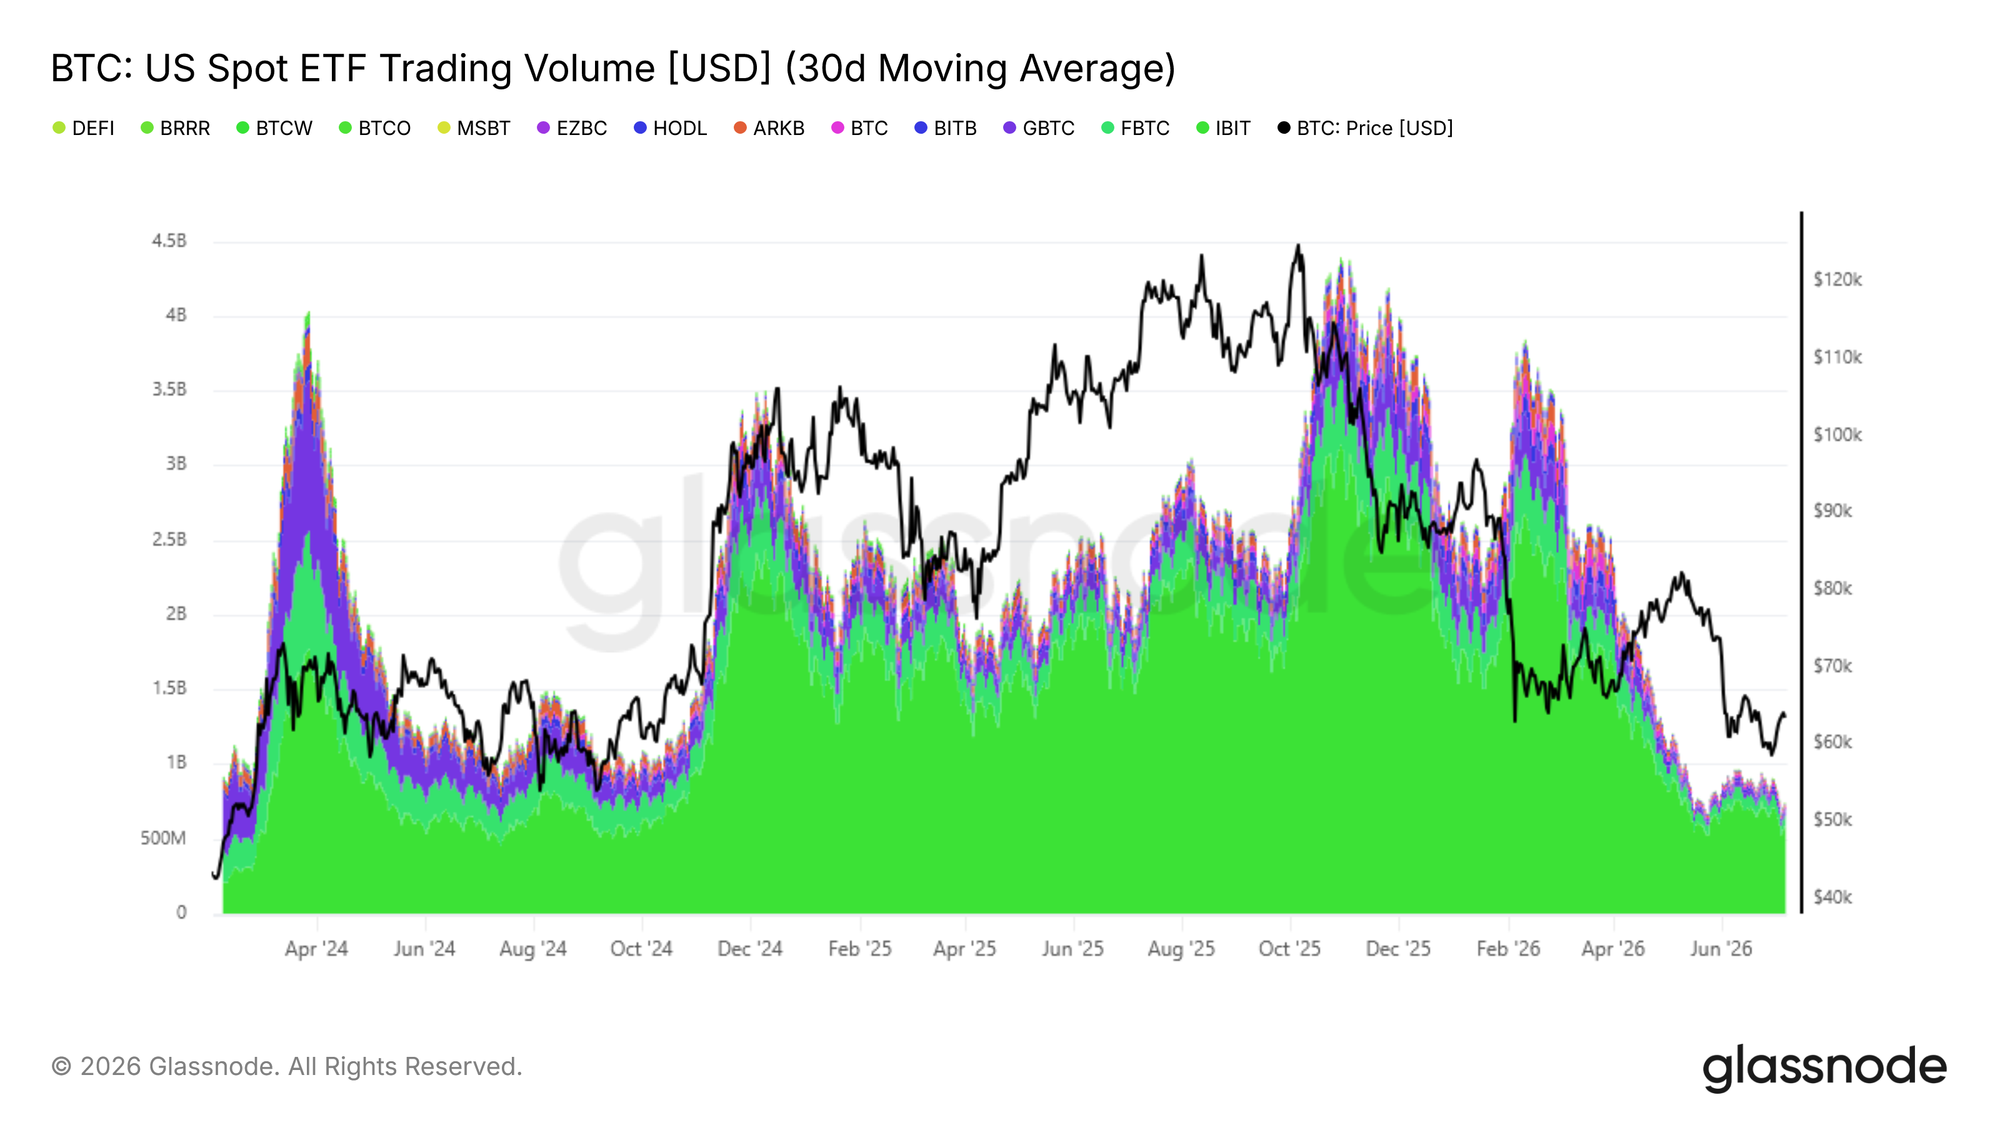
Besides net inflow data, the trading volume of US spot ETFs can help gauge the degree of institutional confidence recovery. The 30-day moving average of daily ETF trading volume currently fluctuates between $650 million and $950 million. This level is comparable to Q4 2024 but approximately 80% lower than the daily average peak of $4.4 billion set in October 2025.
Current trading volume levels represent only basic institutional participation. Compared to bull market peaks, it remains extremely subdued, indicating that mid-to-long-term bullish conviction among ETF investors has not substantially returned. Only when average daily trading volume picks up sustainably while net capital outflows continue to narrow—both signals appearing simultaneously—can institutional demand recovery be confirmed. Until both types of indicators improve concurrently, off-chain data corroborates on-chain metrics, keeping the market in a bearish-dominant phase.
Derivatives Market
Shorts Closed, Positioning Shifts to Cautiously Bullish
Against the backdrop of weakening risk sentiment, derivatives positioning has shown a counter-trend shift. The put/call ratio for open interest in options has fallen to 0.56, the lowest level of 2026, meaning there are currently two call options for every put option. Options flow volume confirms this trend: two weeks ago, during Bitcoin's second test of lows, there was a surge in buying puts for hedging, causing the put/call volume ratio to spike. As call orders have since returned, the ratio has rapidly declined, even though the spot price has only recovered a portion of its losses.
Perpetual contract funding rates also support this positional shift. The average funding rate for perpetual contracts has been consistently below the 0.01% bull-bear equilibrium line, far from the levels seen in crowded long trades. The derivatives market has completed the flushing of downside risk via short squeezes and has turned cautiously bullish in response to the external shock. This is a complete reversal from the crowded short positioning seen before the significant decline.
Options Skew Continues to Price Downside Risk
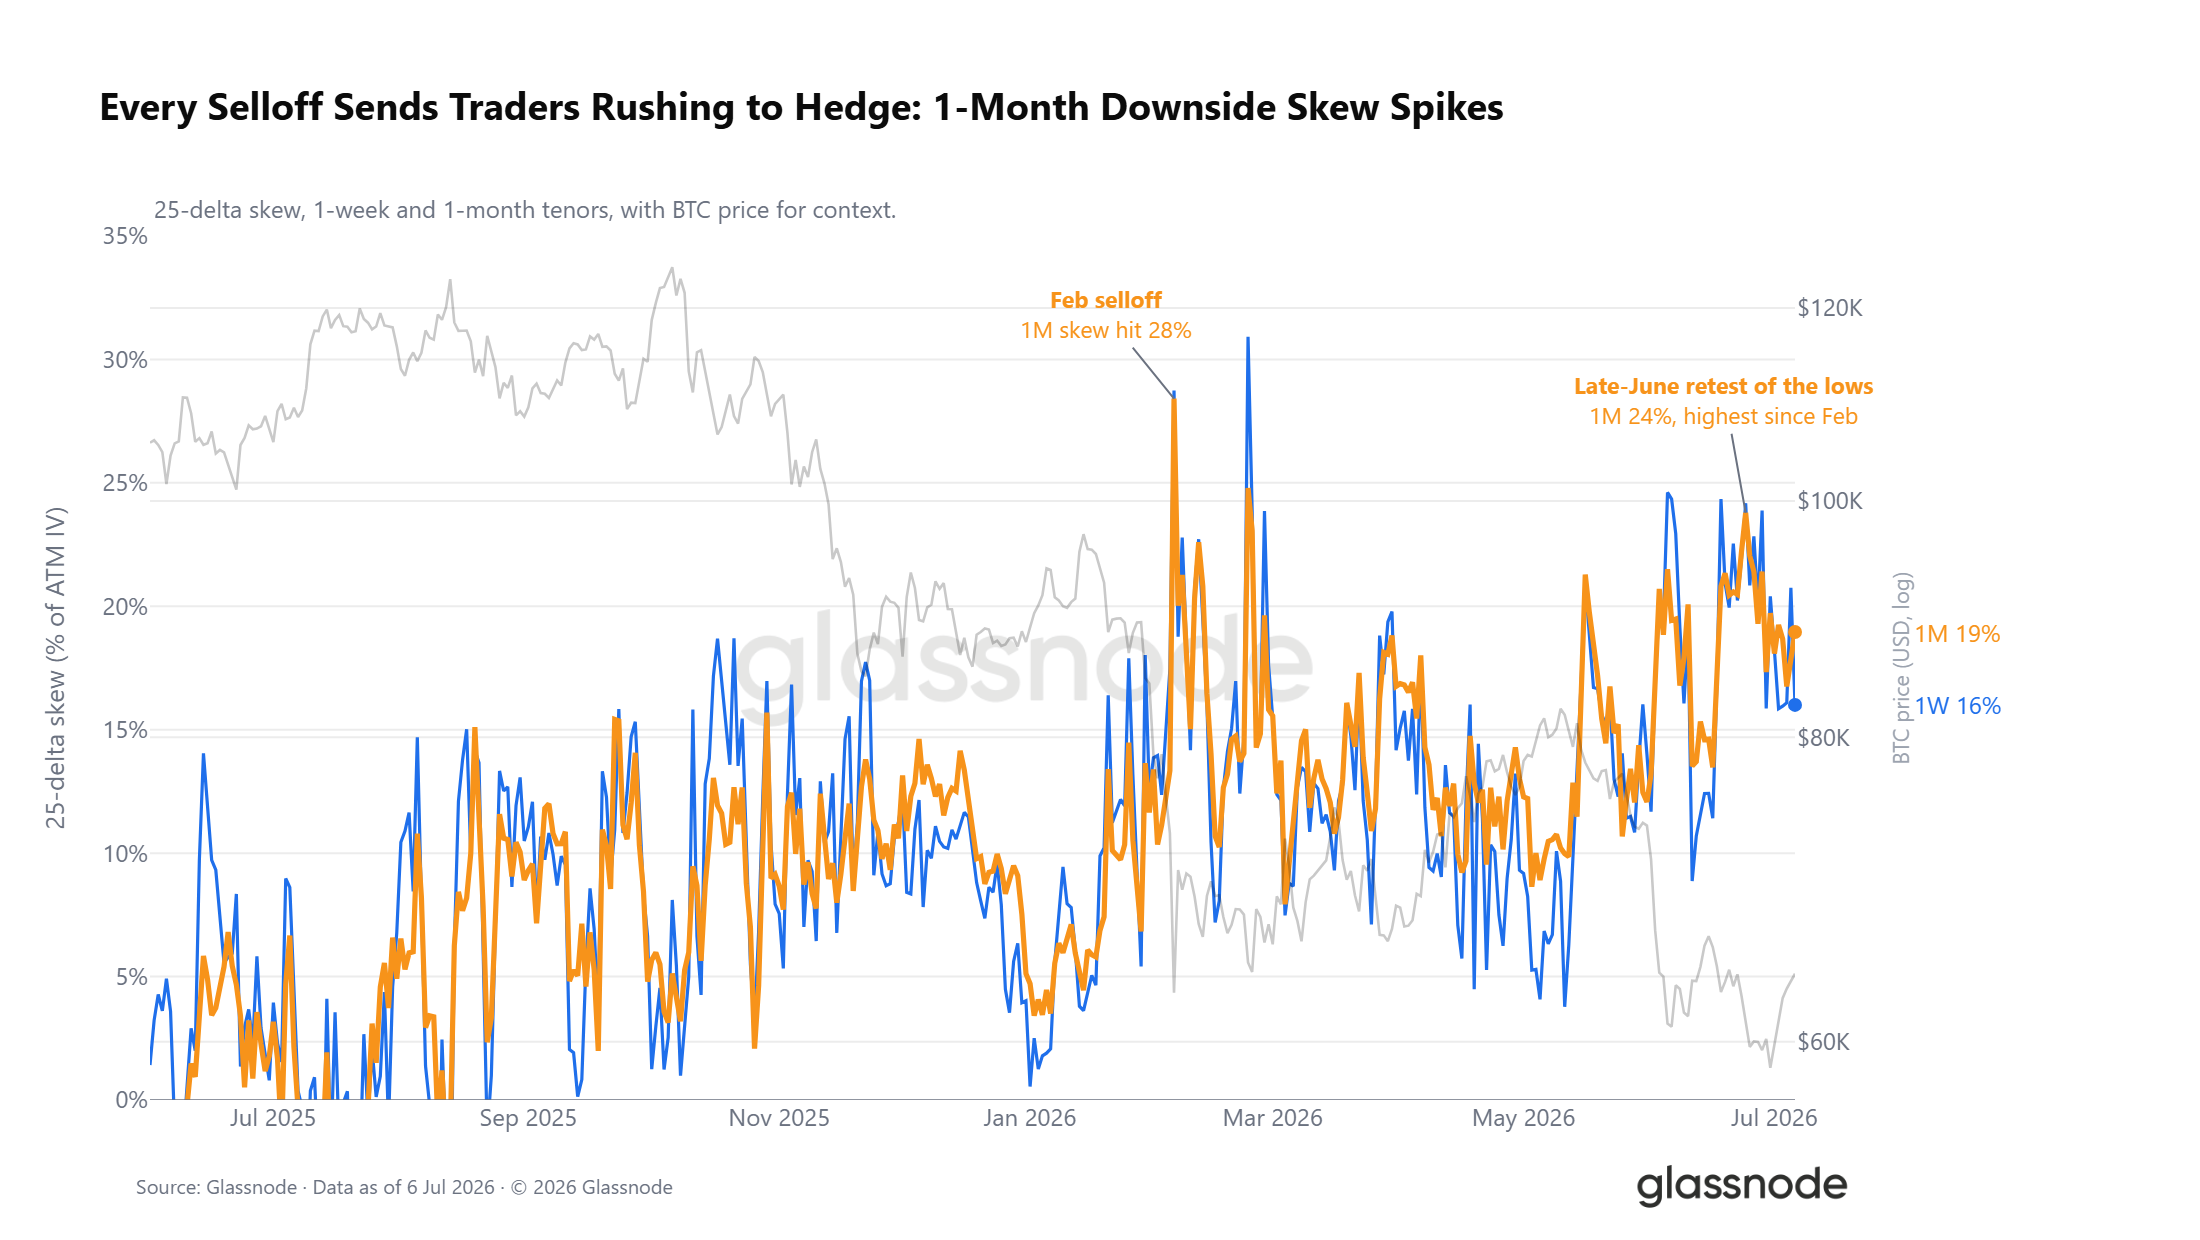
While overall positioning is bullish, the options volatility surface offers a contradictory signal. The 25-delta volatility skew indicator (the premium of downside protection relative to upside potential) maintains a premium across all maturities. Each downtrend this year has pushed this premium higher. It surged to 24% in late June, representing the most defensive sentiment for near-term contracts since the February sell-off. Despite the overall bullish market positioning, traders are still willing to pay a premium to buy downside hedging instruments.
Spot Price Deviates from Max Pain Price
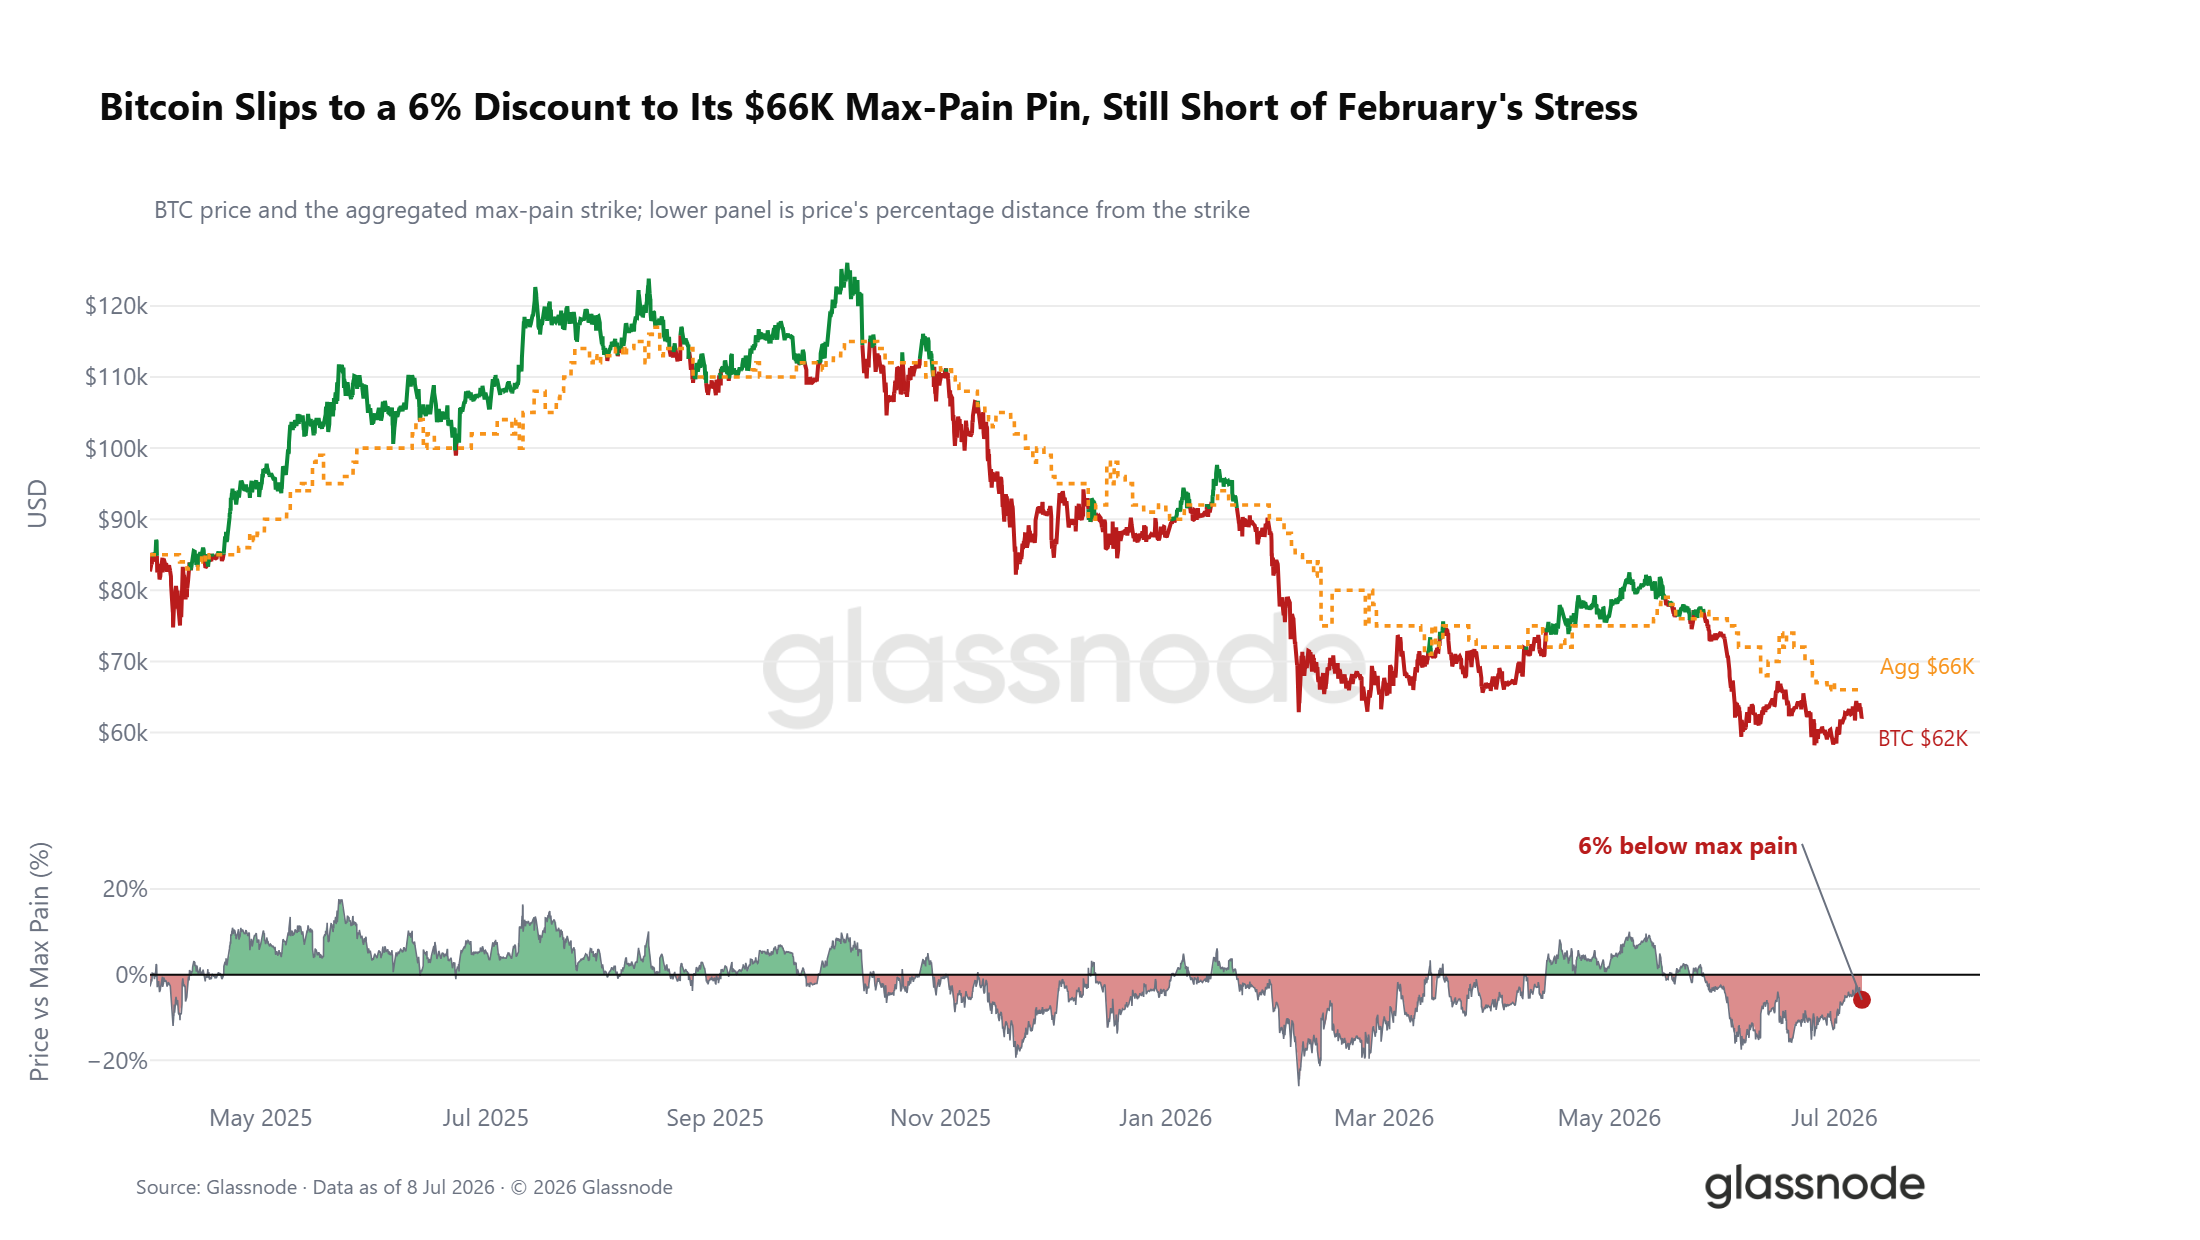
Besides positioning and skew, the relative position of the spot price to the options market structure provides further clues. The current spot Bitcoin price is about 6% below the aggregate market max pain price of $66,000. The max pain price is the strike price where the most open contracts expire worthless, and the price tends to gravitate towards this level near expiration.
This week's decline widened the spread between spot and the max pain price, but the deviation is far less extreme than during the February sell-off, sitting merely in the middle of the 2026 trading range. Throughout the year, the max pain price has acted as a gravitational center for price action, with the spot price oscillating around this level, rarely experiencing prolonged, large deviations. If the price stabilizes around $66,000, the short-term signal turns bullish. If the spread widens further, it would reinforce the overall defensive trading sentiment in the options market.
Cost of Crash Hedging Continues to Decline
While volatility skew and positioning signals diverge, the absolute cost of hedging downside risk is clear. As the market experienced a modest rebound, the pricing of the put side of the 1-month volatility curve has shifted lower. The implied volatility for put options at 5% below the spot price has significantly decreased. The lowest pricing points on the volatility curve are concentrated in far-dated call options.
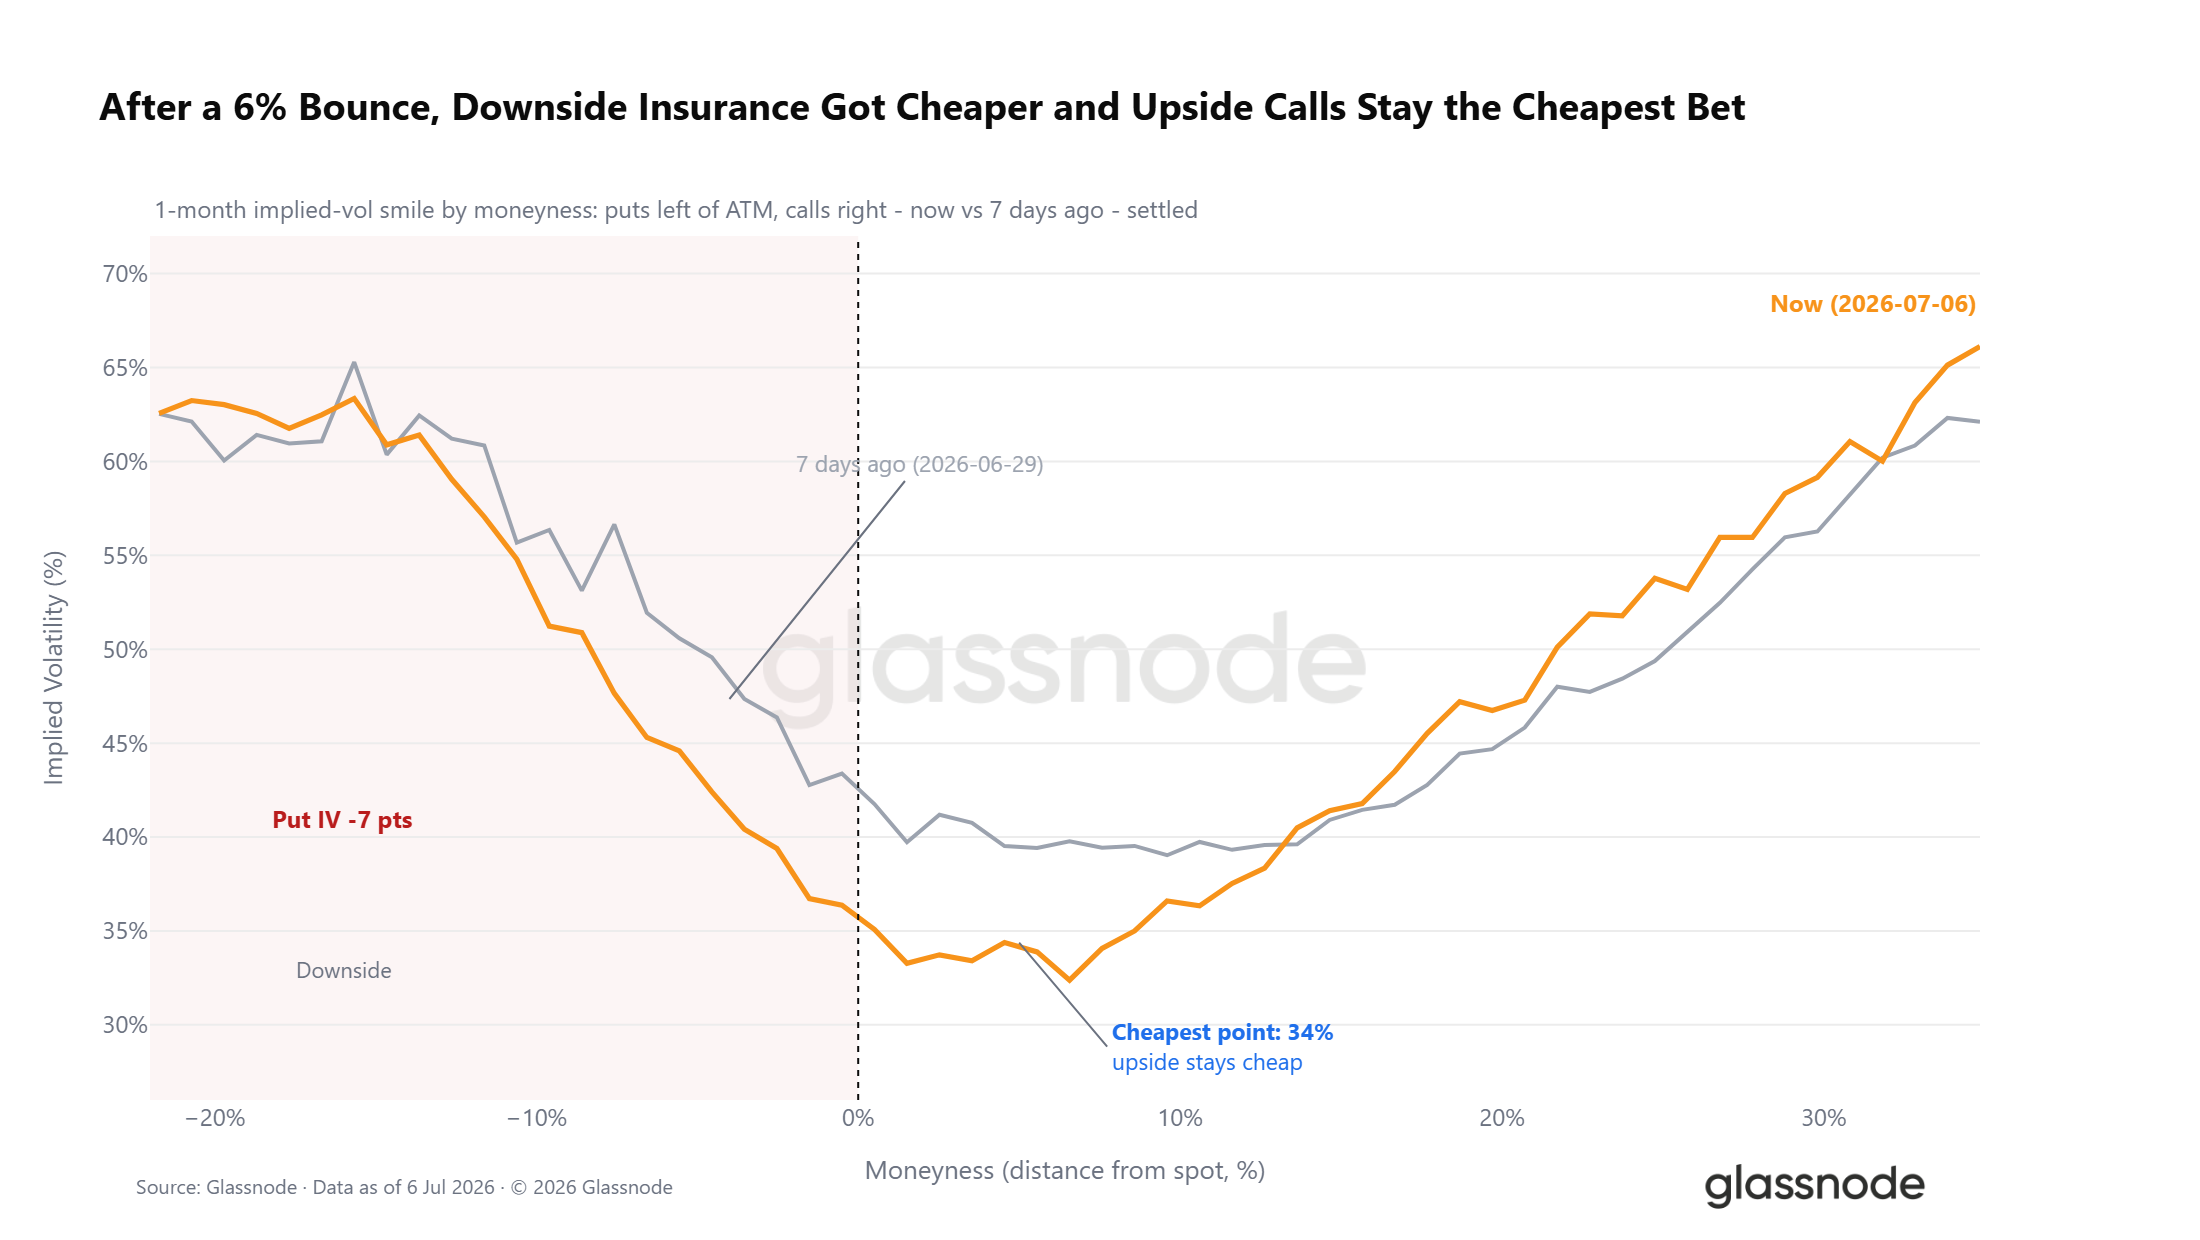
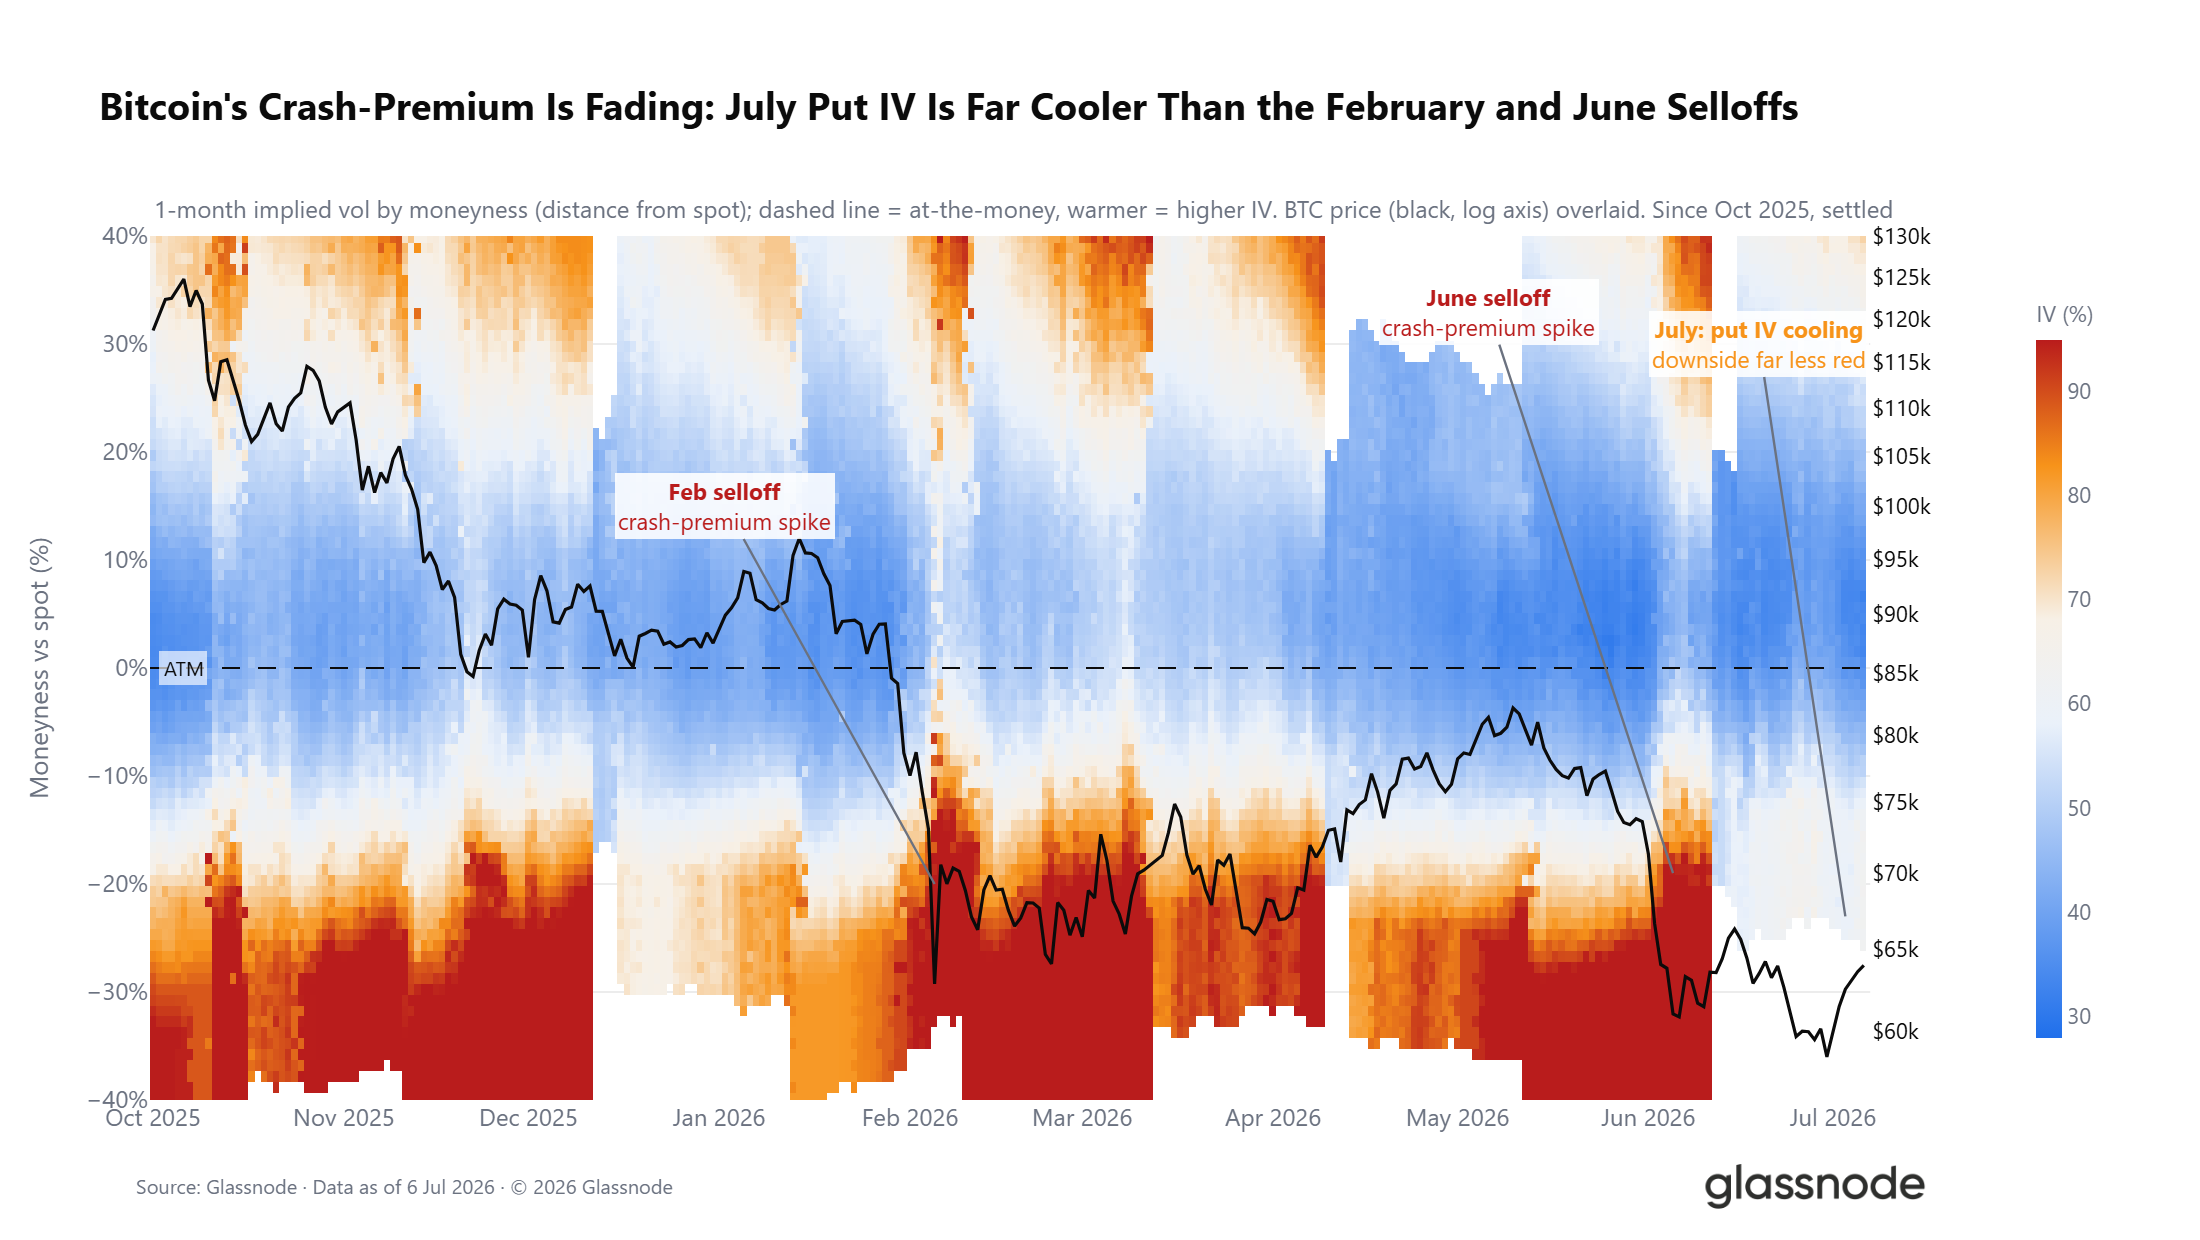
Defensive sentiment still exists in the market, but the absolute cost traders are paying to hedge against declines has notably decreased. This trend is clearer over a longer timeframe: the volatility premium from extreme put-hedging demand during the February and June sell-offs has gradually faded entering July. The DVOL volatility index has dropped to a 12-month low, moving the market into a low volatility regime. While caution still dominates sentiment, hedging demand is abating.
Summary
Synthesizing data from on-chain, off-chain, and derivatives dimensions, the market clearly exhibits characteristics of a late-stage bear market.
On-chain data shows a prolonged five-month deep undervaluation cycle, with daily stop-loss realization by long-term holders reaching $280 million, indicating a massive coin turnover in progress; however, a sustained decline in this stop-loss metric is a necessary prerequisite for an effective trend reversal.
Off-chain data shows that ETF outflows have narrowed from their June peak, but monthly net outflows persist; average daily trading volume is down 80% from its October 2025 peak, reflecting weak institutional bullish conviction.
On the derivatives front, market positioning has shifted to cautiously bullish, with the put/call ratio hitting a yearly low; however, the volatility skew and options surface continue to price in downside risk.
Across all indicators, the foundational conditions required for a market bottom are now fully in place. However, the core signal confirming the bottom has not yet appeared. The subsequent market phase requires three conditions: sustained cooling of stop-loss pressure from long-term holders, stabilization of institutional capital flows, and a definitive reclaim of the realized market price. Only upon meeting these criteria will the probability of a transition to a bull cycle significantly increase.


