
ArkStream Capital 2026年第1四半期報告:地政学的対立と流動性低下の中での暗号資産業界の構造的な淘汰
- コア見解:2026年第1四半期、暗号資産市場は地政学的対立、貿易戦争、タカ派的なFRBの政策という多重の圧力を受け、システム的な売りに直面した。ビットコインは93,000ドルから63,000ドルまで下落し、デジタルゴールドのストーリーは否定され、アルト市場は流動性枯渇に陥り、AI業界の吸収効果が資金の二極化をさらに加速させており、市場の淘汰はまだ終わっていない。
- 主要要素:
- マクロ的圧迫:トランプ関税政策、米イラン軍事衝突、FRBの利下げ期待の崩壊(2回からほぼゼロへ圧縮)が三重のシステム的リスクを構成し、リスク資産全体に圧力をかけ、政策不確実性プレミアムをもたらしている。
- ビットコイン・ナラティブの崩壊:データはビットコインがナスダックと高い連動性を示し、金との相関性は極めて低く、極端なリスクイベントにおいては「安全資産」ではなく「流動性の逃し弁」として機能していることを示している。ETF投資家の含み損は約23%に達し、売りを加速させている。
- アルト市場の構造的縮小:アルトコインはサイクル高値から60%-80%下落し、BTC Dominanceは高止まり(56%-59%)。ETFやDATの資金はすべてBTCに固定され、中小のアルトはイノベーションと資金流入に欠け、価値の回帰と投機の枯渇に陥っている。
- AIの吸収効果:AI業界はすでに経済性主導の段階(APIコストが80%削減)に入っており、その株式セクターの収益率はCrypto+AIトークンを大幅に上回り、資金の継続的な流出を招いている。Crypto+AIのナラティブのほとんどは、まだ投機段階にとどまっている。
- VC投資のジレンマ:プロジェクトのアンロックルールによりVCは「劣後」ポジションとなり、一次投資の損失は拡大し、出口戦略の難易度は上昇している。取引所の上場戦略は囚人のジレンマを悪化させ、中小アルトの空売りが数少ない正の期待値を持つヘッジ手段となっている。

Preface
In the first quarter of 2026, the global financial markets entered the most severe risk repricing cycle since 2022. The escalating geopolitical conflicts, the full-blown return of trade protectionism, and the erratic monetary policy shifts among major economies have collectively created a highly uncertain macro environment with a low preference for liquidity. The crypto market experienced a systemic sell-off during this quarter, with Bitcoin falling from approximately $93,000 at the start of the year to the $63,000 range, a maximum drawdown exceeding 38%. The altcoin market suffered even more, with many tokens losing 60%–80% from their cycle highs.
The deterioration of the market environment was not random but rather the result of multiple overlapping structural pressures. On one hand, the Trump administration's aggressive tariff policies and the US-Iran military conflict pushed geopolitical risks to new heights, putting widespread pressure on risk assets. On the other hand, the crypto market's own narrative fatigue and the fragility of its liquidity structure were fully exposed during the downturn. Bitcoin's "digital gold" narrative failed to deliver its safe-haven function in a wartime environment, instead behaving like a high-beta risk asset. Altcoins, lacking fresh capital inflows and fundamental support, entered a prolonged period of value regression.
At the same time, the rapid evolution of the AI field is profoundly reshaping the intersection of technology and finance. The continuous iteration of large language model capabilities, the explosive growth of open-source AI Agent frameworks, and the initial integration of AI with Crypto payment scenarios offer noteworthy new variables for the medium to long-term development of the industry.
The following analysis will unfold across four dimensions: the macro environment, Bitcoin and capital structure, AI development trends, and the divergence in the altcoin market. We will dissect the core variables of Q1 and provide ArkStream Capital's framework-based judgment on future directions.
Macro Environment: Systemic Pressure from Geopolitical Conflicts and Trade Wars
Accelerated Fragmentation of the Global Trade System
The primary analytical framework for understanding the policy actions of Q1 is the US midterm elections in November 2026. The Republican Party's slim majority in both the Senate and the House faces a serious challenge. Historically, the incumbent party almost inevitably loses seats in midterm elections. Under this pressure, the Trump administration's series of aggressive actions in Q1 – including tough tariffs, the Greenland sovereignty narrative, and military strikes against Iran – essentially serve the same political logic: consolidating the Republican base by projecting a "strong president" narrative through aggressive diplomatic and economic policies in an election year. This means that at least until the November vote, policy unpredictability and aggression are unlikely to cool down substantially, and risk assets will face a political uncertainty premium throughout the year.
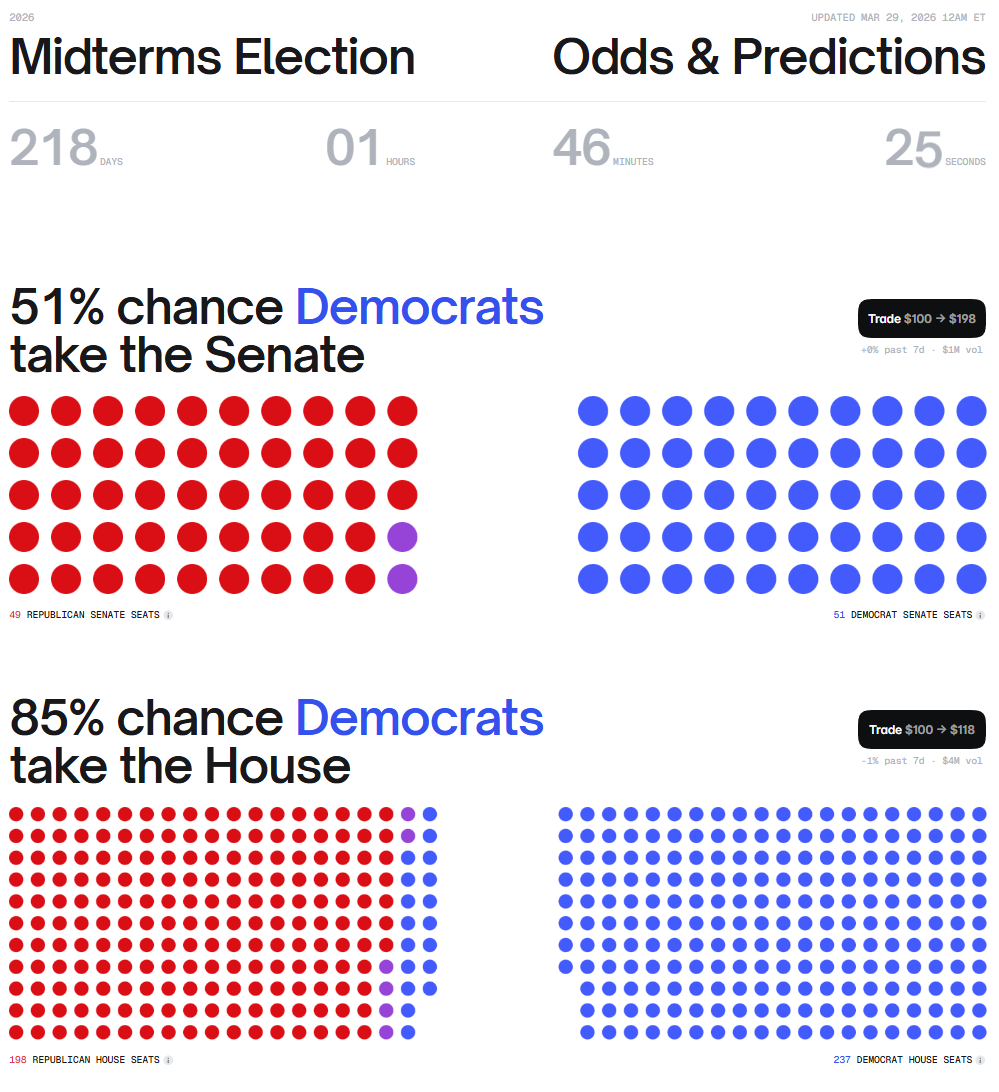
Predicted Seat Distribution for the 2026 US Midterm Elections in the Senate and House
https://polymarket.com/predictions/midterms
Driven by this political logic, the global trade order experienced its most severe shock in Q1 since the establishment of the WTO. In mid-January, the Trump administration announced tiered tariffs of 10%–25% on eight countries – Denmark, Norway, Sweden, France, Germany, the UK, the Netherlands, and Finland – using the Greenland sovereignty dispute as a bargaining chip. By the end of January, a bill imposing 500% punitive tariffs on countries purchasing Russian oil (directly targeting BRICS nations like China, India, and Brazil) gained bipartisan support and entered the voting process. On February 20, after the US Supreme Court struck down the legal basis for tariffs under IEEPA, Trump immediately invoked Section 122 of the Trade Act of 1974 to reimpose a 10% global temporary tariff (effective for 150 days).
The volatility and escalation of tariff policies impact the market from three dimensions: the cost side, where import tariffs directly push up commodity prices and inflation expectations, compressing the Fed's room for rate cuts; the supply chain side, where retaliatory measures by trading partners exacerbate global supply chain uncertainty, dampening corporate capital expenditure intentions; the risk premium side, where the unpredictability of the policies themselves becomes the biggest pricing challenge, systematically raising the implied volatility of various risk assets. ArkStream Capital believes that the latter two effects exert a more significant drag on the market than the tariff rates themselves, and are harder to quantify and for the market to fully price in.
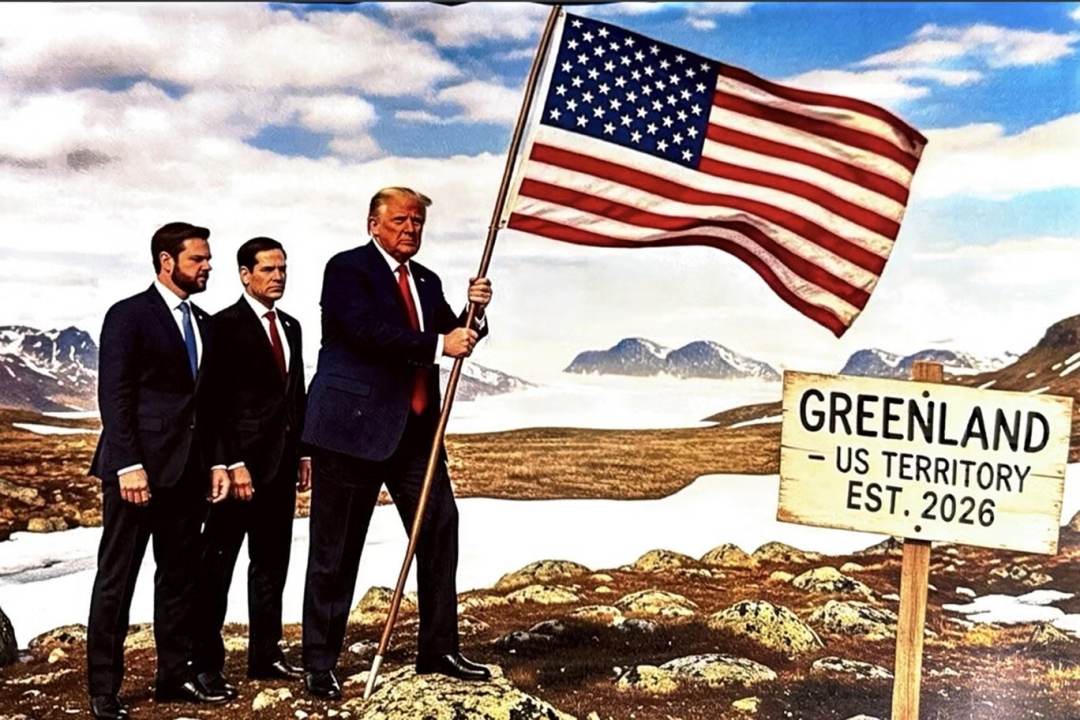
📊 [Chart Placeholder] News screenshots or map related to the Greenland sovereignty dispute
https://truthsocial.com/@realDonaldTrump/posts/115925897257210763
The essential difference between this round of trade conflict and past tariff disputes is that the conflict has expanded from bilateral to multilateral, and the repeated changes in legal basis indicate that policymaking has itself deviated from an institutionalized track, entering a new phase of "instant executive power." The suppressing effect on risk assets far exceeds the direct economic impact of the tariff rates themselves.
Tail Risk from the US-Iran Military Conflict
On February 28, the US and Israel launched coordinated military strikes against Iran. Oil prices jumped within hours, and global financial markets shifted into risk-off mode. With traditional markets closed for the weekend, the crypto market, as the only major asset class trading 24/7, bore the brunt of the safe-haven sell-off. Bitcoin dropped from $65,500 to $63,000 within an hour, and over $515 million in leveraged positions were liquidated.
This event once again verified a fact: Given the current institutional participation structure, crypto assets in extreme risk events play more of a "liquidity relief valve" role than a safe-haven tool. When traditional markets are closed, the crypto market becomes the only operational channel for global capital to release risk. Its price action reflects liquidity structure more than fundamental logic.
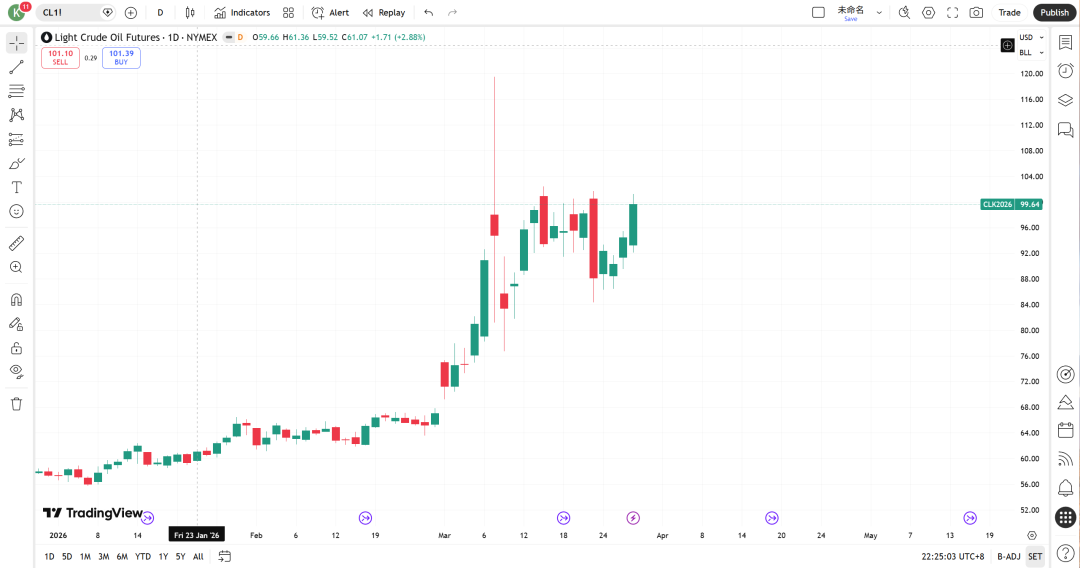
Crude Oil Price Trend in Q1
https://www.tradingview.com/chart/WZsS9J3A/?symbol=NYMEX%3ACL1!
The impact went far beyond the price level. Hours after the strike, the Iranian leadership announced a blockade of the Strait of Hormuz, one of the most critical arteries for global oil transport, through which nearly 20% of the world's seaborne oil trade transits. This super-tail risk added an energy supply shock layer to already high global inflation, directly impacting European and Asian economies heavily reliant on imported photovoltaic energy. Even though a semblance of ceasefire was reached through negotiations days later, the pricing of tail risk has not been fully eliminated. If the conflict escalates again, the market's reaction could be far more severe than the initial shock.
For the crypto market, this shock absorbed two layers of pressure: first, rising oil prices pushed up inflation expectations, further compressing the Fed's room for rate cuts; second, investor anxiety before the market open could only be released through the crypto market. At the same time, Iran's uncertain subsequent situation is a core macro variable for geopolitical risk signals in Q2. If the conflict escalates further under the political logic of the midterm election year, the suppression of risk assets will be more than just a repeat of Q1.
The Federal Reserve: Reversal of the Rate Cut Path and Delay of the Liquidity Inflection Point
Macro-economically, BTC, as a peripheral market in the financial industry, has historically shown a significant correlation with the Fed's interest rate policy.
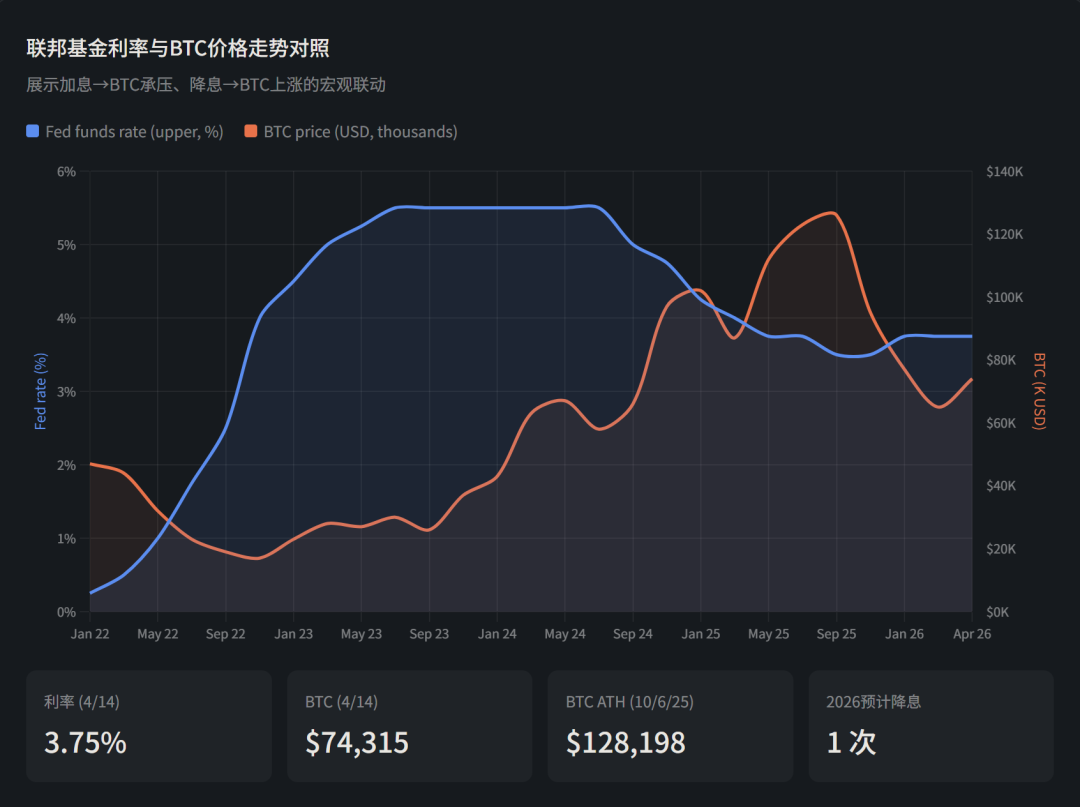
Fed Funds Rate vs. BTC Price (2022–2026)
Since 2022, there have been roughly four distinct cycles.
2022-2023: Hiking Cycle → BTC Under Pressure
The Fed began aggressive rate hikes in early 2022, raising rates from near zero to 5.5%. During the same period, BTC plummeted from ~$47K to ~$16K. High interest rates increased the opportunity cost of holding a non-yielding risk asset like BTC, leading to capital outflows.
H2 2023 - Early 2024: Pause in Hiking → BTC Bottomed and Rebounded
While rates were held in the 5.25%-5.50% range, the market began pricing in rate cut expectations. BTC price recovered from ~$16K to above $60K. Additionally, in January 2024, the SEC approved 11 spot BTC ETFs, marking Bitcoin's official entry into mainstream finance.
September 2024 - October 2025: Easing Cycle → BTC Surged
The Fed made its first rate cut of 50 basis points in September 2024, followed by three consecutive cuts, totaling 100bp for the year. In 2025, three more cuts were completed, for a cumulative reduction of 1.75%. During this period, BTC surged from ~$66K to an all-time high of $128,198.
Late 2025 to Present: Pause in Easing + Geopolitical Conflict → BTC Correction
The Fed held rates steady at 3.50%-3.75% at its January and March 2026 meetings. This was due to rising oil prices pushing up inflation expectations, with PCE and Core PCE forecasts both revised up to 2.7%. Combined with heightened tensions in the Middle East, BTC fell from $126K to its current level of ~$74K.
Current Rate Cut Expectations
Rate cuts lower the opportunity cost of holding BTC and increase market liquidity, historically showing a strong positive correlation with BTC's rise. The Fed's dot plot indicates one rate cut is expected in 2026, which is not good news for BTC's price.
During Q1, the Fed's policy path underwent a gradual hawkish shift. The expectation for rate cuts was progressively compressed from 2 at the start of the year to nearly zero.
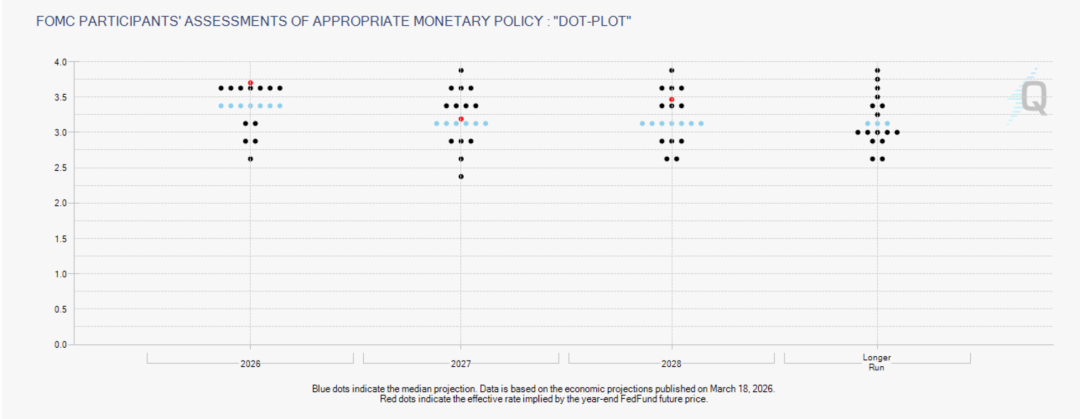
Dot Plot
https://www.cmegroup.com/markets/interest-rates/cme-fedwatch-tool.html
The January 28 FOMC meeting kept the federal funds rate unchanged at 3.5%–3.75%. This was the first pause after three consecutive rate cuts in 2025. Powell reiterated in the post-meeting statement the need for "more data to confirm a sustainable return of inflation," with a cautious but neutral tone. However, the minutes released on February 18 revealed deeper internal divisions than the statement suggested. Several officials explicitly mentioned the possibility of a rate hike scenario, the first such language in the minutes since 2023, causing cracks in market confidence regarding rate cuts.
On January 30, Trump announced the nomination of former Fed Governor Kevin Warsh to succeed Powell as Chair (formal nomination documents were submitted to the Senate on March 4), expected to take office in May. Warsh, who served as a Fed governor from 2006 to 2011, was one of the youngest and most hawkish members of the committee, resigning in protest against QE2. Notably, his public stance has softened in recent years, arguing that AI-driven productivity gains have a structural deflationary effect, thus supporting lower rates. However, his most prominent label remains "shrink the balance sheet first, then cut rates." Warsh has frequently criticized the Fed for maintaining an excessively large balance sheet that blurs the line between monetary and fiscal policy, advocating for significant balance sheet reduction before discussing rate cuts. Even if nominal rates drop slightly, aggressive balance sheet reduction (estimated by some analysts to be equivalent to a ~50bp rate hike per ~$1 trillion reduction) could offset the effect of rate cuts. Market interpretation of his nomination was overall hawkish, with some institutions labeling him "an interesting choice for a president wanting low rates." Following the nomination news, precious metals fell first (gold dropped 1.9% in a week), the dollar strengthened, and the market began repricing what a Fed under such a chair would mean.
Entering February, the situation became more complex. The US-Israel military strike against Iran on February 28 (see Section 1.2) pushed oil prices above $100/barrel, completely altering the inflation landscape. Before the cost-push inflation from tariffs had been digested, a supply-side shock from energy prices was added, creating dual inflationary pressures. This significantly compressed the policy space for rate cuts, and the market began seriously discussing a previously absurd-sounding possibility: the next move might not be a cut, but a hike.
The March 18 FOMC meeting put this into black and white. The committee voted 11:1 to hold rates steady (the January meeting was 10:2, with Miran and Waller dissenting; Waller switched to assent in March, leaving only Miran dissenting – this shift itself is a noteworthy hawkish convergence signal). The post-meeting statement specifically added the phrase that "uncertainty about the impact of developments in the Middle East on the US economy exists," formally incorporating war factors into the Fed's decision-making framework. The updated Summary of Economic Projections (SEP) and dot plot sent clear hawkish signals: the 2026 inflation forecast was raised to 2.7%, the median dot plot maintained one rate cut for the year (consistent with December, with Powell explicitly stating "the median has not changed"), but 14 of the 19 committee members expect only 0–1 rate cuts this year, a clear hawkish shift in distribution. CME FedWatch showed the market compressing its 2026 rate cut expectations from 2 at the start of the year to a maximum of 1, with the probability of zero cuts rising significantly.
The unemployment rate forecast remained at 4.4%, and GDP growth was slightly revised up, presenting an overall picture of growth resilience + inflation stickiness – a stagflationary setup. Bitcoin reacted by dropping from $74,000 to $70,900, with ETFs seeing a net outflow of $129 million that day. Some market analysts pointed out that Warsh's first move after taking office might not be a cut, but a hike.
Looking back at the entire first quarter, the collapse of rate cut expectations was not a single event but a process: from the discussion of rate hikes emerging in the January minutes, to the hawkish personnel expectations brought by Warsh's nomination, to the second inflation shock from the Iran war, to the March dot plot compressing the year's rate cuts to one. The market's initial expectation of two rate cuts at the start of the year was stripped away layer by layer, and the "Higher for Longer" narrative regained dominance. The market previously believed that "the rate inflection point has been established, and the liquidity inflection point is just a matter of time," but the evolution of Q1 provided a more extreme answer. Not only is the liquidity inflection point far off, but the rate inflection point itself faces the risk of being overturned. If Warsh's advocated combination of rate cuts plus quantitative tightening materializes, it means even if nominal rates decline, the actual liquidity environment could become tighter, and the suppressing effect on risk assets should not be underestimated.
Against this macro backdrop, global risk assets came under broad pressure: the S&P 500 is down over 5% year-to-date, with the Nasdaq falling more; Gold ETFs absorbed over $160 billion in inflows; Bitcoin ETFs saw net outflows of $3.8 billion in February alone. The signal of capital migrating from digital gold to physical gold was extremely clear. ArkStream Capital will continue to monitor the evolution of rate cut expectations and the geopolitical situation, as these are core variables for judging the timing of the subsequent liquidity inflection point.
Bitcoin and Capital Structure: Narrative Disproof, ETF Divergence, and Institutionalization Process
Stress Test for Digital Gold
One of the most noteworthy structural changes in Q1 is the significantly increased correlation between Bitcoin and the Nasdaq index during periods of stress. In the market stress test, Bitcoin not only failed to provide a hedging function but exhibited an almost synchronized downward movement with tech stocks.
From a behavioral finance perspective, this is not surprising. Since the approval of ETFs, institutional investors have included Bitcoin within the same risk budget framework as high-growth tech stocks. When macro risk appetite contracts, deleveraging and de-risking behavior is systemic and does not differentiate between asset classes. This surge in correlation marks a new phase in Bitcoin's identity transformation during its institutionalization process: it is evolving from an independent alternative asset to a high-beta subset within global risk asset portfolios.


