BTC Short-Term Bottoming and Accumulation, HYPE Faces Critical Test at Triple Support | Guest Analysis


- Core View: Driven by news flow, Bitcoin last week experienced an extreme "one-day" reversal. The technical structure remains intact, but a bull market confirmation has not yet been completed. The current move is still in the nature of an oversold rebound, and the market has entered a bottoming phase. HYPE was hit by spillover from the U.S. stock market and plunged 15.19% on the weekly chart, but the long-term bullish structure remains intact, and the validity of key support levels still needs to be verified.
- Key Elements:
- On November 4, Bitcoin surged 3.92% on heavy volume to above $80,000, spurred by midterm election news. The next day, a sharp U.S. stock market selloff dragged it down 5.48% on heavy volume, with an intraday low of $75,222, marking a new low since the September 21 correction and pushing the fear index close to 25.
- Bitcoin has closed above its 52-week moving average (around $76,110) for eight consecutive weeks, satisfying the "price breakout principle." However, the moving average is still declining, and a pullback confirmation signal has not yet been triggered. Bull market confirmation requires the moving average slope to flatten and turn upward.
- The daily-wave correction Wave i has been running for 48 trading days since the September 21 high of $87,399, with a maximum decline of 15.9%. The channel structure remains intact, the 0.382 retracement level at $76,130 is still valid, and the support below at $72,610 is stronger.
- The "Shijie Ribbon" quantitative model shows that Bitcoin's bullish structure is still continuing. The mid-term strategy is to stay in cash and wait, while the short-term strategy focuses on buying on dips with a 30% position in the $72,500–$73,500 support zone.
- HYPE closed the week down 15.19%, forming a bearish engulfing pattern. The driver was an external shock rather than a deterioration in fundamentals. The price has pulled back to the confluence support zone where the upper band of the ribbon (around $74.05) meets the lower edge of the box range ($75).
- HYPE has maintained a yellow bullish signal for nearly 240 trading days since it climbed above the ribbon on March 14. The long-term uptrend line at around $68 is the last barrier for bulls. This week, the key focus is whether the $74–$75 area can stop the decline and stabilize.
Last week, the crypto market was driven by news flow.
On November 4, news of the midterm elections ignited market sentiment, and Bitcoin surged 3.92% on heavy volume in a single day, breaking above $80,000 at one point; however, just one day later, a sharp selloff in US stocks triggered a collective retreat in risk assets, and the coin price plunged 5.48% on heavy volume in a single day, hitting an intraday low of around $75,222, the lowest level since the September 21 correction, with the fear index briefly approaching 25. It took only one trading day to go from euphoria to panic.
HYPE was not spared either. Hit by the spillover from the systemic US stock decline, HYPE posted a weekly candle with a 15.19% drop, a large bearish candle that erased all of the previous week's gains, with the price falling back to the $75 mark.
After such violent swings, the question on everyone's mind is: has this "one-day wonder" rally changed the underlying technical structure? How much longer will Bitcoin's correction last? Can HYPE's bullish setup hold?
In this week's review, we will continue to use the "52-week moving average confirmation method," Elliott Wave Theory, moving average systems, Fibonacci retracement, and the "Shijie Ribbon" quantitative model to break down the trend nature, price structure, and this week's trading strategy for Bitcoin and HYPE one by one.
Summary of this week's core trading views:
• Assessment of Bitcoin's current market trend nature (see Part 1 for details)
• Analysis of Bitcoin's daily-level price structure (see Part 2 for details)
• Bitcoin's outlook for this week and medium- and short-term trading strategies (see Part 3 for details)
• Analysis of HYPE's daily-level price structure (see Part 4 for details)
• HYPE's outlook for this week and short-term trading strategies (see Part 5 for details)
1. Assessment of Bitcoin's Current Market Trend Nature
In the two weekly reviews published on August 31 and October 12, we made judgments on the market trend nature at those times based on the three quantitative principles of our in-house "52-week moving average confirmation method." As of now, the market has run for nearly 4 more weeks. What changes have occurred in the price action over these 4 weeks? This article will use the same set of quantitative rules to reassess the current trend nature.
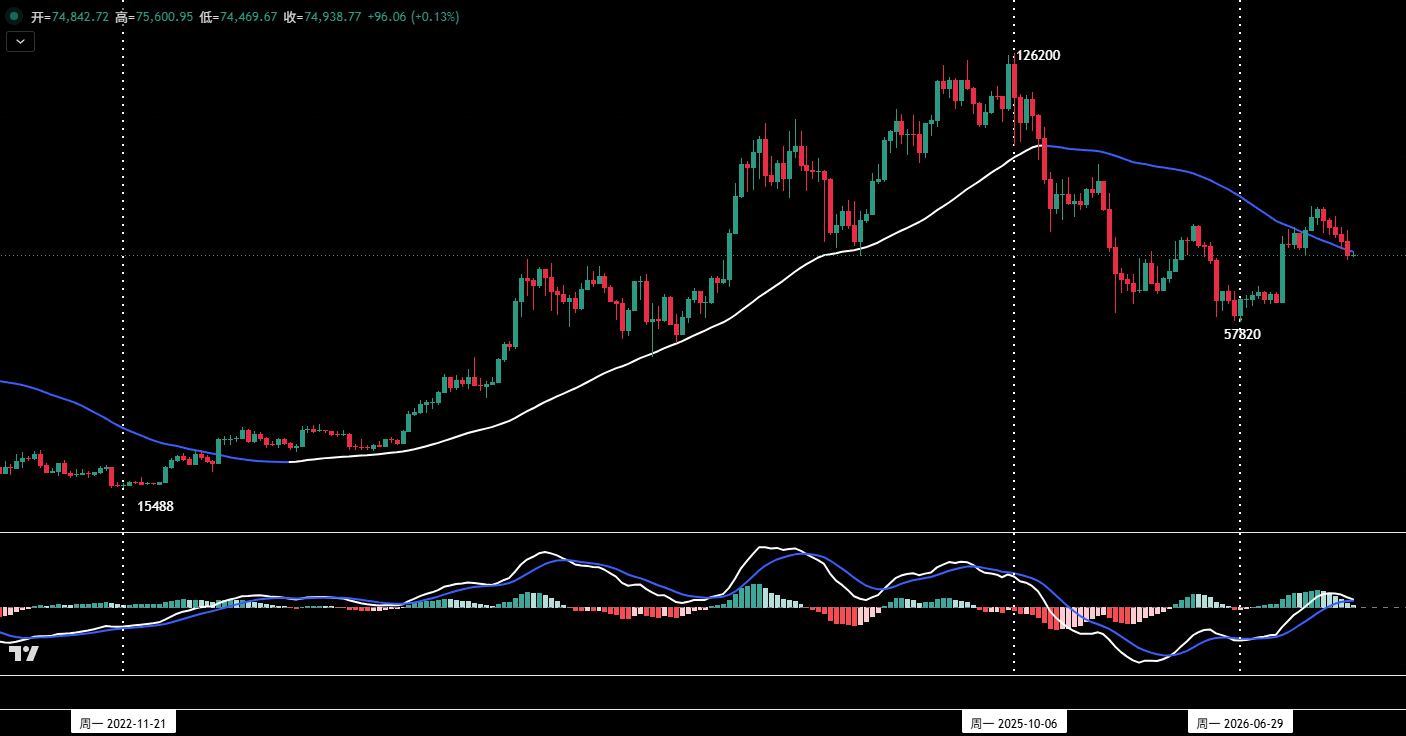
Figure 1: Bitcoin weekly candlestick chart
1. Price action characteristics under the weekly framework (as shown in Figure 1)
①. Price has stood above the 52-week moving average for eight consecutive weeks
Since the weekly close on September 14, the coin price has successfully broken above and stayed above the 52-week moving average (white-blue) for eight consecutive weeks, basically satisfying the "price breakout principle" of the quantitative rules.
②. A stage high has formed, and the pullback confirmation has been running for five weeks
The coin price hit a stage high of $87,399 on September 21 and recorded a weekly closing stage high of $86,515 on September 28. Since then, the price has continued to decline from the high, running a pullback confirmation move that has now lasted five weeks.
③. The 52-week moving average is still declining, and the price has pulled back to near the moving average.
The 52-week moving average is currently at about $76,110 and is still pointing down. Last week's closing price was about $74,900, closing near the 52-week moving average.
2. In summary, based on current market performance, we draw the following four conclusions:
①. The "price breakout principle" has been satisfied, and the bull-bear transition has begun.
Current market performance has satisfied the "price breakout principle" in the quantitative rules and is in the transition phase from "bear market" to "bull market." It must be emphasized that transition does not equal confirmation. Whether the transition can truly be completed depends on whether the following two conditions are met.
②. The pullback has not yet issued a successful confirmation signal
As of last week's close, although the coin price has pulled back to near the 52-week moving average, the pullback confirmation signal has not yet been issued.
③. The 52-week moving average has not yet flattened
The 52-week moving average is currently still in a declining phase and has not yet entered the "flattening phase" required by the quantitative rules.
④. Conclusion: This rebound is still an oversold rebound
The current rebound, which started from the July 1 low of $57,820, should still be defined as an oversold rebound as of now and is not yet sufficient to confirm that a bull market has begun.
3. What to watch going forward: how will the two hurdles be verified?
①. Observe whether the price can find support near the 52-week moving average (currently about $76,110) and stabilize for an upward move. This is the most critical issue in the short term.
②. Observe changes in the slope of the 52-week moving average and when it shifts from declining to flattening and then to rising. This is the ultimate key to bull market confirmation.
Appendix: The three quantitative principles of the "52-week moving average confirmation method."
First, the price breakout principle (bear to bull): The weekly closing price breaks above the 52-week moving average and stands above it for 2-3 consecutive weeks; if it only pierces through for a single week and then falls back, it is regarded as a false breakout.
Second, the pullback confirmation principle: After the coin price has continued to run above the 52-week moving average for a period of time (usually more than 5 weeks), a pullback confirmation move should preferably occur to further enhance the有效性 of the breakout.
Third, the bull market confirmation principle: The price continues to run above the 52-week moving average, and the slope of the moving average turns upward.
2. Analysis of Bitcoin's Daily-Level Price Structure
Last week the market was dominated by news flow, with extreme reversals on two consecutive trading days. On November 4, midterm election news spurred the coin price to surge 3.92% on heavy volume, with an amplitude of 7.1%, breaking above $80,000 that day; just one day later, a sharp US stock selloff dragged the coin price down 5.48% on heavy volume, with an amplitude of about 7.01%, hitting an intraday low of about $75,222, the lowest since the September 21 correction, with the fear index briefly approaching 25.
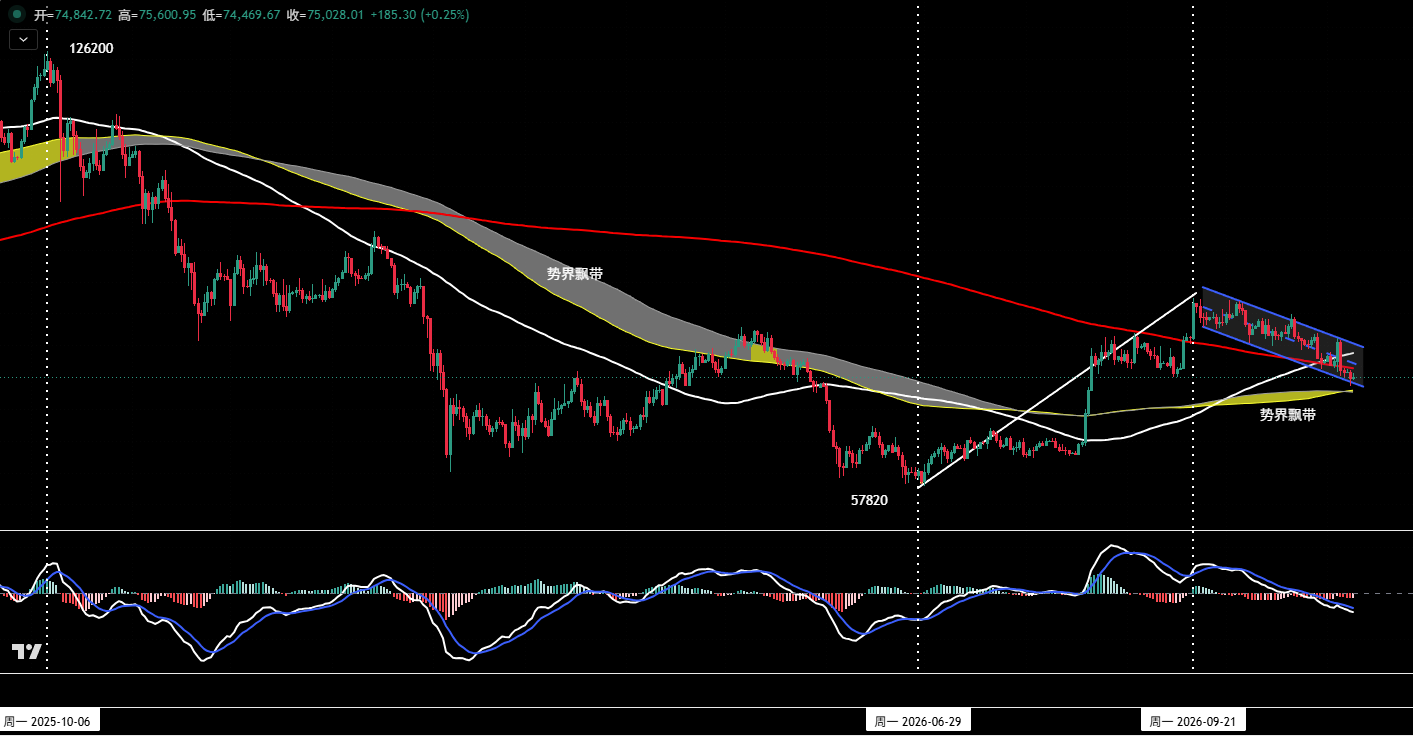
Figure 2: Bitcoin daily candlestick chart
1. Review: last issue's judgment has been validated
In last week's review we put forward a clear conclusion: the correction that began on September 21 has entered the bottom zone, a second bottom may appear after a short-term rebound, and even if the recent low (about $76,265) is broken, it is still a high-probability event that the daily-level Wave i correction ends near $75,000, so there is no need to panic at that level. Actual price action confirmed this. Although news disturbances caused the coin price to pierce the $75,000 support, last week the coin price still closed near $75,000, indicating that buying support at that level is strong.
2. Structure: four signals to assess the current price action (as shown in Figure 2)
①. The channel has not been broken
The coin price is still running along the original descending channel. The lower rail of the channel is formed by connecting the two lows of September 24 and October 8, and the upper rail is a parallel line based on the October 5 high. After last week's violent swings, the price still remains within the channel. No deviation from the short-term trend has been seen.
②. The price crossover point has been lost
The coin price has broken below the support at the crossover point (about $77,200) formed by two important moving averages (white line, red line), but the price is still hugging the red moving average and has not yet completed its "escape" from the pull of that average.
③. The 0.382 retracement level is still valid
Based on the previous five-wave advance, the three Fibonacci retracement levels for this correction are: $76,130 (0.382), $72,610 (0.5), and $69,120 (0.618). The coin price has not yet effectively broken below $76,130, and the second support below ($72,610) is stronger.
④. The market has entered a bottom-grinding phase, and a rebound could start at any time
As long as no new external negative news appears this week, the coin price is expected to digest the November 5 selling pressure through range-bound action and gradually enter a bottom-grinding phase, during which a "single-needle bottom" move cannot be ruled out. This correction has lasted 48 trading days, and both the time and space dimensions are basically in place. External news will only affect the market's rhythm, not its direction, and the market will eventually return to its own operating laws. The Wave ii rebound may be late, but it will not be absent.
3. The correction under the three-wave framework
①. Wave i (correction wave): from September 21 to now
• Starting point: $87,399
• Has run 48 trading days (still ongoing)
• Maximum decline within the range: 15.9%
②. The daily-level Wave i correction has not ended
Since the correction began, no matter how news disturbed the market, the coin price has never broken above the upper rail of the channel to produce a rebound repair move. This shows that the current correction structure has never been broken, Wave i has not ended, and the Wave ii rebound has not yet begun.
③. Projection of subsequent price action
After Wave i is completed, the market is expected to see a Wave ii rebound, followed possibly by a Wave iii pullback, completing the final bottoming process.
4. Shijie Ribbon: long-short quantitative model
As shown in Figure 2, we backtested nearly nine years of historical market data and built a long-short quantitative model based on probability statistics, namely the "Shijie Ribbon" (the yellow-gray channel in the chart). The model's judgment rules are as follows: when the price effectively stands above the ribbon and the ribbon turns yellow, it is judged to be a long market, and operations should mainly focus on buying on dips. When the ribbon turns gray, it is judged to be a short market, and operations should mainly focus on selling on rallies. The current signal shows that the bullish setup is still continuing.
3. Bitcoin's Outlook for This Week and Trading Strategy
1. BTC price outlook for this week
Core view for this week: focus on the battle between bulls and bears over the "Shijie Ribbon."
2. Core resistance levels
• First resistance zone: $76,500–$78,500 area (previous important level)
• Second resistance zone: around $82,000 (previous important level)
• Third resistance zone: $85,000–$87,500 area (previous important level)
3. Core support levels
• First support level: $72,500–$73,500 area (previous important support level)
• Second support level: $69,100–$70,000 area (previous important support level)
4. This week's trading strategy (excluding the impact of sudden news)
①. Medium-term strategy: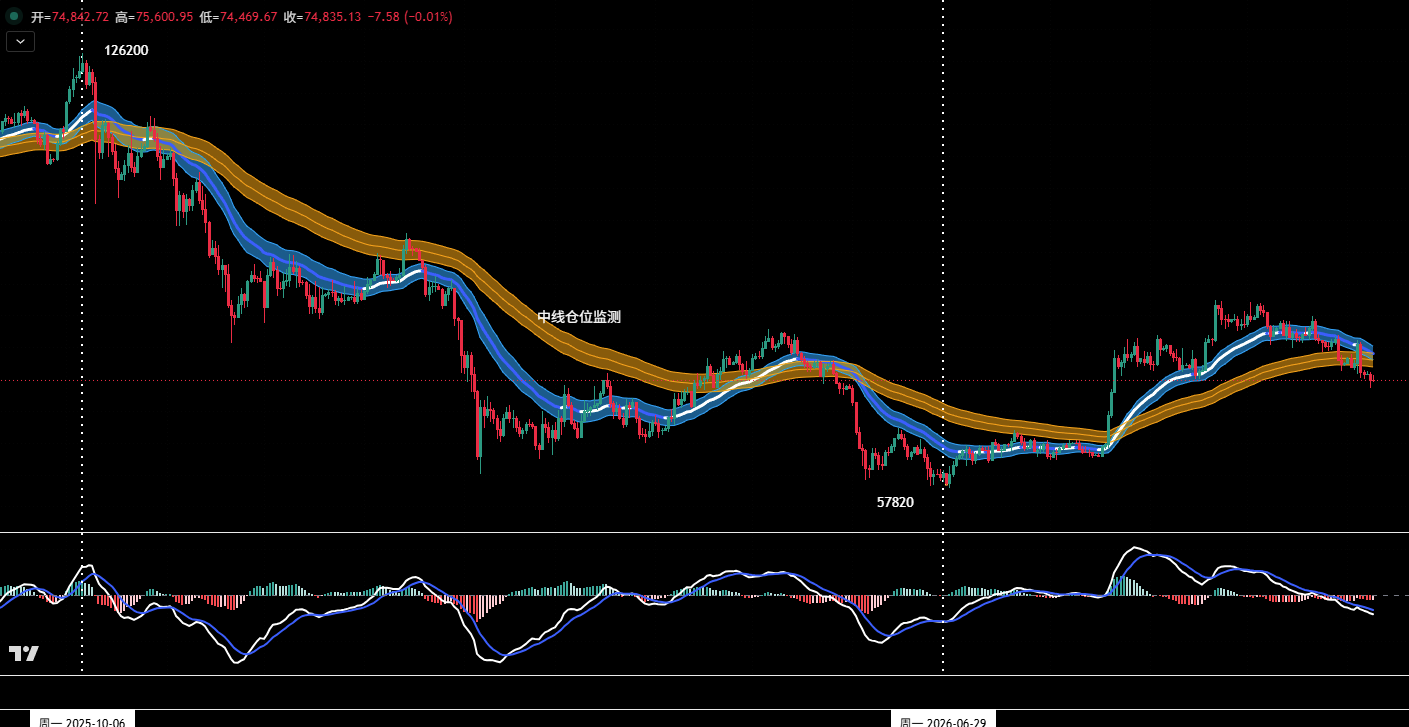
Figure 3: Bitcoin _ daily candlestick chart: (position monitoring model)
Medium-term: stay in cash and observe
As shown in Figure 3, after last week's price action, the coin price has broken below the "position monitoring channel" but has not yet completed an effective retest confirmation. Before the signal is confirmed, the medium-term strategy should mainly be to stay in cash and observe, with no directional entry for the time being.
②. Short-term strategy: use 30% of position, set stop-loss points, and look for "price spread" opportunities based on support and resistance levels. (Use 30-minute/60-minute as the operating timeframe).
③. In short-term operations, combined with the current price structure analysis, this week's strategy should mainly be "buying on dips." We have prepared a set of operational plans in advance.
• Try small long positions in strong support zones.
• Entry: if the price adjusts to the $72,500–$73,500 area and shows a clear stabilization pattern, and the quantitative model simultaneously issues a bottom signal, a small long position can be established, with position size controlled within 30%.
• Risk control: set an initial stop-loss.
• Exit: when the price rebounds to near important resistance levels and combined with model signals, positions can be closed in batches to take profits.
4. Analysis of HYPE's Daily-Level Price Structure
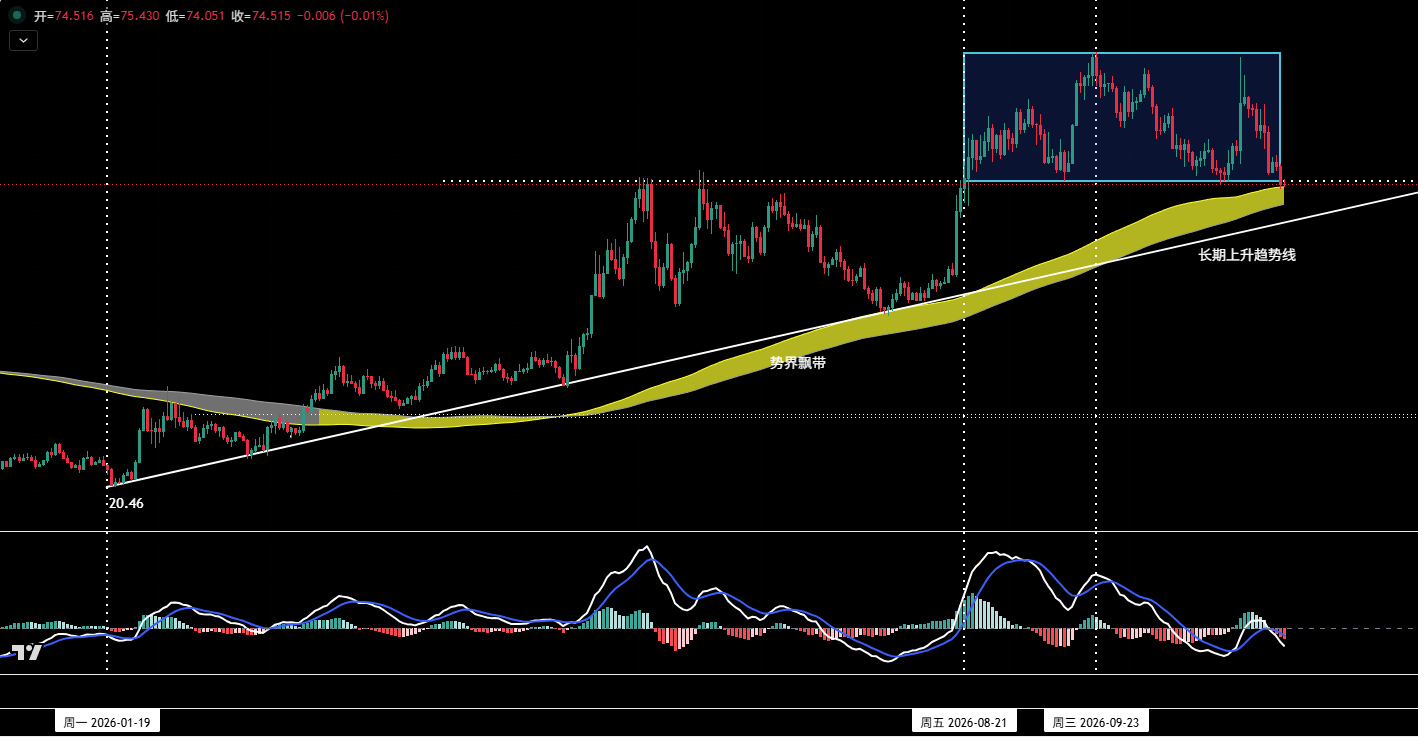
Figure 4: HYPE daily candlestick chart
1. Last week's price action: a structural pullback under external shock
Last week, HYPE could not remain unscathed. Hit by the spillover from the systemic US stock selloff, the price saw a significant pullback, with the weekly candle posting a 15.19% drop and closing near $74.5 (that is, around the $75 mark). Its body completely covered the previous week's 15.16% bullish candle, forming a typical "bearish engulfing" pattern. It should be noted that the driver of this decline was external rather than a deterioration in HYPE's own fundamentals, which provides a basis for judging the "validity of support levels" going forward. If support holds, it is a repair after an unjustified selloff; if support fails, the quality of the original trend needs to be reassessed.
2. Three-line support system: from trend direction to the bulls' lifeline
①. Shijie Ribbon: the condition for determining trend direction
Since HYPE's price successfully stood above the Shijie Ribbon on March 14, the ribbon has remained yellow for nearly 240 trading days, indicating that the market has been in a long market for a long time and the overall direction has not been broken. During this period, there were multiple adjustments and pullbacks to the ribbon, but all found support near the ribbon and restarted their uptrend.
The current upper rail of the ribbon is about $74.05 and the lower rail is about $71, with the overall slope still upward. The price has now fallen back to near the upper rail of the ribbon. If it stabilizes here, the bullish trend will continue; if it effectively breaks below and the ribbon turns gray, the market may undergo a long-short shift.
②. Lower edge of the box: the medium- and short-term long-short divide
After the price broke above the previous high of $76 on heavy volume on August 21, it entered a wide box range; the upper edge is about $98 and the lower edge is about $75.
It is worth noting that on October 24 the price pulled back to the lower edge of the box and triggered a 20% rebound, proving that the lower rail has strong buying support.
③. Long-term uptrend line: the bulls' last barrier
Since the rally started from the January 21 low of $20.14, HYPE has been running along a long-term uptrend line. This line is formed by connecting the starting point with multiple important stage lows and is the "bottom line" of the bullish trend; it is currently around $68.
5. HYPE's Outlook for This Week and Short-Term Trading Strategy
1. HYPE price outlook for this week
①