






Today's S&P 500: A Historic High, the Bottom of a Bull Market


- Core View: Despite macroeconomic headwinds from soaring oil prices, Federal Reserve rate hikes, and persistently high inflation, the S&P 500 remains near its all-time high, presenting a historic paradox of a "bear market within a bull market," while market concentration and discounted tech valuations actually constitute a major opportunity.
- Key Points:
- Since the outbreak of the Iran war 229 days ago, the S&P 500 has risen 900 points, rebounding nearly 1,500 points from its bottom on March 30, adding $14 trillion in market capitalization.
- Market rate expectations have undergone a dramatic 175-basis-point shift, with the Fed having already raised rates once and expected to continue, yet the index has remained resilient.
- 84% of constituent stocks are down at least 10% from their all-time highs, with 41% falling more than 30%, and 70% of the index's gains contributed by just 10 stocks.
- S&P 500 composite earnings growth reached 52% in Q2 2026, the highest since 2021 and comparable to the period of $4 trillion in stimulus.
- Nvidia's stock price rose 21% but its price-to-earnings ratio fell 46%, with a forward P/E of about 24x, roughly in line with the S&P 500's overall 22x.
- U.S. CPI inflation has remained above the 2% target for 67 consecutive months, and the dollar's purchasing power has shrunk 22.5% since 2021, driving investors to increase holdings of stocks and physical assets.
- If the Iran conflict ends and the energy crisis eases, it would trigger a chain reaction of falling oil prices, declining inflation expectations, a dovish shift by the Fed, and the elimination of tech stock discounts.
Original article from The Kobeissi Letter
Compiled by / Odaily Golem(@web 3_golem)
The Kobeissi Letter receives thousands of questions every week, but one question has come up most frequently lately: With oil prices above $100/barrel, borrowing costs back at 2002 levels, and inflation nearly double the Fed's 2% target, why is the S&P 500 still only about 2% away from its all-time high?
What would you think if we told you that the S&P 500 could be near an all-time high while still being at a "bottom"? But that is exactly the case, and The Kobeissi Letter believes this is one of the most important opportunities in today's market.
We are witnessing a historic market paradox: a market condition where "bull and bear coexist." The following will explain this in detail.
Iran War — Day 229

S&P 500 since February 28
Today is Day 229 since the Iran war broke out. Since the war began, the S&P 500 has risen 900 points. Since hitting a low on March 30, the index has risen nearly 1,500 points, adding $14 trillion in market value.
Compared with 229 days ago, the world today has changed dramatically. Inflation has nearly doubled, the Fed is raising rates, we are deep in the worst energy crisis in world history, and at the same time we are also in the midst of the largest technological revolution in world history.
Yet if you ask most investors, they would generally say that the market's fundamentals have deteriorated compared with eight months ago.
Macroeconomics — A Historic Shift in Expectations
In early 2026, the market expected the Fed to cut rates at least three times this year, for a total of 75 basis points. This had been a core element supporting the bullish case for stocks, with investors expecting lower capital costs, increased investment activity, and tech companies posting record-high capital expenditures (CapEx).
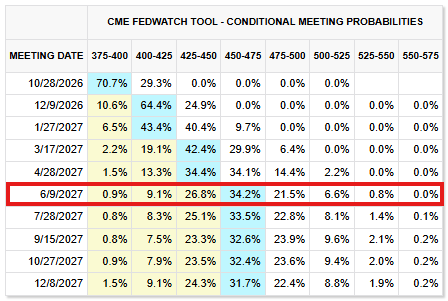
Fed rate expectations (October 15, 2026)
So far this year, the Fed has raised rates once, and the market expects three more hikes by June 2027. Including the September hike, the total increase would reach 100 basis points. This means rate expectations have undergone a dramatic 175-basis-point shift. Yet the S&P 500 remains at an all-time high.

Brent crude, 10-year Treasury yield, diesel
What drove this shift was a historic surge in oil prices. Diesel prices have risen more than 80% from their January 2026 lows, while Brent crude has reached $106 per barrel. With inflation doubling, the Fed continuing to raise rates, and the U.S. fiscal deficit approaching $2 trillion, borrowing costs have soared. Even so, the S&P 500 remains at an all-time high.
So why exactly is that?
Most S&P 500 Constituents Are Performing Poorly
Although the S&P 500 is at a new high, the vast majority of its constituents are trading far below their all-time highs.
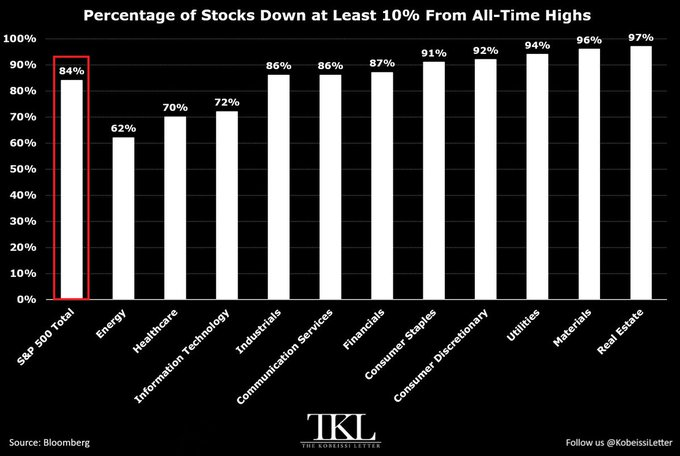
Share of S&P 500 stocks down 10% or more
As shown in the chart above, 84% of S&P 500 stocks are currently at least 10% below their all-time highs.
Real estate leads the decline, with 97% of stocks down at least 10%, followed by materials (96%), utilities (94%), and consumer discretionary (92%). In addition, 59% of S&P 500 constituents are at least 20% below their respective highs, 41% are down more than 30%, and 17% are down more than 50%.
Below is the contribution to returns since the S&P 500 bottomed on March 30.
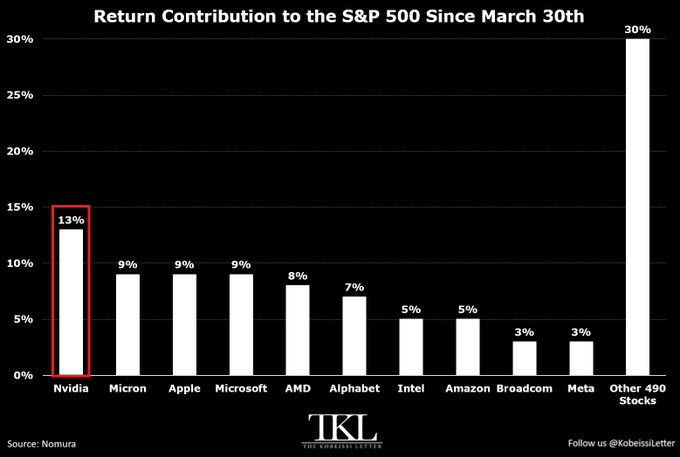
S&P 500 return contribution (since the March 30 bottom)
Since March 30, 70% of the S&P 500's gain has come from just 10 stocks. During this period, the S&P 500 rose 23% in total, and those 10 stocks contributed 16 percentage points of that. Among them, Nvidia (NVDA) contributed the most, accounting for 13% of the S&P 500's gain, or 3 percentage points.
Then came Micron (MU), Apple (AAPL), and Microsoft (MSFT), each contributing 9% of the S&P 500's gain, or 2 percentage points each. AMD (AMD) and Alphabet (GOOGL) accounted for 8% and 7% of return contribution, respectively.
At the same time, the other 490 stocks accounted for only 30% of the S&P 500's gain since March 30, contributing 7 percentage points.
Therefore, the "majority" of S&P 500 constituents are in fact in a bear market, and in our view, this is actually a positive for the S&P 500. We will explain why below.
The S&P 500 Should Be Above 9,000
Were it not for the impact of the Iran war, the S&P 500 could have reached above 9,000.
This may be the most resilient asset in history. Despite inflation near 4%, rising gasoline prices, and the Fed raising rates, the S&P 500 is only 2% from its all-time high. Imagine how high the S&P 500 could go if the Iran war ended, oil prices fell back, and the Fed returned to a rate-cutting path.
Over the past seven months while the Iran war has continued, corporate earnings growth has been unprecedented. In the second quarter of 2026, the S&P 500's blended earnings growth rate reached 52%.
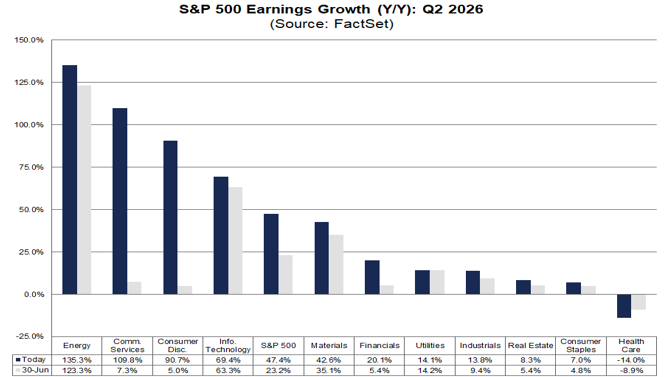
S&P 500 earnings growth (Q2 2026)
This is the highest growth rate since the second quarter of 2021. At that time, the global economy was recovering from historic lockdowns, and the U.S. government had rolled out a $4 trillion stimulus package.
In other words, against the backdrop of a global energy crisis and a Fed rate-hiking cycle, the level of growth we are seeing is actually comparable to the growth brought by that $4 trillion-plus stimulus package and by the global economy restarting after a near-standstill.
The fact is that the outlook for AI is stronger than most people realize, and although inflation has remained above 2% for 67 consecutive months, corporate earnings growth is enough to support this bright outlook.
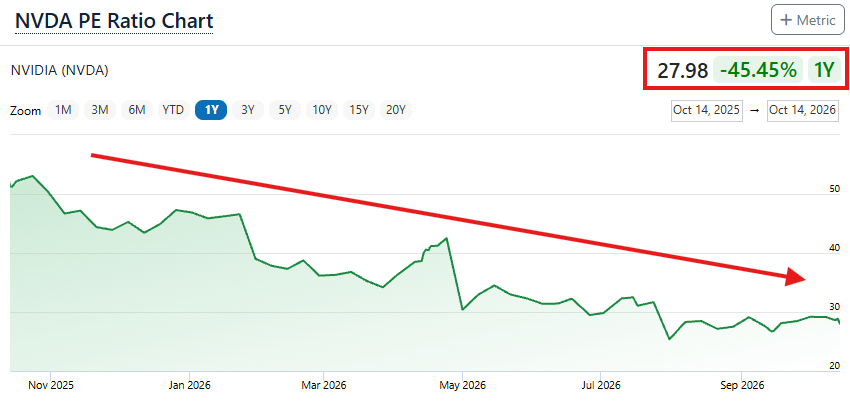
Nvidia P/E ratio
Take Nvidia's trailing 12-month P/E ratio, for example. Although its stock price rose 21% during this period, the company's P/E ratio actually fell 46%. Currently, Nvidia's forward P/E is about 24x, roughly in line with the S&P 500's 22x, but consider that Nvidia's stock has gained 900% over the past five years.
The same is true for many large-cap tech stocks, and it is precisely these stocks that are holding up the entire market.
As shown in the chart below, the forward P/E ratios of the S&P 500 and the S&P 500 Information Technology sector are now almost identical. Historically, these stocks have usually traded at valuations above the S&P 500 overall.

Forward P/E of the S&P 500 and S&P 500 Information Technology sector
In The Kobeissi Letter's view, the large-cap tech stocks driving the market higher, despite trading at or near all-time highs, actually already embody a considerable discount in their valuations. We believe that without the macroeconomic factors of the past seven months, these stocks would be trading much higher.
Add to that the fact that more than 80% of S&P 500 constituents are down more than 10% from their all-time highs, and the case becomes even stronger. Once market breadth—that is, the number of stocks participating in the rally—improves even slightly, buying pressure will increase rapidly. Moreover, even without such a shift, the large-cap tech stocks that have dominated most of the price action also appear relatively "cheap" compared with the S&P 500 overall.
This is why we believe that, for the S&P 500, market concentration is actually a positive and, at least at this stage, does not pose a problem.
The March 30 Bottom Was a "Gift" to Investors
Earlier, when the S&P 500 fell below 6,400, The Kobeissi Letter issued a strong buy signal for the index and for the stock market as a whole. In an article at the time, The Kobeissi Letter pointed out that the bond market was one of the core bullish reasons, and that the selloff in tech stocks, which had dragged down the broader market, also seemed irrational.
Subsequently, the S&P 500 staged a "V-shaped" rebound. The Kobeissi Letter continued to raise its target for the S&P 500 to 7,800 and predicted that the Trump administration would intervene in the bond market.
Now, the Trump administration is indeed trying to intervene in the bond market (though it has not yet worked), and further intervention measures are inevitable. Ultimately, The Kobeissi Letter's bullish view on the S&P 500 today was already formed on March 30, and as we look ahead to 2027, that view is becoming increasingly validated.
Investors Are Seeking More Asset Allocation
In addition to the "discount" factor already present in the stock market mentioned above, investors are more inclined to hold a variety of assets in the face of persistent inflation in the United States.
U.S. CPI inflation has been above the Fed's 2% target for 67 consecutive months. The last time U.S. inflation was below 2% was January 2021, when the global economy was in lockdown.
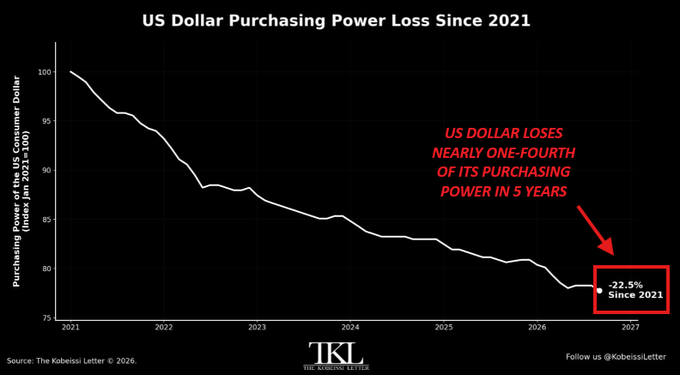
Purchasing power of the U.S. dollar since 2021
During this period, the value of the U.S. dollar has shrunk by 22.5%. In other words, goods and services that cost $100 in 2021 now require $129. Therefore, over the long term, investors not only will not reduce but are more likely to increase their holdings of stocks and real assets.
As a result, if signs emerge that the Iran conflict is ending and the global energy crisis is easing, it will trigger a chain reaction that pushes the market into a bull run.
Energy prices would fall, inflation expectations would retreat, the Fed's monetary policy stance could turn more "dovish," the "discount" factor in tech stocks would be eliminated, and the breadth of the market rally would further expand. At the same time, the AI revolution is still accelerating, and many large-cap tech stocks, despite rising share prices, have become more attractive—that is, "cheaper"—on expected earnings valuations.
In addition, from a macro perspective, demand for asset ownership is also at a historic high.
We Are at a Bottom Within a Bull Market
In summary, we believe the S&P 500 is in a "bear market within a bull market."
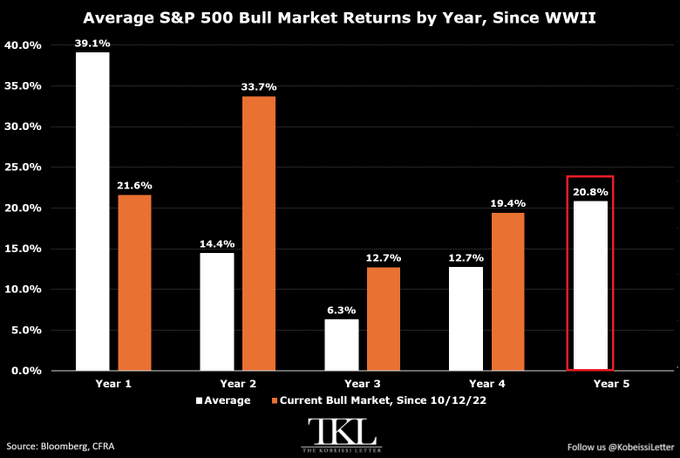
S&P 500 bull market enters its fifth year
Although the S&P 500 bull market has now lasted into its fifth year, The Kobeissi Letter believes there is still significant "discount" room in the current stock market. This discount phenomenon is like an "invisible" bear market, suppressing the equity valuations of the world's largest and fastest-growing companies.
Against this backdrop, once conditions are ripe, the S&P 500 is highly likely to see a sharp rally, and 2027 will be a year full of major variables.





