






Financial Results Beat Expectations, So Why Did the Stock Still Fall?


- Core Thesis: During U.S. earnings season, stock price reactions depend on the gap between results and market expectations, not on whether the absolute numbers are good or bad. Using SpaceX, SanDisk, and Google as three case studies, the article argues that reading earnings reports requires attention to growth sources, sustainability, and expectation gaps. It concludes with a six-question methodology to help investors identify growth quality and potential risks.
- Key Elements:
- SpaceX's Q2 revenue grew 92% year-over-year, but capital expenditures reached $18.369 billion ($15.828 billion related to AI). The stock fell 13.61% after earnings, highlighting the need to focus on cash flow and capital consumption.
- SanDisk's revenue grew 51% quarter-over-quarter with a gross margin of 84.6%, but two-thirds of that growth came from price increases. The stock fell 6.81%, serving as a warning that cyclical stocks require distinguishing between the sustainability of "volume" growth versus "price" growth.
- Google's parent company saw revenue grow 24% year-over-year and EPS surge 294% year-over-year. However, approximately $97.983 billion of that was non-operating income such as unrealized gains from stock holdings, and capital expenditure guidance was raised to $195-205 billion. The stock fell 7.13%.
- Core methodology: After reviewing revenue and EPS, investors must examine capital expenditures, operating cash flow, and free cash flow to determine whether expansion relies on "burning cash."
- For cyclical stocks, it is essential to break down the contributions of sales volume versus price to revenue growth, and to track forward-looking indicators such as inventory, supply recovery, and customer structure.
- Compare the growth rate differences between operating profit and net profit to screen for one-time gains (such as investment income or asset sales), assess EPS quality, and evaluate the true trend of core business profitability.
Author: Alan | Biteye Content Team
Every earnings season on Wall Street, headlines look strikingly similar:
Revenue beats expectations, EPS beats expectations, management raises guidance
But the stock market's verdict is often completely different.
In the Q2 2026 earnings season, SpaceX (SPCX) reported 92% year-over-year revenue growth and narrowing losses, yet its stock plunged 13.6%. SanDisk (SNDK) saw revenue grow 51% quarter-over-quarter with non-GAAP gross margin reaching 84.6%, but its stock fell 6.81%. Alphabet, Google's parent company, delivered 24% year-over-year revenue growth and 294% year-over-year EPS growth, yet its stock closed down 7.13%.
Three pieces of "good news," yet three completely different market reactions. Why?
Because the stock market never trades on performance alone — it trades on how that performance changes the market's expectations.
For those just starting to read U.S. earnings reports, the most common mistake is:
The bigger the numbers, the better the company, and the more the stock should rise.
In reality, a single earnings report needs to answer at least three questions:
Where does the growth come from? Can it be sustained? How much of this information has already been priced in by the stock market?
These three questions can be perfectly understood through the cases of SPCX, SanDisk, and Google ⬇️
1. SPCX, SanDisk, Google: Three Lessons from U.S. Earnings Season
1. SPCX — Look at Revenue, But Also Costs
The first quarterly earnings report since Musk's SpaceX went public — despite its previous decline — looked quite impressive:
- Q2 revenue of $7.814 billion, up 92% year-over-year;
- Net loss narrowed from $1.008 billion in the same period last year to $541 million;
- Adjusted EBITDA reached $3.538 billion.

Some of you might already be ready to conclude: Revenue nearly doubled, losses are narrowing, the earnings report is fully positive — the stock is about to take off, right?
Now take a look at the cash flow statement and capital expenditures: the company's quarterly capex reached $18.369 billion, of which AI-related capex accounted for approximately $15.828 billion.
In other words, SpaceX is expanding rapidly, but the real cash it's pouring in to fuel that growth is equally staggering.
According to the BIT U.S. Stocks platform, SPCX released its earnings after market close on August 4, 2026. The stock closed at $125.33 before the report and closed at $108.27 the next day, a decline of 13.61%.
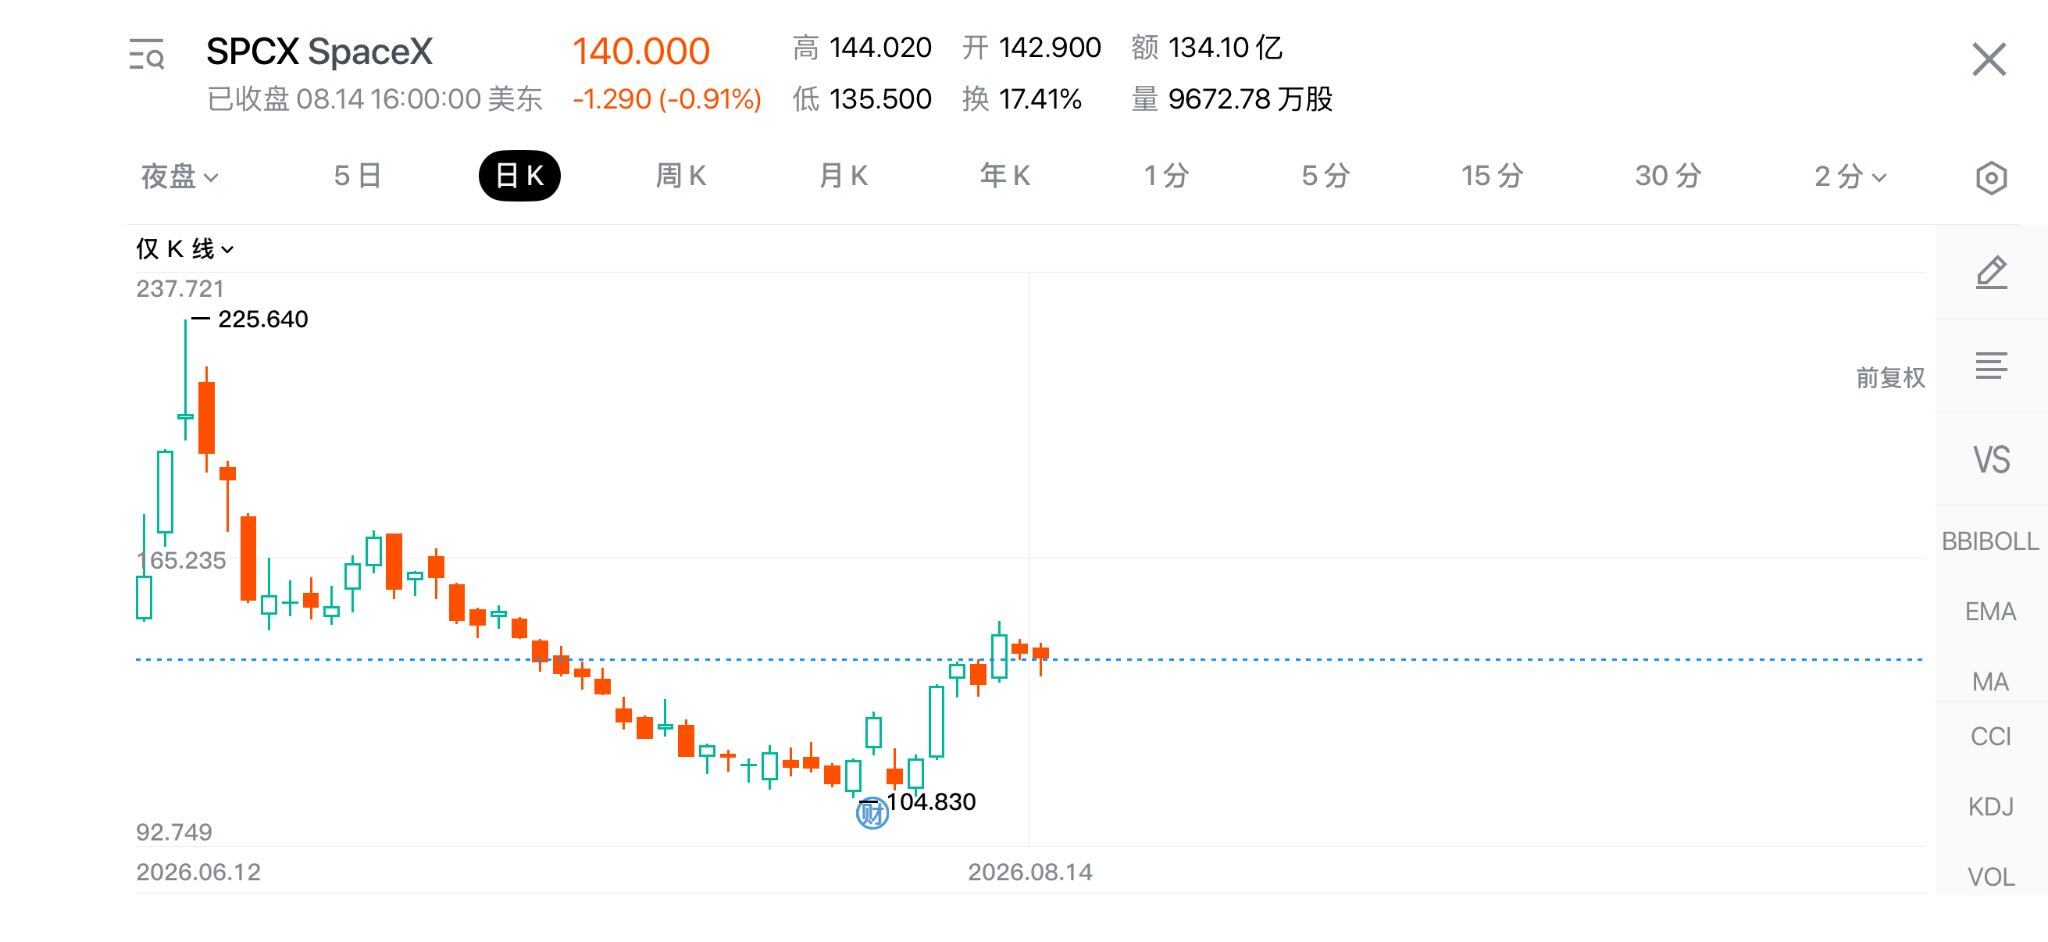
This doesn't mean the market is rejecting the company's growth. Instead, investors are simultaneously re-evaluating three questions:
First, when will the current phase of heavy investment translate into stable cash returns? Second, can the high valuation at the time of listing be supported by sustained performance? Third, will new supply from share unlock events affect short-term pricing?
👉 The first lesson SPCX teaches beginners is:
After reading revenue and EPS, look at at least three more items: capital expenditures, operating cash flow, and free cash flow. Revenue tells you how fast the business is expanding; cash flow tells you whether that expansion requires continuous "burning" of cash.
2. SanDisk — Look at Profits, But Also Sustainability
SanDisk operates in NAND flash memory and solid-state drive (SSD) business — an industry with highly visible cyclicality.
The company's key figures for the fourth quarter of fiscal 2026 include:
- Revenue of $8.965 billion, up 51% quarter-over-quarter;
- Non-GAAP gross margin of 84.6%;
- Next-quarter revenue guidance of $10.3 billion to $10.8 billion;
- Non-GAAP EPS guidance of $44 to $46.
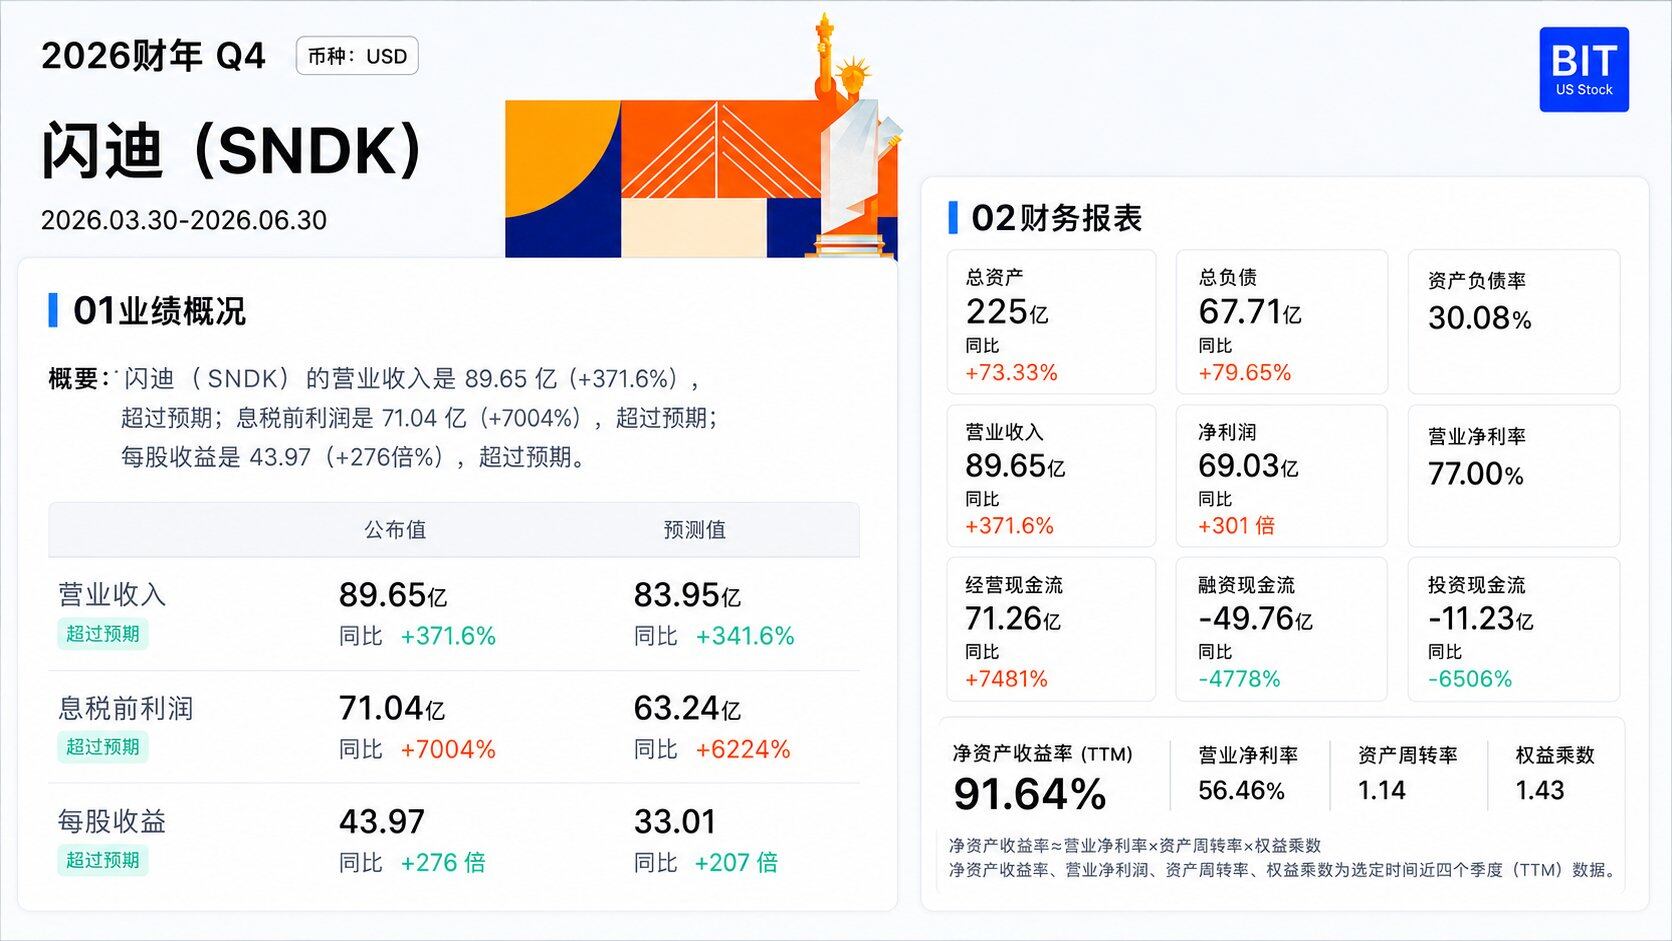
"Revenue surged, gross margin is extremely high, guidance is strong — surely this one should go up, right?"
Approximately one-third of the company's incremental revenue this quarter came from volume growth, while two-thirds came from price increases. In other words, the major driver of this quarter's improvement wasn't selling more products, but a significant rise in memory product prices.
According to the BIT U.S. Stocks platform, SanDisk released its earnings after market close on August 5, 2026. The stock closed at $1,350.50 before the report and closed at $1,258.58 the next day, down 6.81%.
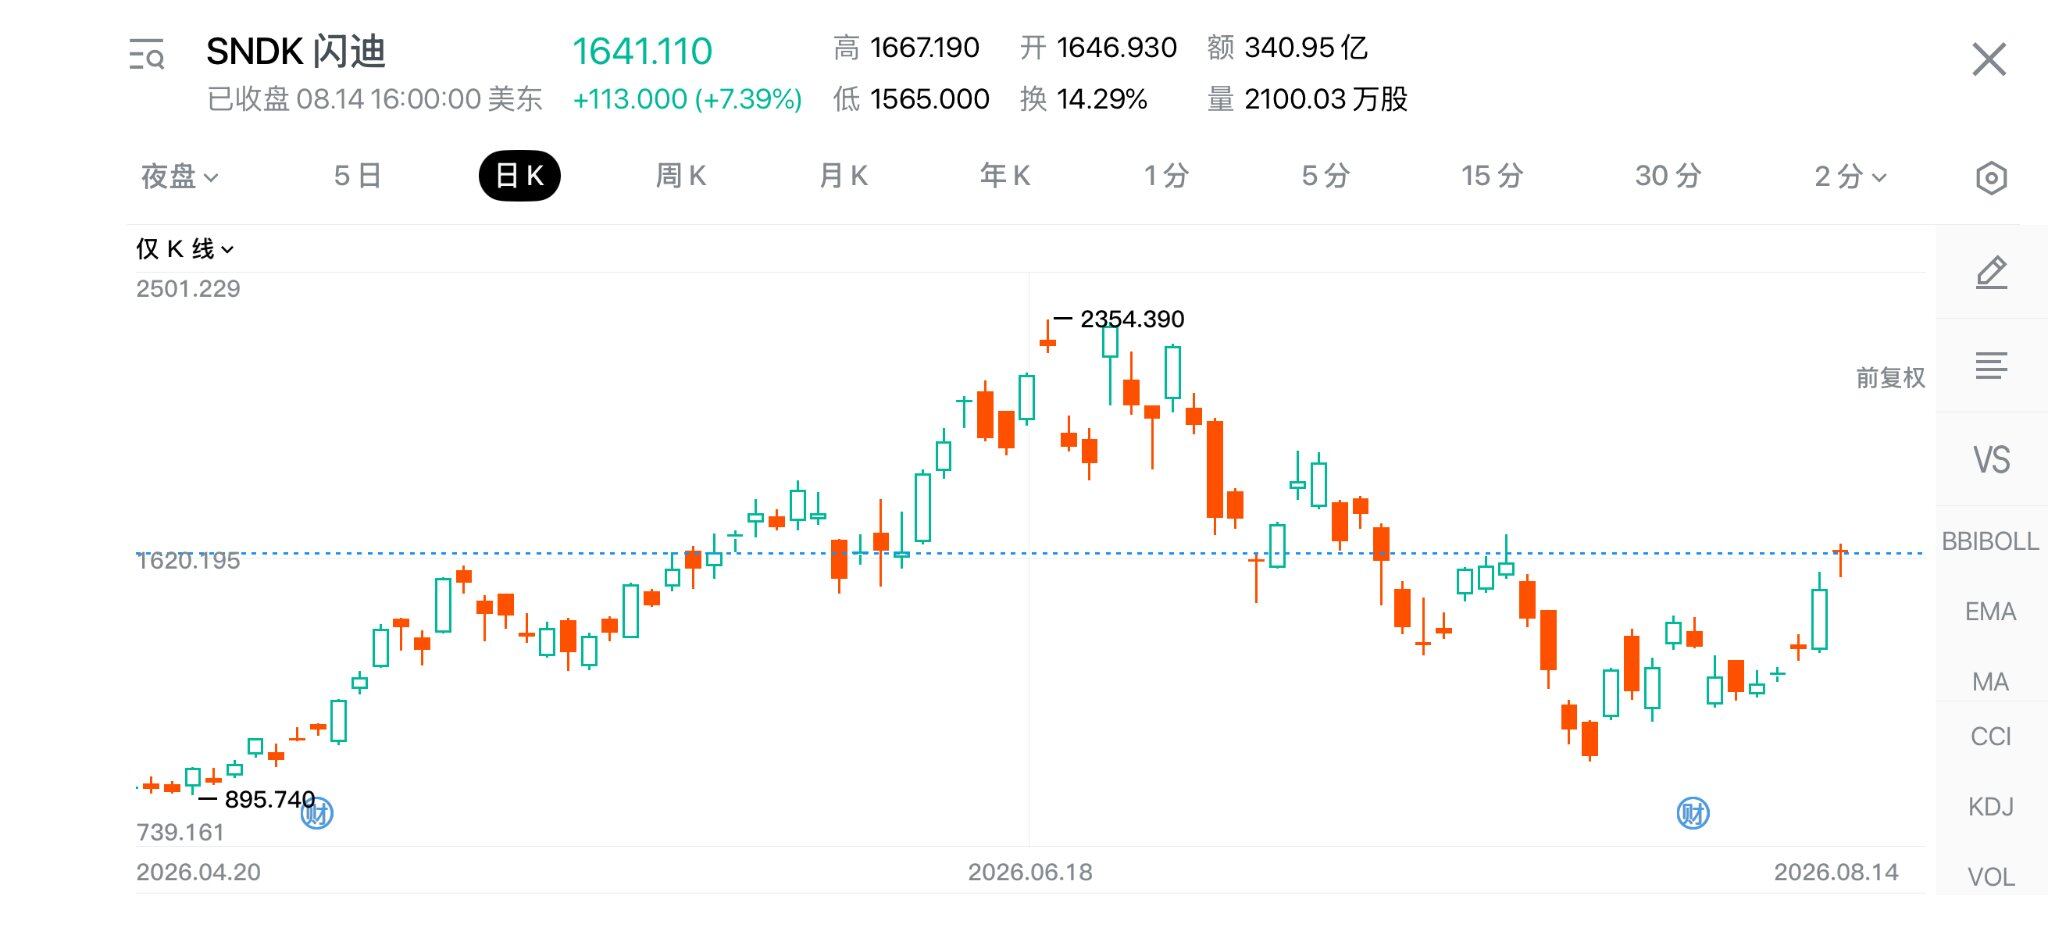
Was the report bad? Not at all. What the market worries about is: How long can price-driven growth last? Does the 84.6% gross margin represent a genuine improvement in long-term competitiveness, or is the memory cycle entering a peak?
For cyclical stocks, price increases are both a profit accelerator and a potential signal that the cycle is approaching its peak. If industry supply recovers, inventories build up, or customer purchasing slows down, prices and margins could quickly reverse.
So when reading a company like SanDisk, you can't just look at the revenue growth rate. You need to keep tracking:
- How much of revenue growth comes from volume vs. price;
- Whether company and channel inventories are rising;
- Whether the industry is seeing capacity expansion or supply recovery;
- Whether the share of data center customers is consistently increasing;
- Whether long-term supply agreements can reduce price volatility.
👉 The second lesson SanDisk teaches beginners is:
When analyzing cyclical stocks, you must break down growth into "volume" and "price." Volume growth usually signals real demand expansion; price increases can quickly boost profits, but their sustainability is often harder to judge. Both types of growth add to revenue, yet their investment implications can be completely different.
3. Google — Look at EPS, But Also Its Source
Now let's look at Alphabet, Google's parent company. According to the earnings report:
- Alphabet's Q2 revenue reached $119.796 billion, up 24% year-over-year;
- Google Cloud revenue grew 82%, with operating profit up 30%;
- Most striking of all, EPS grew 294% year-over-year to $9.11.
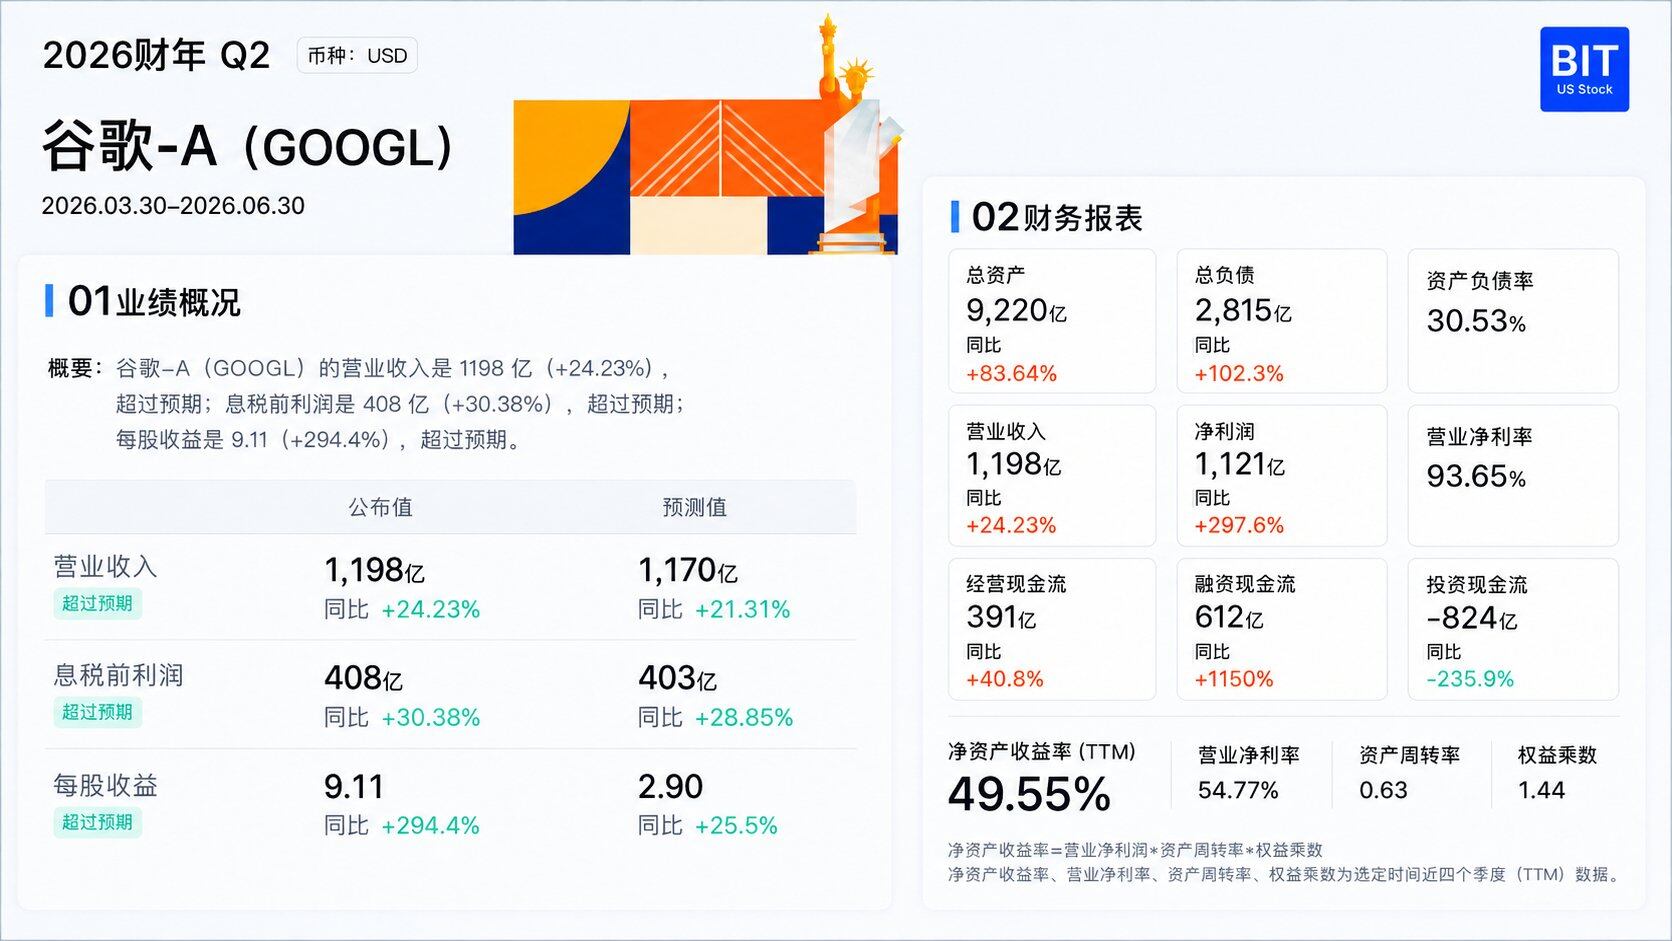
"EPS (Earnings Per Share) nearly tripled — that must mean very high profit quality, right?"
Not necessarily. At this point, you need to dig into what happened between operating profit and net income.
Alphabet recorded approximately $97.983 billion in other income this quarter, primarily from unrealized gains on its stock portfolio. These gains can significantly inflate net income and EPS, but they don't mean the company sold that much more advertising, cloud services, or AI products during the quarter — and they may not repeat next quarter.
Meanwhile, the company's quarterly capex approached $44.9 billion, free cash flow turned negative, and full-year capex guidance was raised from $180–190 billion to $195–205 billion.
According to the BIT U.S. Stocks platform, Alphabet released its earnings after market close on July 22, 2026. The stock closed at $342.09 before the report and closed at $317.69 the next day, down 7.13%.
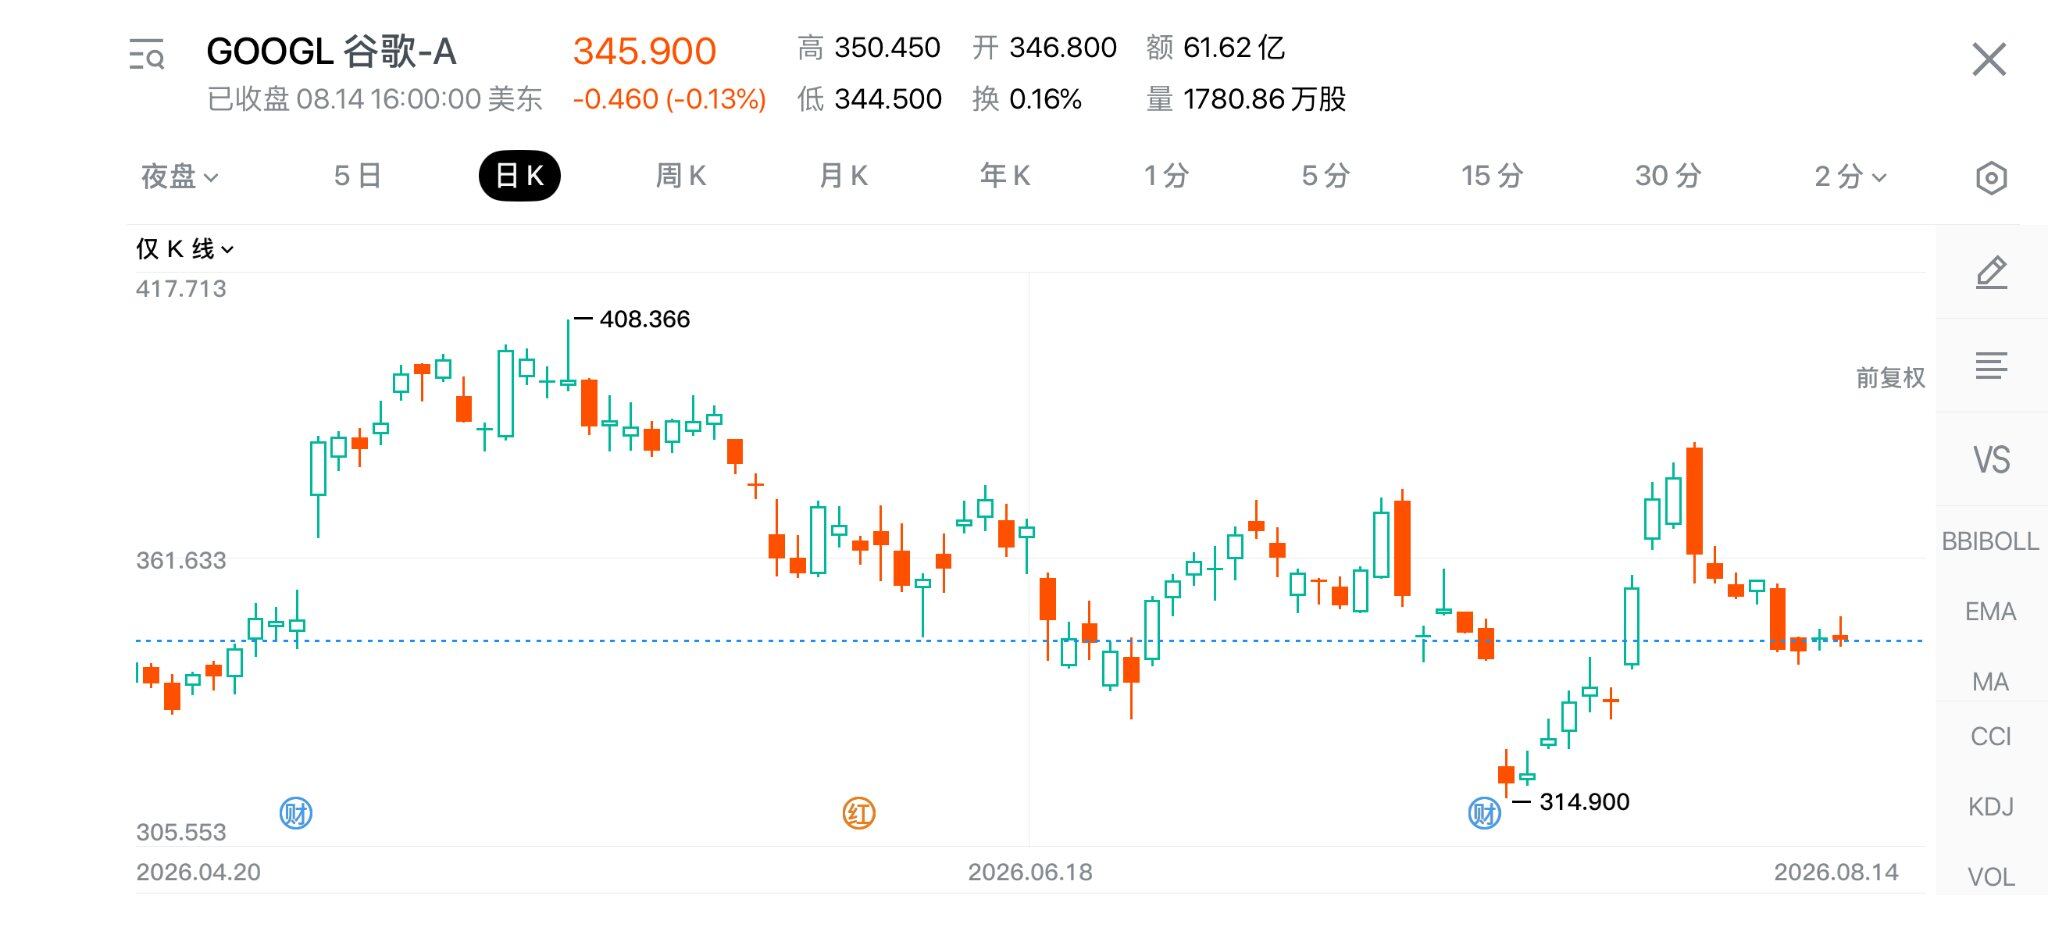
What the market actually saw was a set of coexisting forces: Google Cloud and the core business remain strong, but EPS growth includes a large amount of non-operating gains; AI investment continues to accelerate, putting pressure on short-term free cash flow; and investors are still waiting for more evidence that massive capital spending will translate into sustainable returns.
👉 The third lesson Google teaches beginners is:
Start by comparing the growth rates of operating profit and net income. If the gap between them is large, dig into investment gains, asset sales, interest, and tax adjustments. One-time gains can make a quarter's EPS look spectacular, but they don't necessarily reflect a simultaneous improvement in core business profitability.
2. Six Questions to Always Ask When Reading Earnings Reports
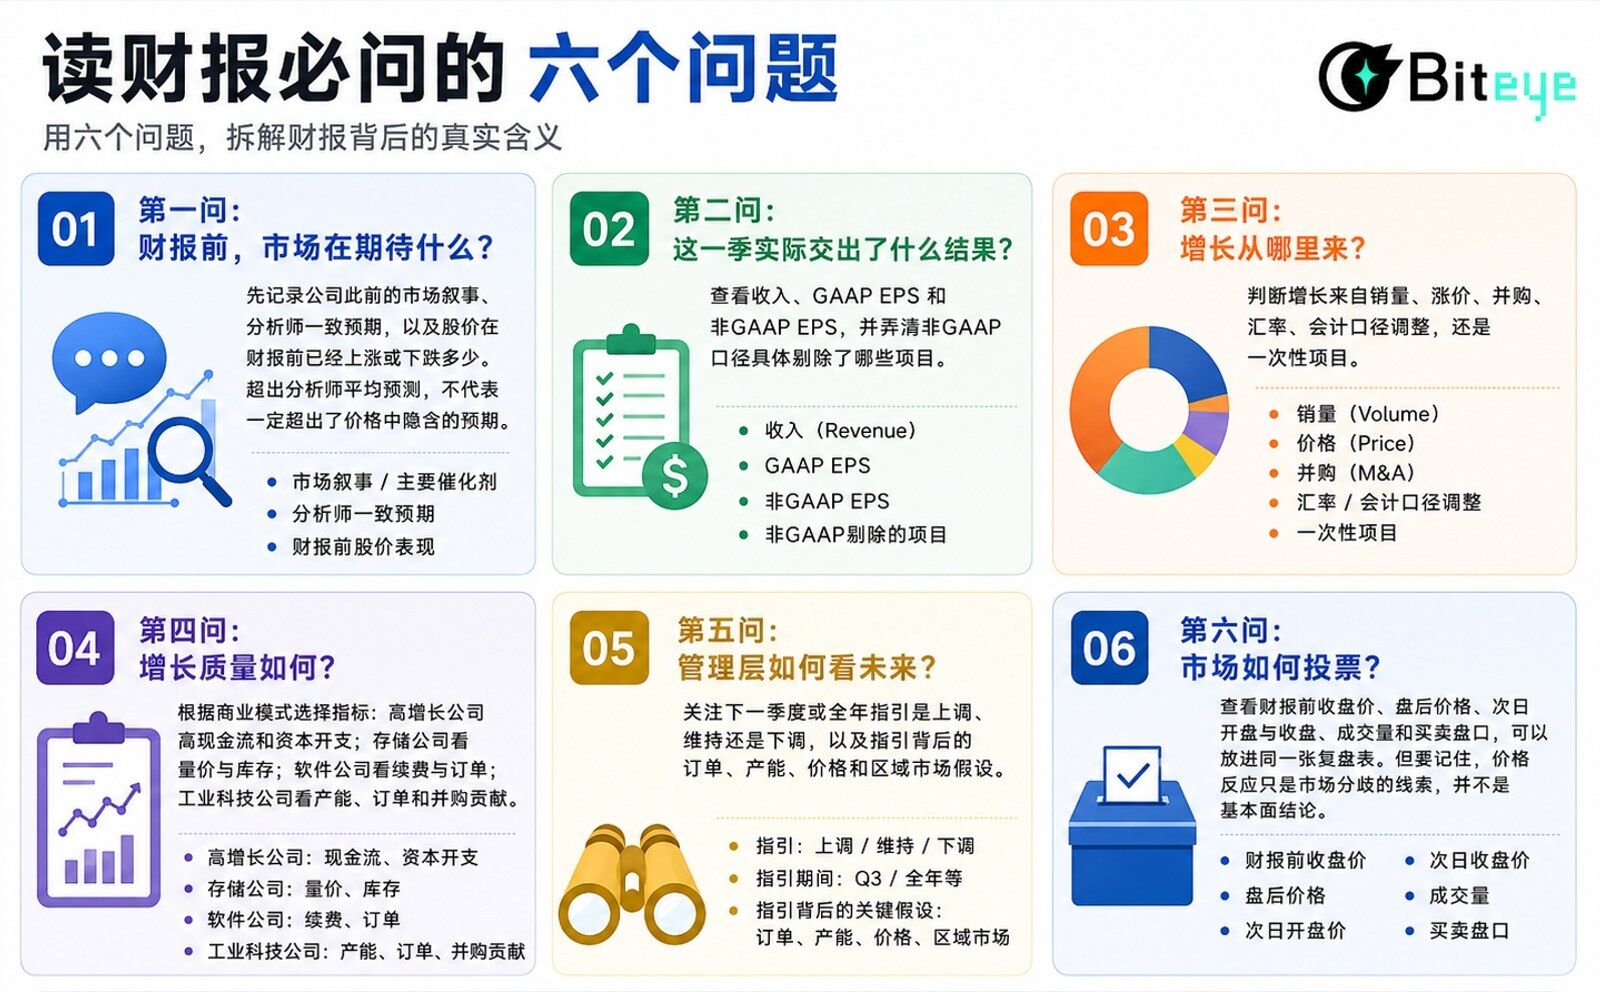
In practice, you don't need to drown in the sea of numbers. As long as you focus on six core questions, you can quickly assess performance, growth quality, and market expectations.
How exactly to ask and what to look for? We've mapped it all out for you in one chart 👇
3. Final Thoughts
SPCX teaches us: when reading earnings, don't just look at the past — look at future guidance. 🗺️
SanDisk teaches us: when analyzing growth, don't just look at the numbers — break down "volume" and "price." 🔢
Google teaches us: when evaluating profits, don't just look at EPS — dig into where the profits actually come from. 💰
So, beginners reading U.S. earnings reports don't need to study dozens of metrics from day one.
Start by identifying: revenue, sources of growth, sources of profit, and future guidance;
Then, based on the company's business model, choose relevant metrics like orders, volume-price dynamics, gross margin, inventory, and cash flow;
Finally, track the stock price reaction before and after the report to see what the market was worried about, and what information changed its mind.
An earnings report isn't there to hand you a simple "buy" or "sell" signal. What it truly offers is an opportunity to put company operations, market expectations, and stock price on the same table and re-examine them together.
📊This article is supported by real-time quotes from the BIT U.S. Stocks platform. For more professional U.S. stock research reports, visit the BIT U.S. Stocks Research Library 🔗https://www.bit.com/zh/insights/research
⚠️ Risk Disclosure:
·This article is for public information research and investor education only and does not constitute investment advice, trading recommendations, or return commitments.
·Quotes displayed on the BIT U.S. Stocks platform may vary due to trading hours, quotation permissions, and data standards. Please refer to the actual pages in the BIT App.
·U.S. stocks and related financial products carry market, liquidity, and exchange rate risks. Investors should make prudent decisions based on their own risk tolerance.





