






Gate Research: Jersey Mike's IPO Deep Dive – Business Model, Capital Structure, and Valuation Analysis


- Core View: Jersey Mike's IPO is essentially a capital move for private equity exit and deleveraging, rather than growth financing. The company's franchise model is high-quality, but growth has slowed, with a valuation of $21 per share sitting at a reasonable level and any price above $23 implying a premium.
- Key Elements:
- IPO proceeds are primarily used to repay approximately $2.1 billion in debt incurred from the Blackstone acquisition, with roughly 68% of the offering size consisting of existing shareholders selling shares, while Blackstone retains controlling interest.
- Approximately 99% of stores are franchised, operating a capital-light, high-cash-flow model; revenue growth, same-store sales, and store opening pace have slowed in 2025, with growth maturing.
- GAAP earnings are distorted by pushdown accounting, with depreciation and amortization surging from approximately $10 million to roughly $96 million; Adjusted EBITDA provides a better reflection of operational performance.
- In 2025, average unit volume (AUV) is approximately $1.36 million per store, with store-level profit margins around 16%, cash-on-cash returns of approximately 42%, and a payback period of roughly 2.4 years—franchisee economics remain attractive.
- Post-IPO net debt is reduced to approximately $1.6 billion, with net leverage around 4.0–4.7x EBITDA, still higher than most capital-light franchise restaurant companies.
Summary
• IPO Primarily a Capital Move: Jersey Mike's IPO is primarily aimed at repaying debt incurred from the Blackstone acquisition and providing an exit channel for existing shareholders, rather than raising capital for business expansion; Blackstone will retain control post-IPO.
• Strong Franchise Model, but Growth Maturing: Approximately 99% of locations are franchised, offering an asset-light model with high cash flow. While the US still has room for expansion and digital memberships and international growth provide long-term drivers, revenue growth, same-store sales, and the pace of new store openings have begun to slow.
• GAAP Profit Impacted by Accounting and Leverage: Pushdown accounting following the Blackstone acquisition significantly increased depreciation and amortization. Combined with high interest expenses from approximately $2.1 billion in acquisition debt, net income is distorted; Adjusted EBITDA is a better reflection of operational performance.
• Franchisee Economics Remain Attractive: In 2025, average unit volume (AUV) was approximately $1.36 million, store-level margins were ~16%, cash-on-cash returns were ~42%, and the payback period was ~2.4 years, supporting continued expansion by existing franchisees. However, these figures are largely self-reported by franchisees.
• Leverage Declines Post-IPO but Remains High: Net debt is expected to fall to ~$1.6 billion post-offering, with net leverage of ~4.0–4.7x EBITDA. While financial risk improves compared to pre-IPO levels, it remains higher than most asset-light franchised restaurant companies.
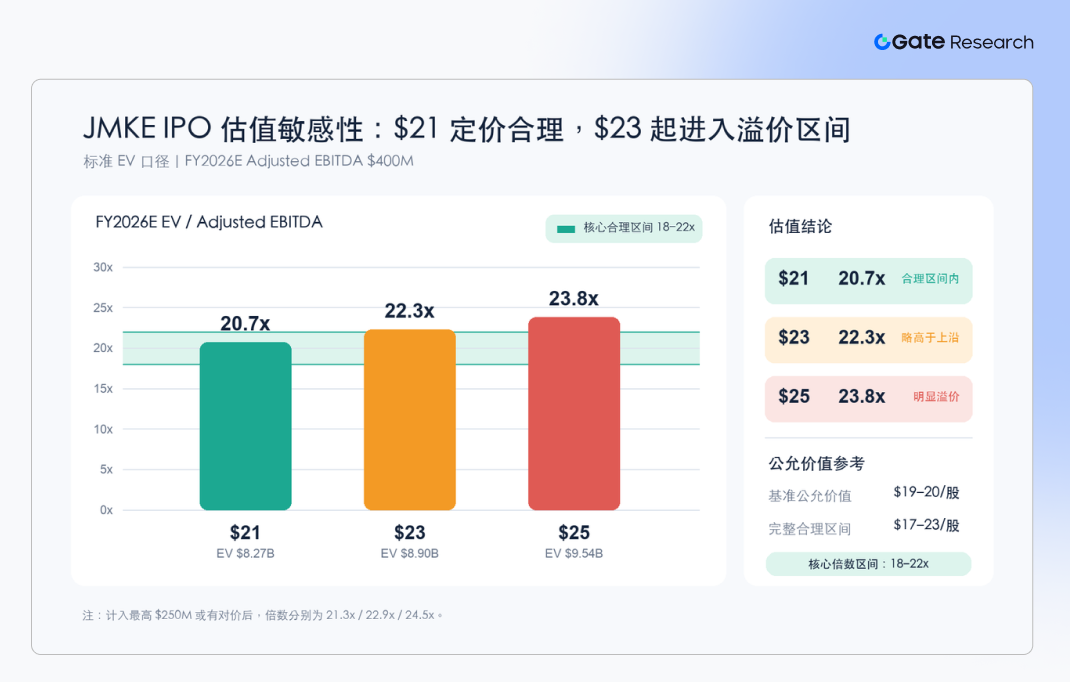
• Valuation Slightly Rich; $21 is Acceptable: The author estimates a fair value range of 18–22x EV/Adjusted EBITDA. Based on the current offering price range, $21 sits within the fair value range but slightly above the midpoint of the valuation range.
Introduction
Jersey Mike's is a US submarine sandwich chain built on a predominantly franchise-based model. This IPO leans more towards a private equity exit and deleveraging exercise than a traditional growth capital raise. The company filed its S-1 with the SEC on July 2, 2026, submitted Amendment No. 1 on July 20, and currently has a proposed offering price range of $21–$25 per share. As of the time of writing, final pricing has not been set.
The controlling shareholder is Blackstone, which completed its acquisition of the company in 2025 and is expected to retain control after the IPO. Based on the currently disclosed offering structure, IPO proceeds are primarily designated to repay securitized debt from the acquisition, with a significant portion of shares also coming from existing shareholders' sales. Therefore, this transaction functions more as a capital structure optimization and shareholder liquidity event than a capital raise to fuel business expansion. As the IPO has not yet been priced, all valuation analysis herein is based on the current filing range.
1. Business Quality: Excellent Asset-Light Franchise Model, but Growth Entering a Slowdown Phase
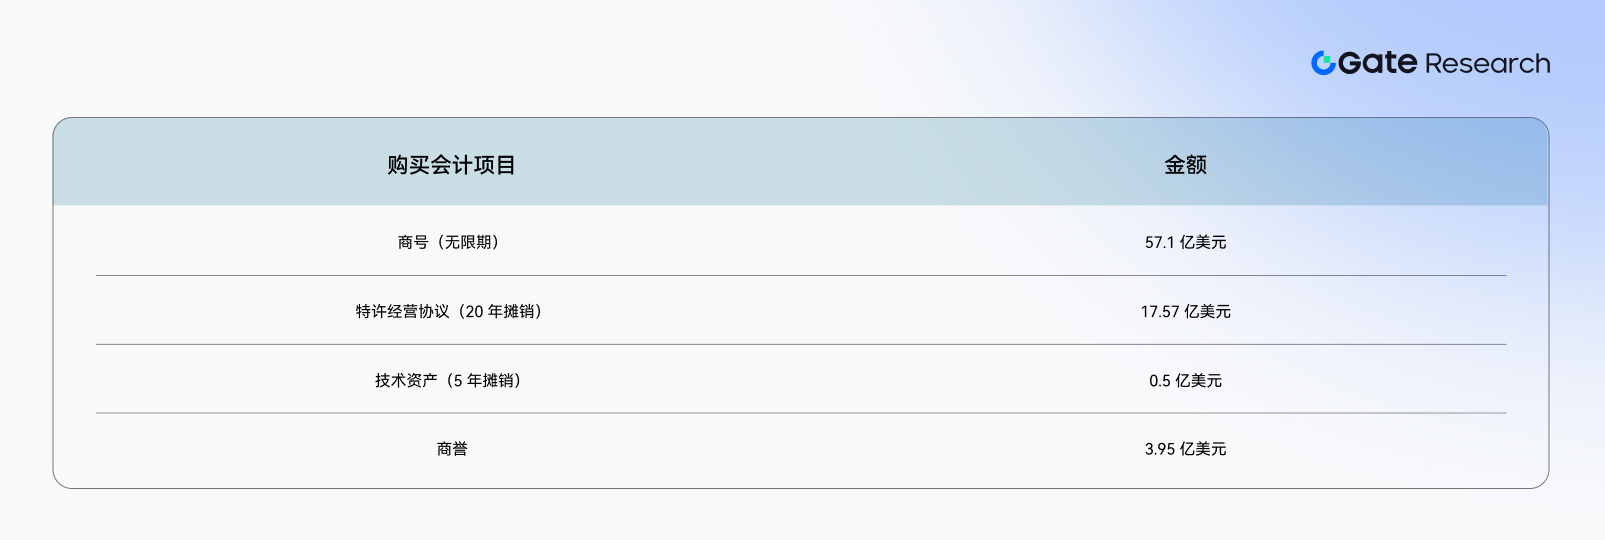
Jersey Mike's history dates back to 1956, with Peter Cancro acquiring the original store in 1975 and beginning franchising in 1987. The company was long controlled by its founder until Blackstone announced its acquisition of a majority stake in November 2024. The accounting purchase price was $6.317 billion, with the founder retaining a 10% non-controlling interest valued at $632 million; Blackstone controls 90%. Blackstone's announcement highlighted domestic and international expansion, technology, and digital investments.
Following the Blackstone acquisition, the company adopted pushdown accounting, remeasuring assets and liabilities at their acquisition-date fair value. This explains the jump in depreciation and amortization from approximately $10 million in 2024 to about $96 million in 2025. Consequently, net income is not directly comparable to pre-acquisition years and is unsuitable for valuation using a P/E multiple in isolation. This establishes the context:
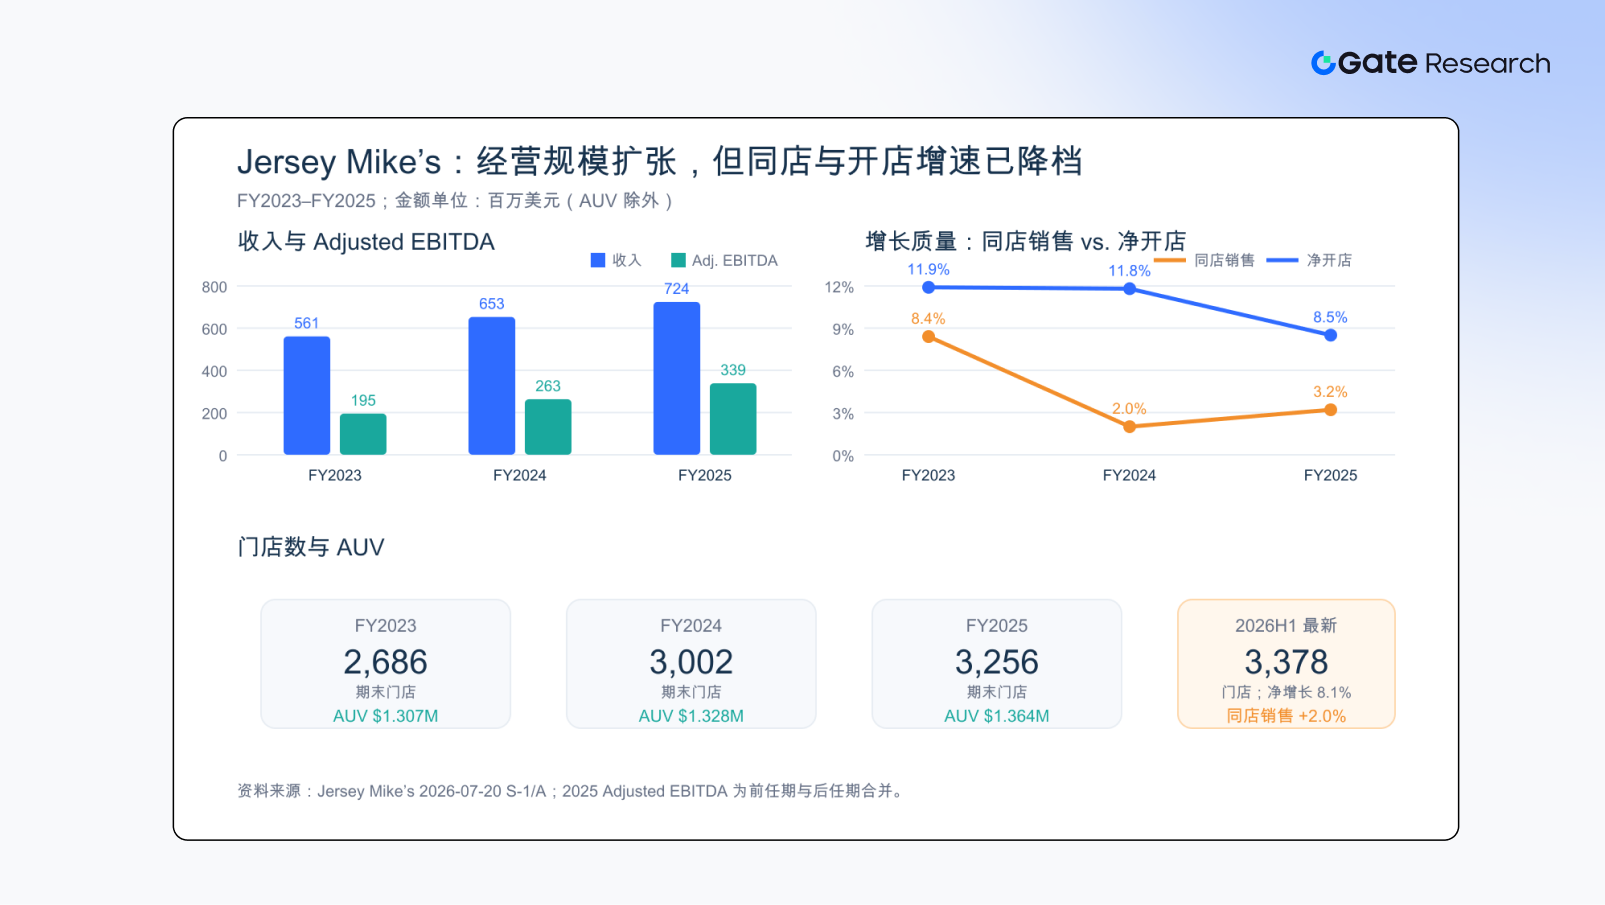
Jersey Mike's is not a traditional restaurant operator; rather, it operates on a highly franchised model. As of the end of June 2026, the company owned just 36 company-operated stores, primarily used for training, product testing, and operational experimentation – a franchise ratio of roughly 99%. Revenue is primarily derived from franchise fees and ongoing royalties, resulting in low capital expenditures and higher quality operating cash flow compared to company-owned restaurant chains. The company has delivered steady growth over the past three years.

Revenue has grown approximately 29% cumulatively over two years, driven mainly by continued store openings and same-store sales growth. Compared to the high-speed expansion phase post-pandemic, the company's 2025 revenue growth, same-store sales, and net new store additions have all decelerated, indicating a return to the more normal growth cadence of a mature restaurant brand.
1.1 The Company's Future Growth Engines
The company's future growth is expected to come from four main sources:
1. US Store Expansion: Management believes the US market can support approximately 7,500 stores, with a long-term global target of around 15,000.
2. Same-Store Sales Growth: Driven by brand strength, menu innovation, pricing power, and digital marketing.
3. Digital & Loyalty Ecosystem: Digital sales accounted for 42% of sales in 2025, and MyMike's active members exceeded 12.5 million, up roughly 62% since 2021.
4. Internationalization: A development agreement for 300 stores has been signed in Canada, with initial stores achieving annualized sales of ~$1.6 million; agreements for 300 stores are also in place for the UK and Ireland.
US expansion remains the most readily verifiable growth source. The international potential is significant long-term, but the master franchise rights for the UK and Ireland are held by an entity controlled by founder Peter Cancro, constituting a related-party arrangement; its economic interests may not be perfectly aligned with public minority shareholders. In summary, the franchise model remains highly replicable, positioning the company as a steady-growth franchisor rather than a hyper-growth entity.
2. Profitability Analysis: GAAP Earnings Affected by Accounting and High Leverage
2.1 Income Statement (USD mm)
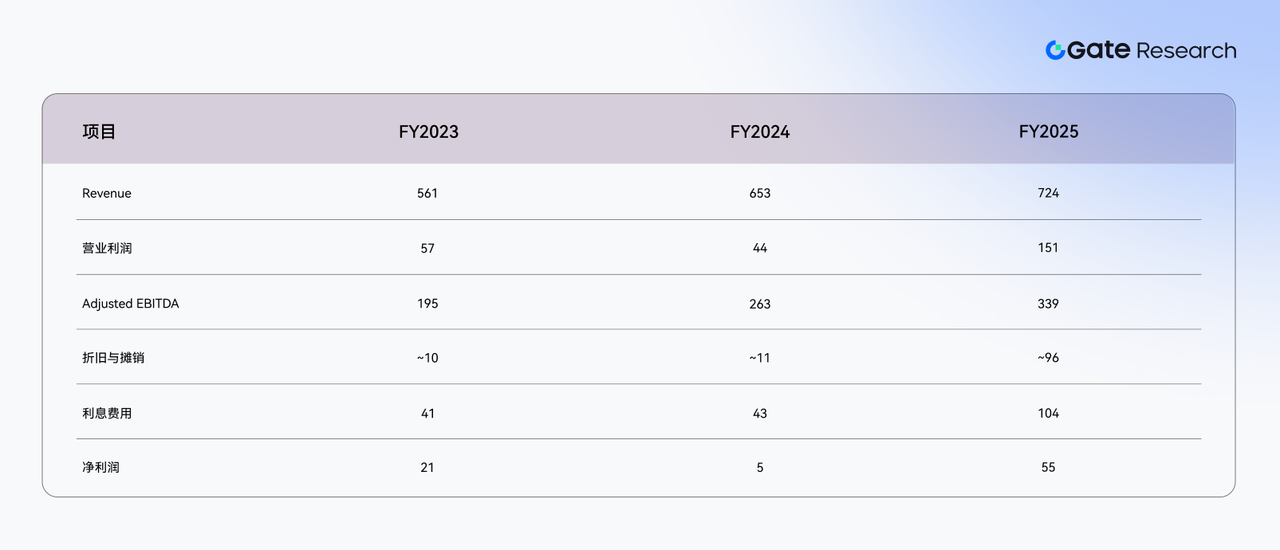
The most significant change in the FY2025 income statement originates from Purchase Accounting following the Blackstone acquisition. Intangible assets like trademarks and franchise agreements were remeasured at fair value, causing depreciation and amortization to jump from roughly $10 million to about $96 million. This expense, a non-cash accounting charge expected to persist for several years, pressures GAAP net income but does not directly impact the company's operating cash flow.
Furthermore, the company's ~$2.1 billion acquisition financing was structured as a Whole Business Securitization, pushing FY2025 interest expense to approximately $104 million. Thus, the currently depressed net income reflects not only non-cash amortization but also genuine cash interest expenses.
Consequently, Adjusted EBITDA is a more accurate gauge of operating performance than GAAP net income. However, it's crucial to note that Adjusted EBITDA is not wholly equivalent to distributable free cash flow; the interest costs from high leverage represent a real cash flow burden.
2.2 Franchisee Unit Economics
Standard terms of a franchise agreement include:
• Area development fee: typically $10,000;
• Initial franchise fee per store: typically $20,000;
• Ongoing royalties: 6.5% of gross store revenue;
• Advertising fund contribution: 5.0% of gross store revenue;
• Initial term of 10 years, renewable for another 10 years upon meeting conditions.
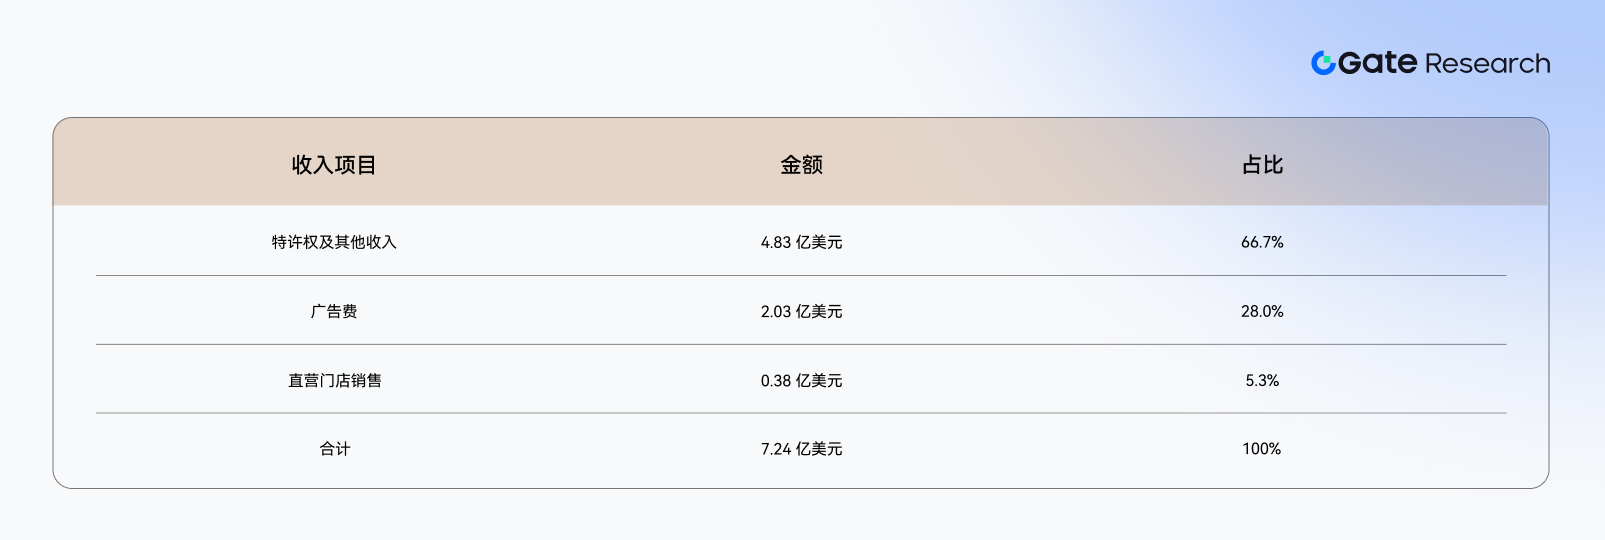
The 2025 revenue mix was as follows:
Management-disclosed 2025 unit economics:
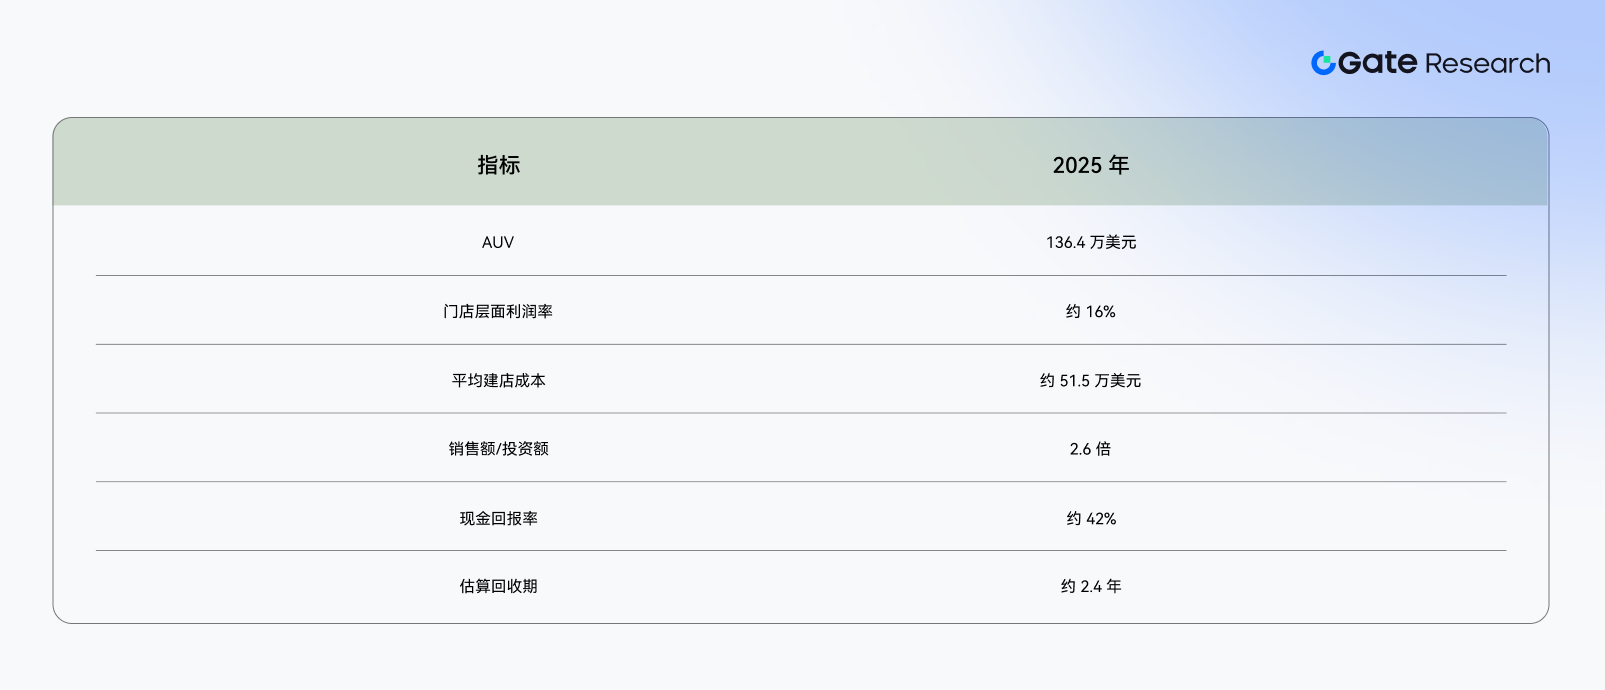
This is the company's most crucial growth moat. Franchisees can still achieve roughly 16% store-level margins after paying 6.5% royalties and 5% advertising fees, enabling multi-unit operators to reinvest. The company reports a development pipeline of over 1,600 stores as of the end of June 2026, with more than 90% owned by existing franchisees, signaling sustained confidence in the brand's returns.
However, it's important to note that cash-on-cash returns, build-out costs, and store-level EBITDA are self-reported by franchisees and not independently audited. As labor, rent, protein costs, and construction expenses rise, historical returns may not be indicative of future new store performance.
2.3 2026 Jersey Mike's Earnings Forecast
The company's estimates for the first half of 2026:
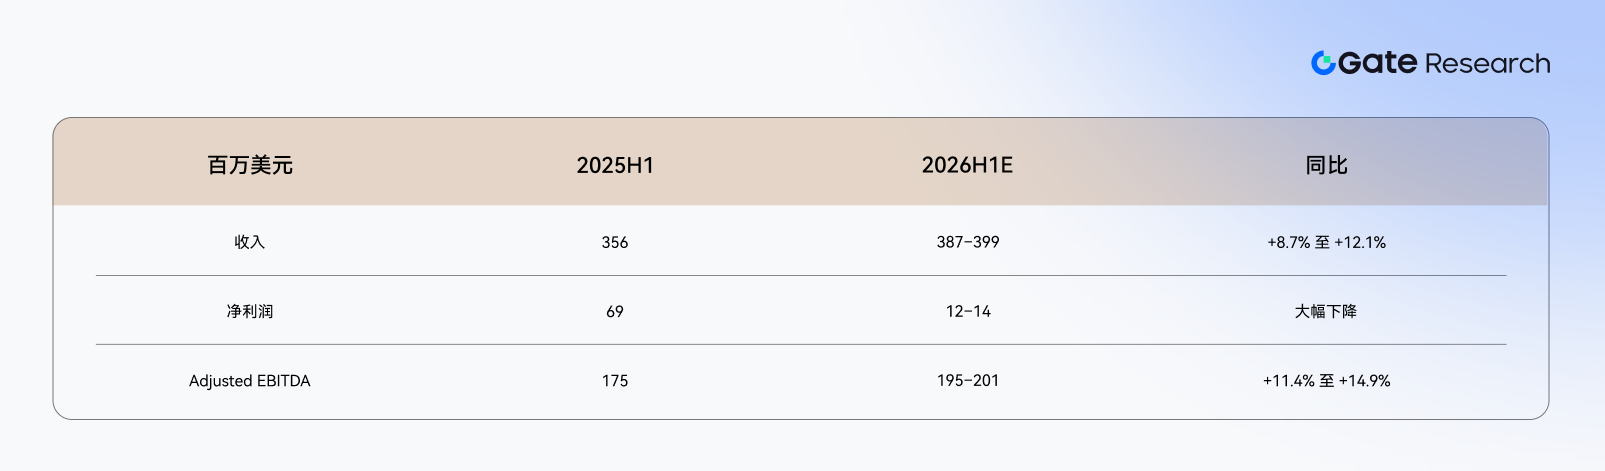
The decline in net income versus the rise in Adjusted EBITDA is primarily due to the add-back of approximately $51–53 million in Area Director buyout costs in 1H26. While this expense is somewhat transitional, potentially replaced by lower-cost internal regional management teams long-term, the cash already paid for restructuring is a real outflow in cash flow analyses.
Based on:
• ~9.3% system-wide sales growth in 1H26;
• ~8.1% net new store growth;
• ~2.0% same-store sales;
• 1H26 Adjusted EBITDA of ~$195–201 million;
• No significant macroeconomic deterioration in H2;
We estimate FY2026 Adjusted EBITDA between $390–410 million, with a base case of $400 million. This projection is an estimate from this report, not official company guidance.
3. Capital Structure: Debt Securitization and Private Equity Mechanics
3.1 Pre-IPO Debt Profile
Pre-IPO, the company had total debt of approximately $2.122 billion, cash on hand of ~$232 million, and net debt of ~$1.89 billion. Since 2019, the company has utilized whole-business securitization, placing trademarks, software, franchise agreements, area development contracts, and related cash flows into a bankruptcy-remote entity that guarantees fixed-rate notes.
Debt profile as of the end of March 2026:
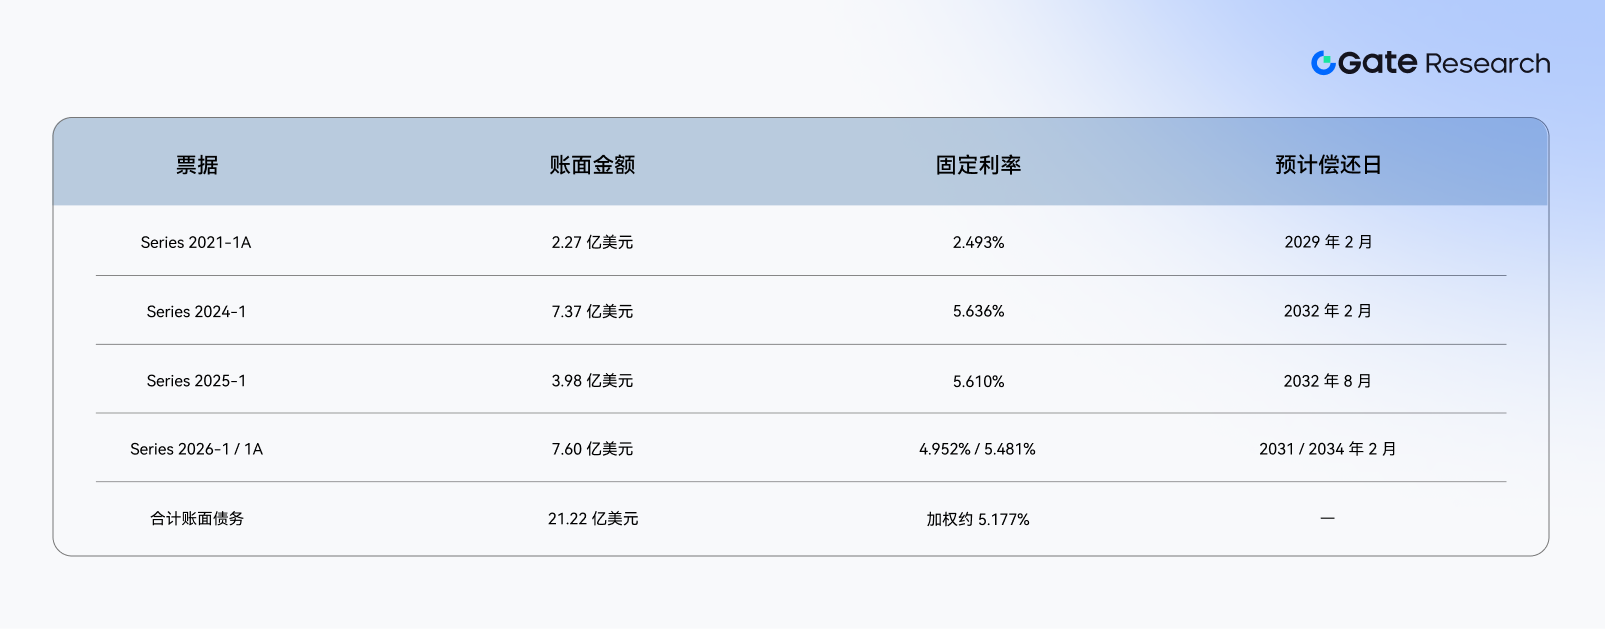
The primary debt is currently the Series 2026-1 Whole Business Securitization notes, with financing costs around 2.5%–5.6%.
This financing structure essentially places the brand, franchise contracts, and future royalty cash flows into an SPV, which then issues securities to investors. Given the stable cash flows, financing costs are typically lower than conventional corporate loans. However, upon future refinancing at bond maturity, the company faces repricing risk if prevailing market interest rates are higher than current levels.
3.2 Post-IPO Debt Profile
Based on a $23 midpoint price and the prospectus's pro forma figures:
• Debt decreases from $2.122 billion to approximately $1.827 billion;
• Cash is ~$232 million, adjustable to ~$220 million after accounting for approximately $12 million in unpaid offering expenses;
• Adjusted net debt is approximately $1.607 billion;
• Relative to FY2025 Adjusted EBITDA of $339 million, net leverage is ~4.7x;
• Relative to our estimated FY2026 Adjusted EBITDA of $400 million, net leverage is ~4.0x.
Following the IPO, the company's leverage is expected to decrease. While manageable given the stable franchise cash flows, the overall capital structure remains significantly more leveraged than most asset-light franchised restaurant companies. Therefore, financial risk does not entirely disappear post-IPO. If the likely future payment of the $250 million contingent consideration is treated as quasi-debt, the economic net debt approaches $1.857 billion.
4. IPO Use of Proceeds: Debt Repayment, Shareholder Liquidity, and Capital Structure Optimization
Based on calculations from the latest prospectus:
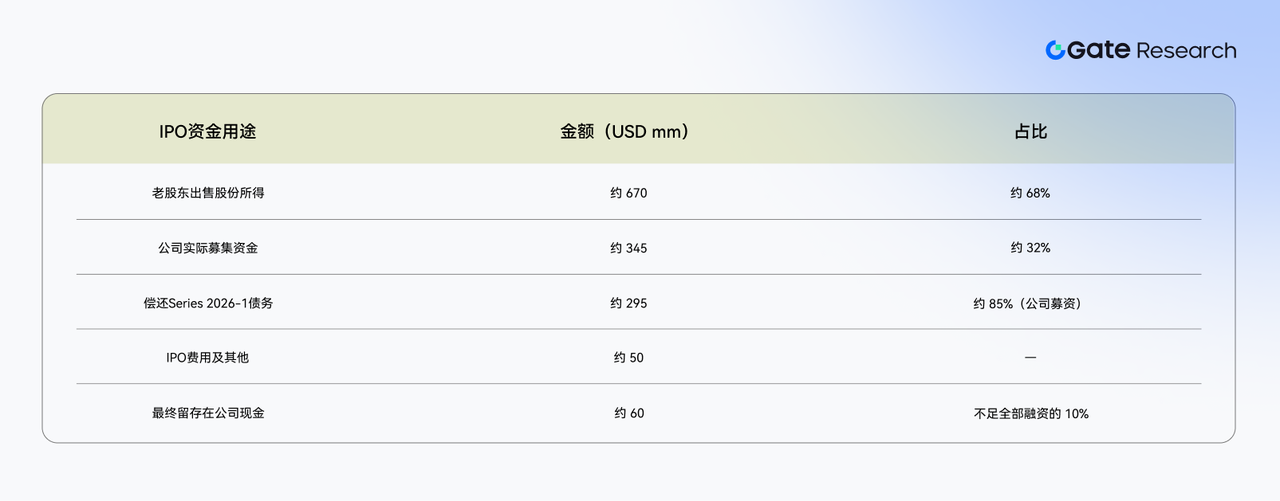
Examining the use of proceeds, a relatively limited portion of the new capital raised in this IPO will remain on the balance sheet to fund business development. A significant portion is designated to repay acquisition-related debt. Simultaneously, the total IPO offering size includes a notable proportion of shares sold by existing shareholders. Therefore, beyond supporting corporate operations, this IPO also serves objectives like optimizing the capital structure, deleveraging, and providing liquidity for early investors.
5. Valuation Analysis
5.1 Implied IPO Valuation Multiple
Based on a base case FY2026E Adjusted EBITDA of ~$400 million:
• Reasonable Enterprise Value (EV): approximately $7.2 – $8.8 billion;
• Subtracting post-IPO net debt of ~$1.595 billion implies an equity value of roughly $5.61 – $7.21 billion;
• Based on ~317.6 million shares on a fully exchanged basis, this corresponds to a fair value of ~$17.6 – $22.7 per share.
If the up-to-$250 million contingent consideration is treated as quasi-debt, the adjusted fair equity value drops to approximately $5.36 – $6.96 billion, or ~$16.9 – $21.9 per share.
Based on the current offering price range:
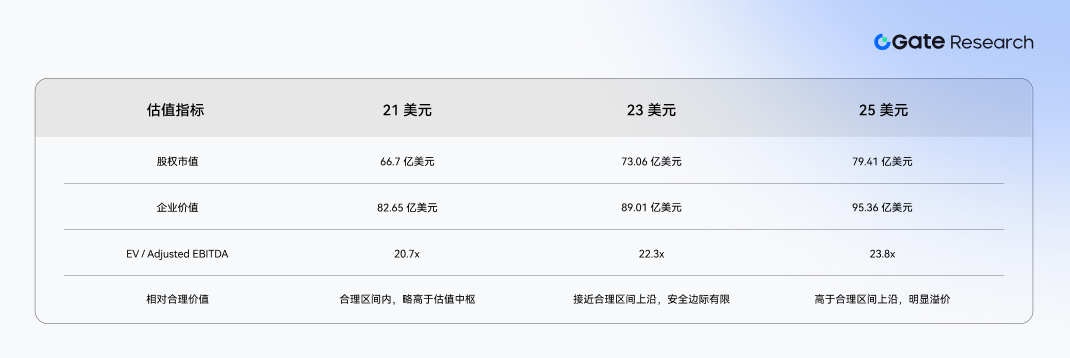
Based on FY2026E Adjusted EBITDA, $21 sits within the fair value range, representing reasonable pricing; $23 is slightly above the upper end of the fair value range, indicating a slight premium; $25 is notably high, with future growth expectations already well reflected.
5.2 Comparable Company Valuation: Should Sit Between Wingstop and Restaurant Brands
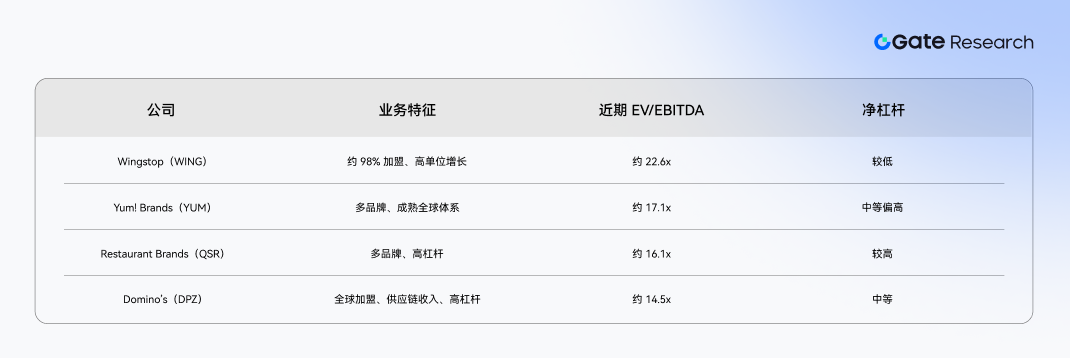
Market data references public valuation pages for Wingstop, Yum! Brands, Restaurant Brands, and Domino's from mid-July 2026. Definitions of EBITDA and lease liabilities may vary across data providers; hence, this report uses ranges rather than point estimates.
JMKE should command a higher valuation than mature franchise companies given its ~8% unit growth, still-growing AUV, and expected double-digit EBITDA growth in 2026E. However, it should not trade persistently above Wingstop:
• Wingstop's current system-wide unit growth is ~17%, significantly faster than JMKE's 8.1%;
• JMKE's same-store sales are only ~2%, down from the peak levels of 2023;
• JMKE's net leverage, TRA, related-party transactions, and controlling shareholder structure warrant a discount;
• Its 2026 EBITDA growth partially derives from restructuring and Area Director model adjustments, not solely from comps and unit openings.
Jersey Mike's possesses a franchise ratio and asset-light model resembling Wingstop's, but its growth rate is significantly lower. Simult





