Seller Exhausted, Buyers Absent: Bitcoin Awaits a 'Game-Changer' Below $68.7K


- Core View: Bitcoin remains trapped within the cost-basis range of $63,000 to $68,700, with spot trading volume hitting its lowest level since 2019. Seller exhaustion is evident, yet buyers remain absent, while leveraged funds have already positioned themselves long ahead of time. The market is in a late-stage bear-market compression phase, awaiting a directional breakthrough.
- Key Factors:
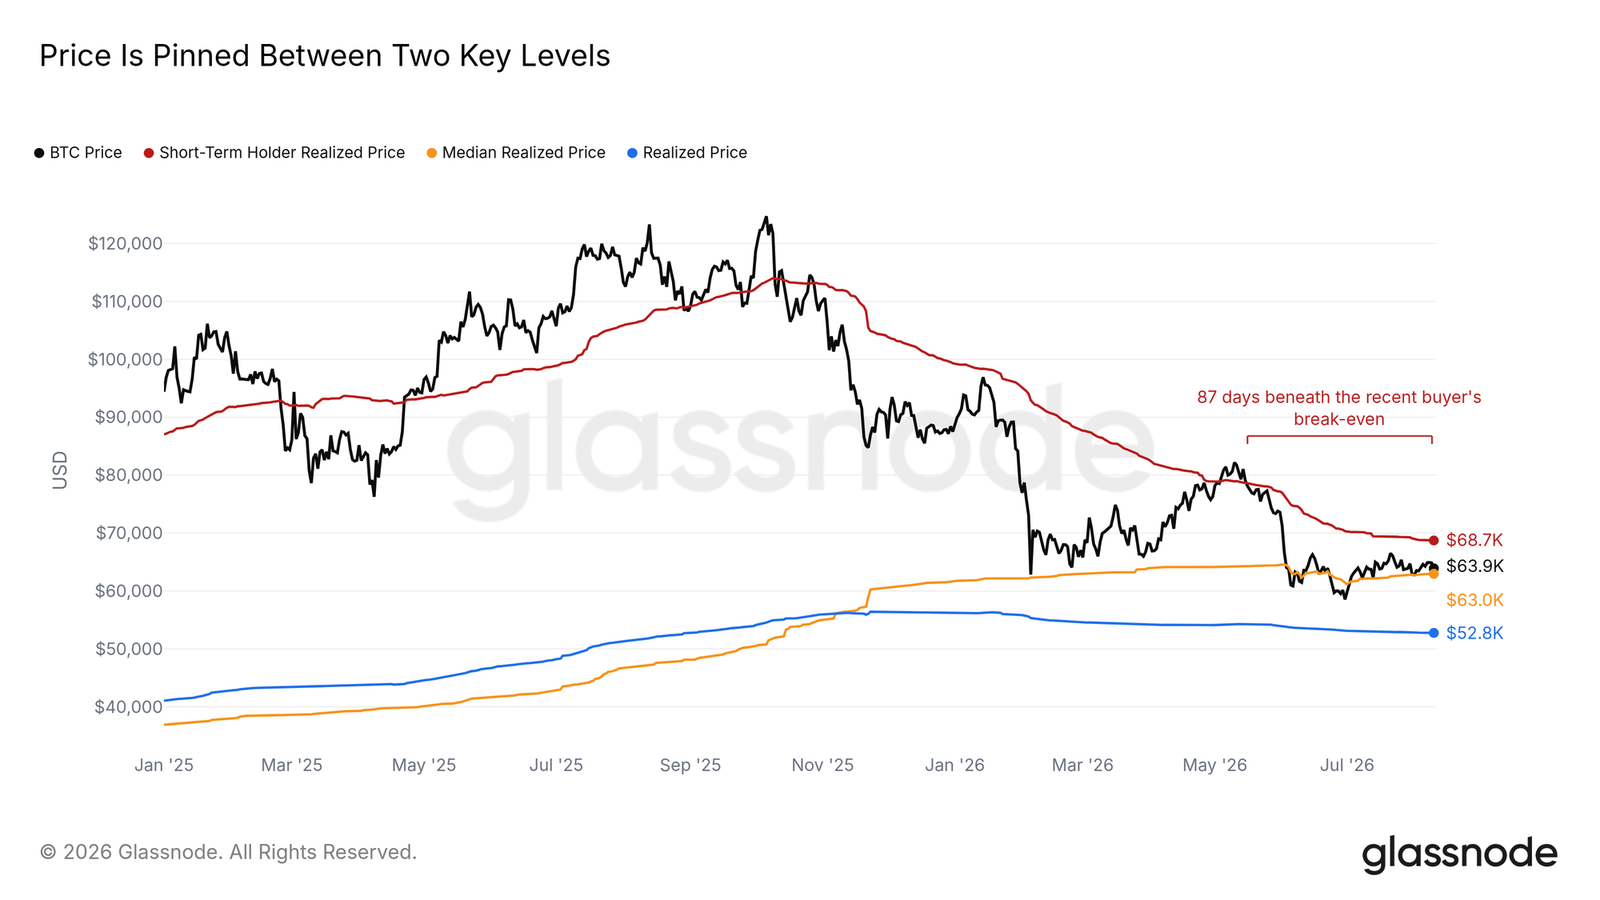
- Price is stuck between $63,000 (median realized price) and $68,700 (short-term holder cost basis), having consolidated for nearly three months with volatility converging.
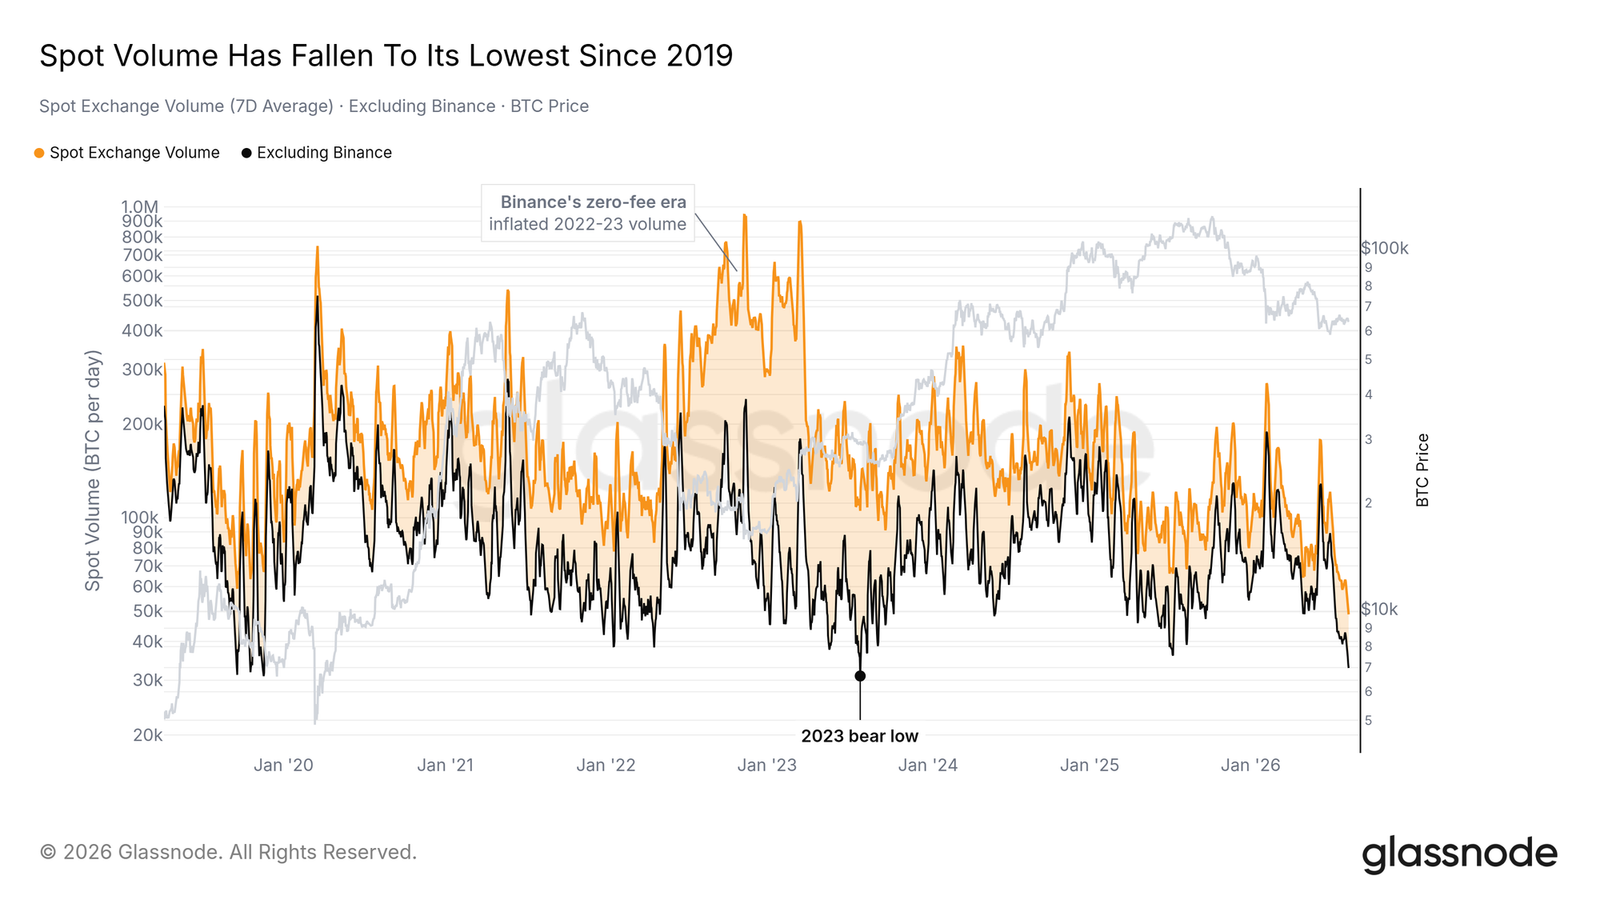
- Spot exchange trading volume (in coin terms) has fallen to its lowest since records began in early 2019, indicating extremely subdued market participation—a precursor to volatility expansion.
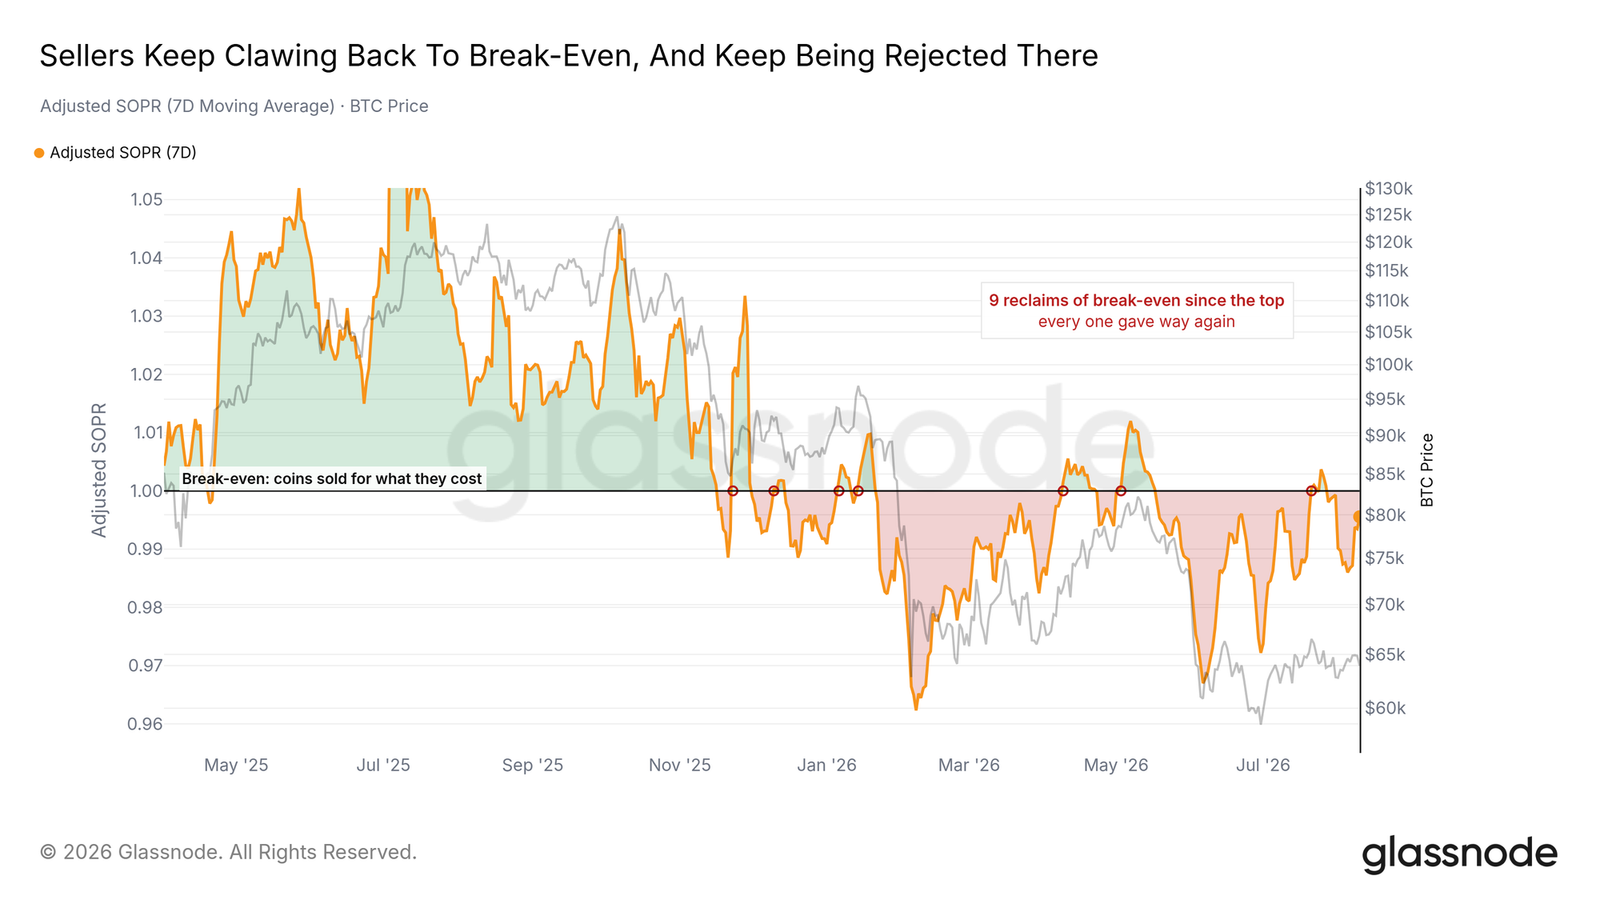
- Seller exhaustion signals: the proportion of supply in profit is approaching historical bear-market bottom zones, seller fatigue constants are among the weakest readings since 2013, and the adjusted SOPR breakeven line has suppressed rebounds nine times.
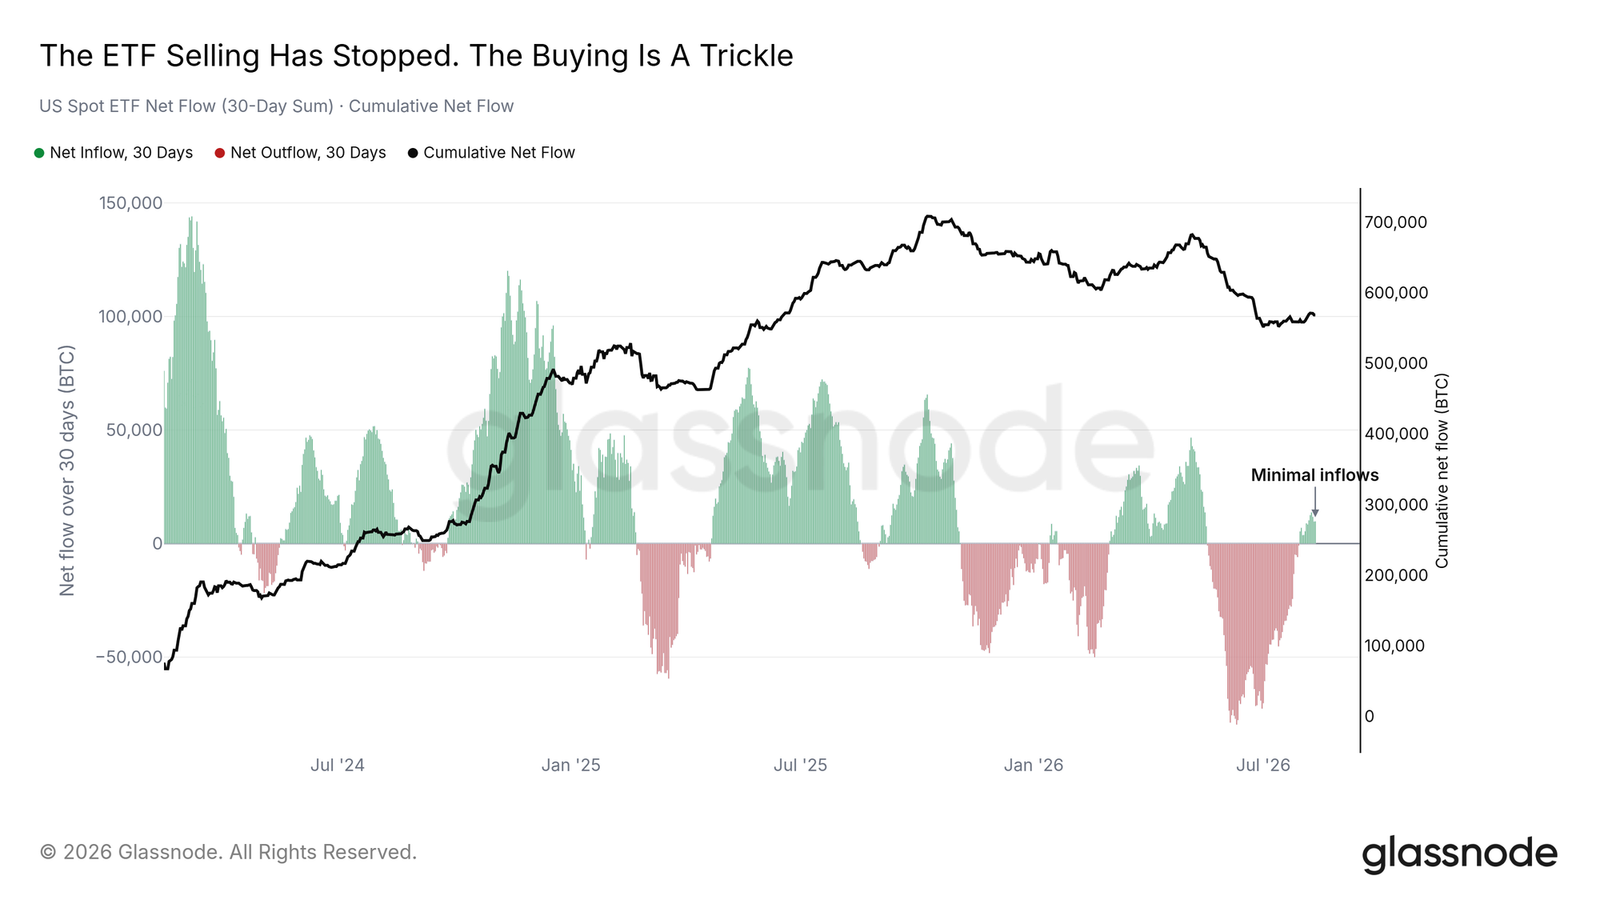
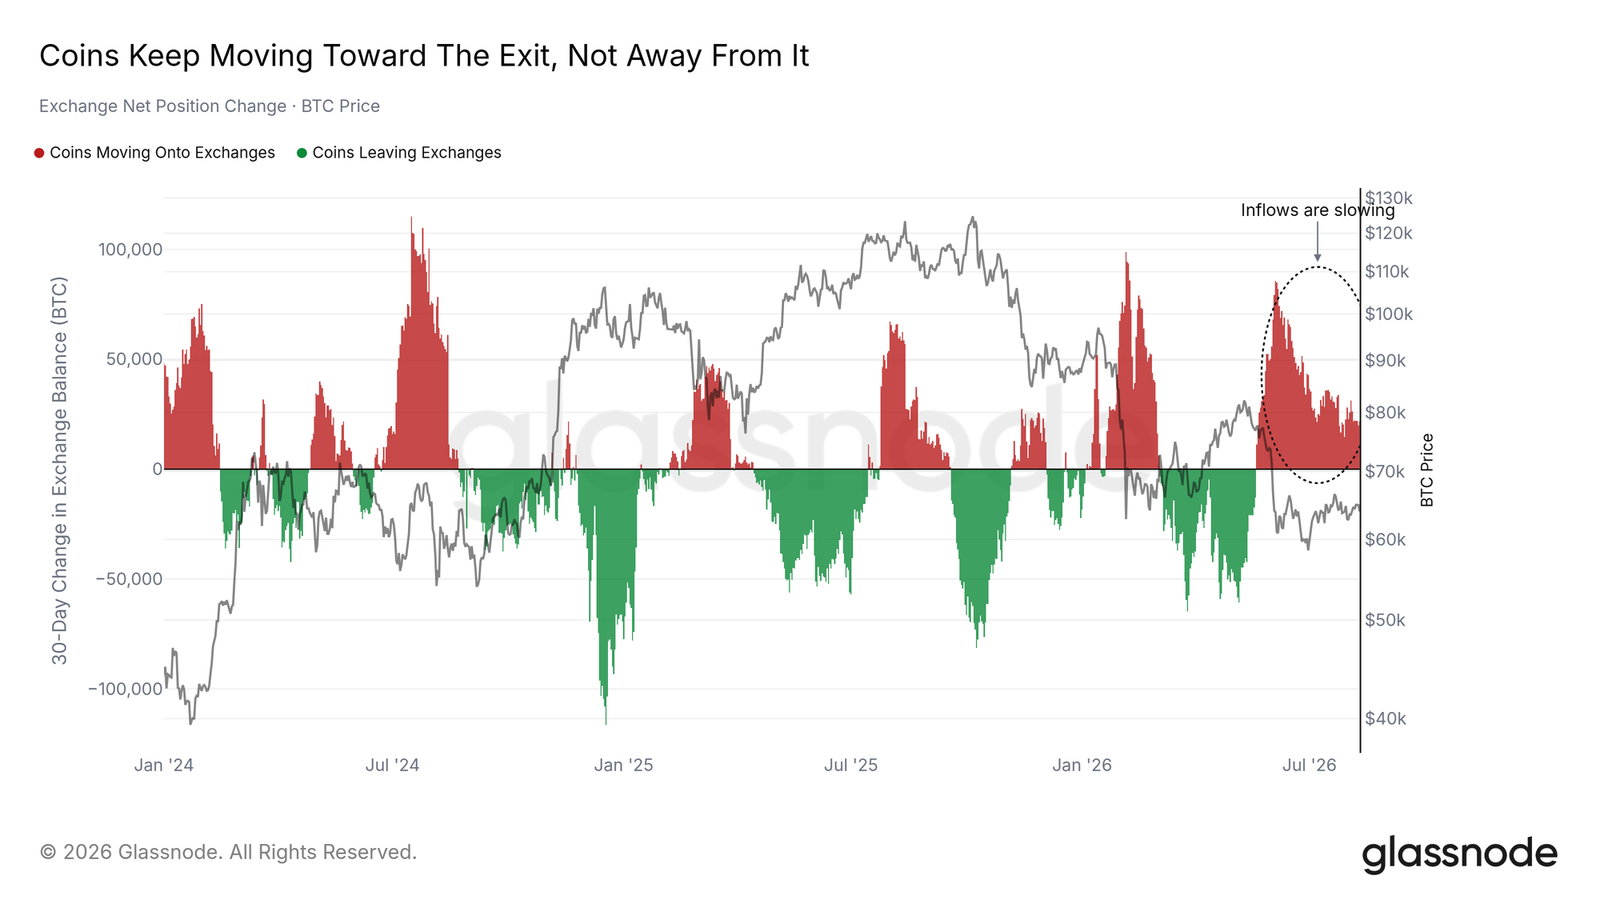
- Buyer absence: net ETF inflows are merely a fraction of previous accumulation waves, with cumulative holdings far below the October peak of last year; coins continue to flow into exchanges, keeping supply pressure unresolved.
- Leverage risks accumulating: Hyperliquid whales have maintained net long positions since March, open interest in futures exceeds full-day trading volume, approaching last September's record, amplifying liquidation risks amid thin trading conditions.
- Thin order book bids: static bid zones have shrunk by roughly one-third compared to early July; if support at $58,500 is breached, downside volatility could overshoot.
- Key levels to watch: a high-volume reclaim of $68,700 accompanied by ETF inflows would confirm improvement; a break below the $58,500 range low would invalidate the bottoming thesis.
Original Author: Glassnode
Original Translation: AididiaoJP, Foresight News
The Trigger Has Been Pulled
Bitcoin is caught between two cost bases, unable to move. Spot trading volume has fallen to its lowest level since 2019. Sellers are exhausting, buyers are waiting on the sidelines, but leveraged capital has already pulled the recovery trigger — the data just hasn't caught up yet.
Key Takeaways
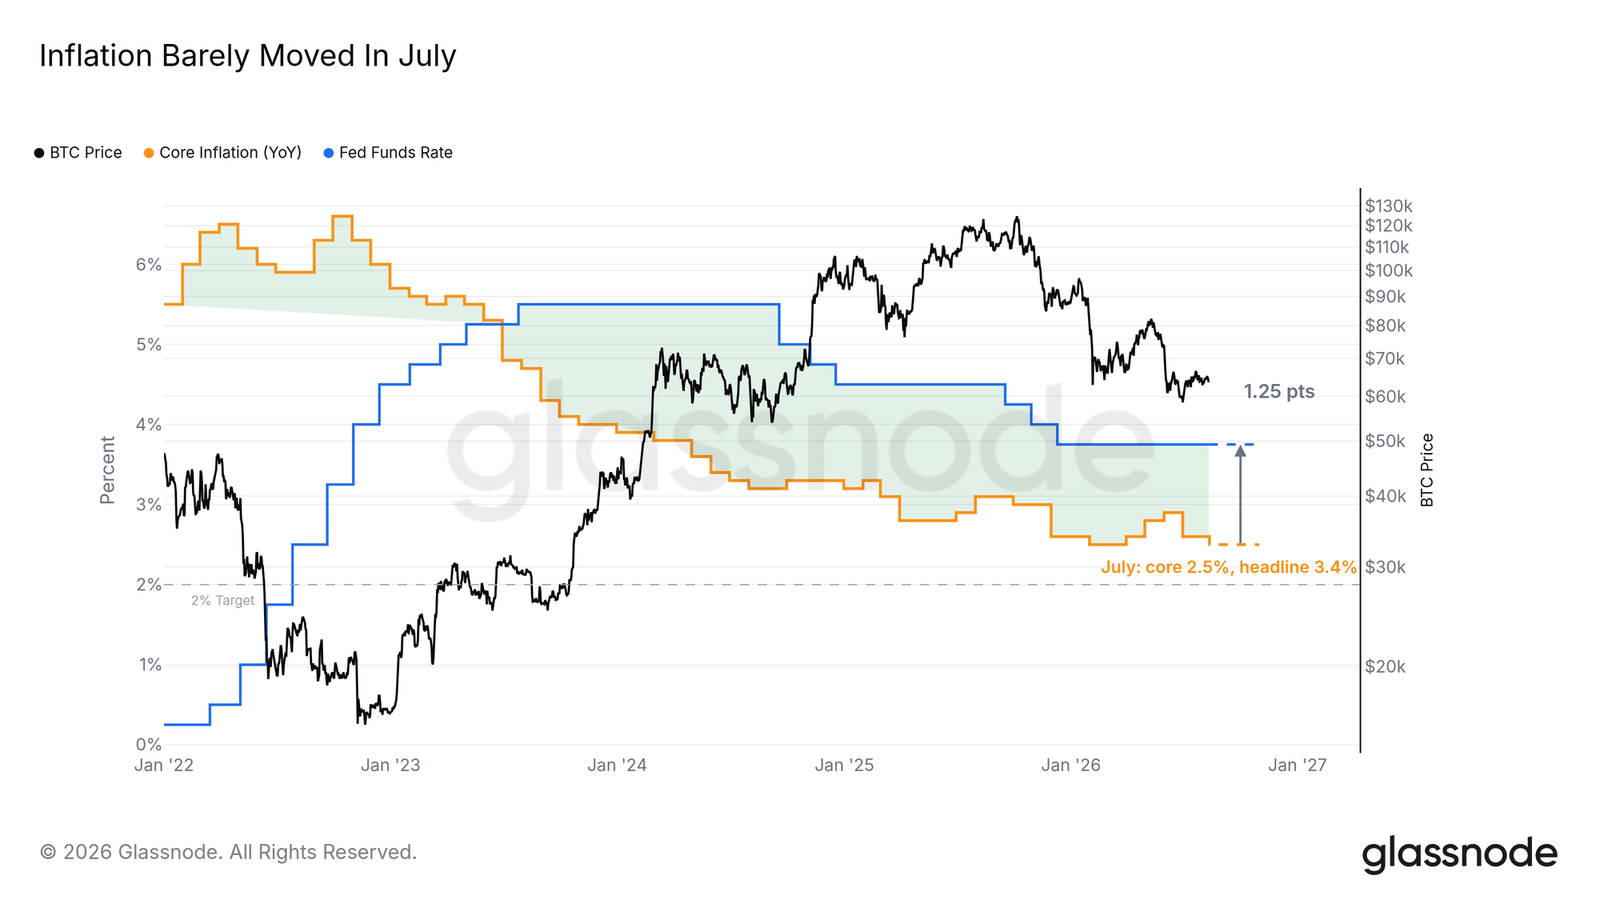
- July core CPI fell to 2.5%, U.S. stocks hit new highs, yet Bitcoin weakened against the trend. Being indifferent to positive news is itself a warning.
- Price is trapped between $63,000 (median realized price) and $68,700 (short-term holder cost basis), with spot trading volume at its lowest since 2019.
- Sellers are trending toward exhaustion: the proportion of supply in profit is approaching historical bear market bottom territory, and the breakeven line has rejected rebounds nine times.
- Buyers remain absent: ETF inflows are negligible, and coins continue to flow into exchanges.
- Leveraged capital is excessively long on top of razor-thin buy-side liquidity. Resistance above is at $68,700, support below is at $58,500.
Good News Keeps Coming, the Market Isn't Buying It
Cooling Inflation, Cold Market Response
This morning's July CPI data barely disturbed the market: core inflation fell 0.1 percentage points to 2.5%, while headline inflation held steady. With the policy rate unchanged since December last year, real rates remain in restrictive territory, and as inflation slowly declines, this gap is widening.
What's more concerning than the data itself is the market's reaction — hours after the release, Bitcoin saw almost no rebound, and U.S. stocks even slipped slightly. Steady inflation and unchanged policy should have provided a benign backdrop, and a healthy market should have interpreted this as a positive signal. If prices still cannot gain strength from this in the coming days, we will view it as confirmation of persistently absent demand. The same concern applies to the equity market.
Capital Flows into Assets, Not Bitcoin
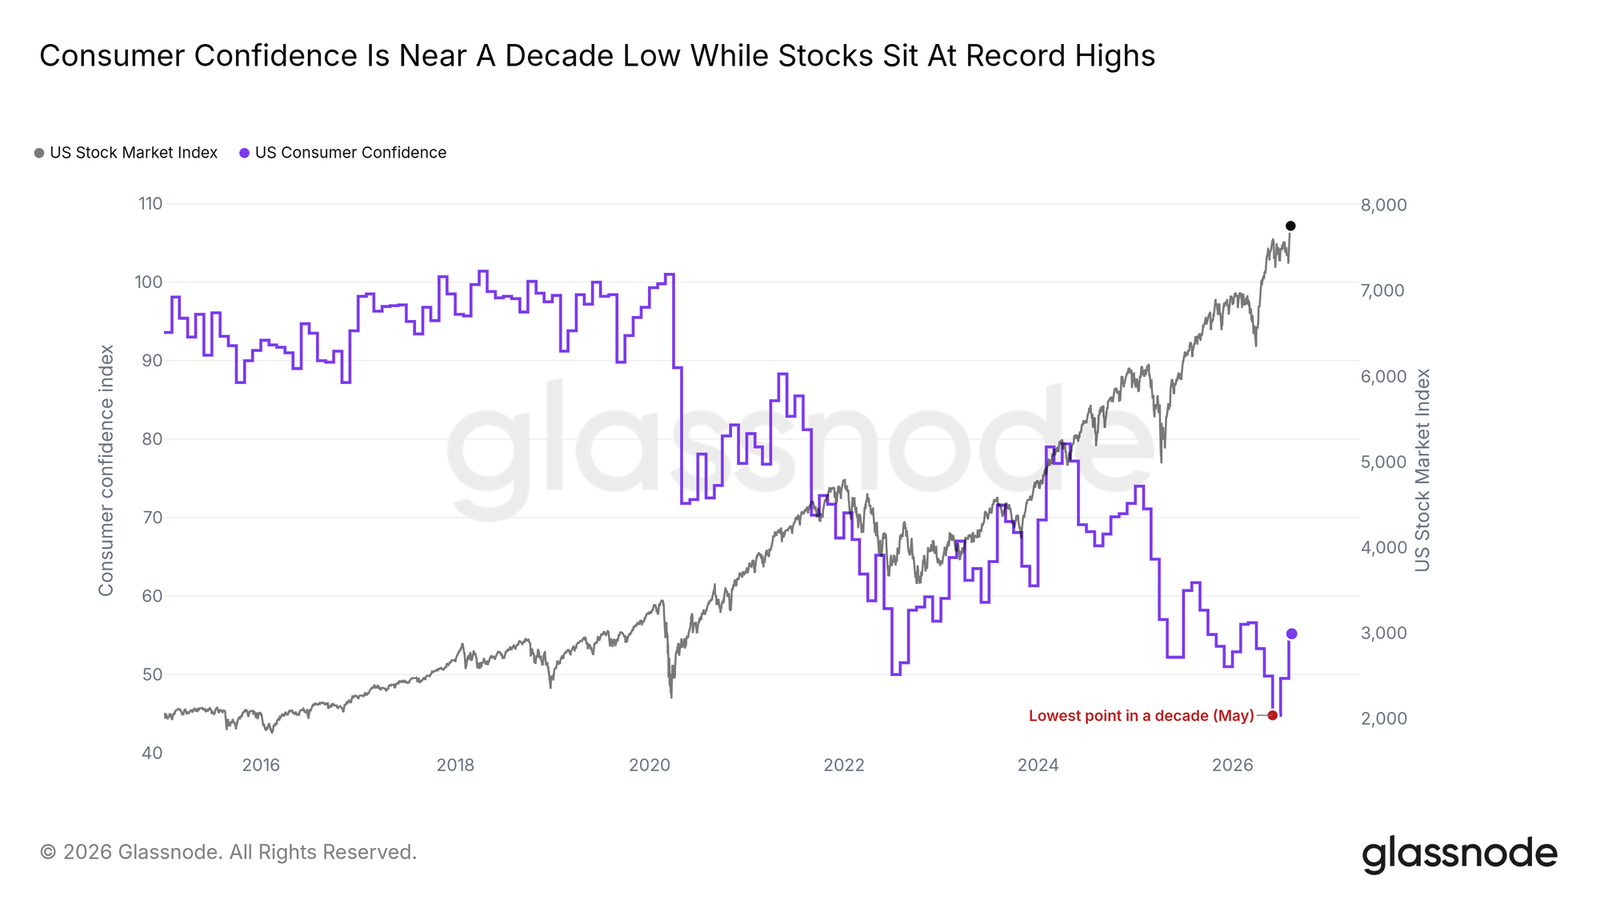
Consumer confidence has recovered for two consecutive weeks but remains in its weakest range of the past decade. Meanwhile, U.S. stocks hit an all-time high on August 7 and have held near those levels. The divergence between weak confidence and record prices is rooted in this: households, anticipating higher living costs and a weakening economic outlook, are shifting cash into assets — and the AI-trade-dominated U.S. stock market is the primary destination for these funds.
Bitcoin has been excluded from this rotation. Spot prices sit at roughly half of the October 2025 peak, and Bitcoin has consistently underperformed U.S. equities throughout the summer, despite its long-term narrative being built precisely on the logic of "capital flowing into scarce assets." Capital chases assets with existing momentum, and until some flows back, record-high U.S. stocks offer little support for Bitcoin. A turning signal will first appear in ETF flows — and the data below shows no signs of that yet.
The Market Is Compressed to the Limit
Trapped Between Two Cost Lines
The cost basis ladder is framing the current stalemate. Spot prices are barely holding above $63,000 (the median realized price) — the midpoint of the network-wide cost basis — while remaining below $68,700 (the short-term holder cost basis), the average entry price for recent buyers. This cohort is already underwater and has historically sold quickly on any rebound; the median level has absorbed multiple top-down tests over the past month or so.
Price has been oscillating within this range for nearly three months, with the two cost lines gradually converging as volatility contracts. Below, the network-wide realized price sits at approximately $52,800, indicating that the average coin still holds considerable profit, and the overall market in this cycle has never been fully underwater. Sustained reclaim of $68,700 would return recent buyers to profitability and pose the first real test of overhead supply pressure; losing the median level would leave virtually no structural support before the June lows.
The Quietest Tape Since 2019
The same compression is visible in activity levels. This report has tracked the volume contraction trend for several consecutive issues, and the current situation is even more extreme: spot exchange volume, measured in coins rather than dollars, has fallen to the lowest level since this data series began recording in early 2019; even excluding Binance, current volume is barely tracking the 2023 bear market lows. Never in seven years have so few Bitcoins changed hands — this is the clearest illustration of market apathy.
Such a thin tape amplifies the power of whichever side moves first: modest demand can push prices up, modest supply can break support. Extremely low participation rarely persists, and this is typically a classic prelude to volatility expansion. Below, we weigh which side is more likely to move first.
Sellers Are Exhausting
Bottom Signals Gradually Emerging
Two long-term bear market indicators are approaching bottom territory. Only slightly more than half of the network-wide circulating supply still holds unrealized profit, with the June low landing right at the upper bound of where the past four bear markets ended; the circles in the chart mark where previous bottoms went deeper.
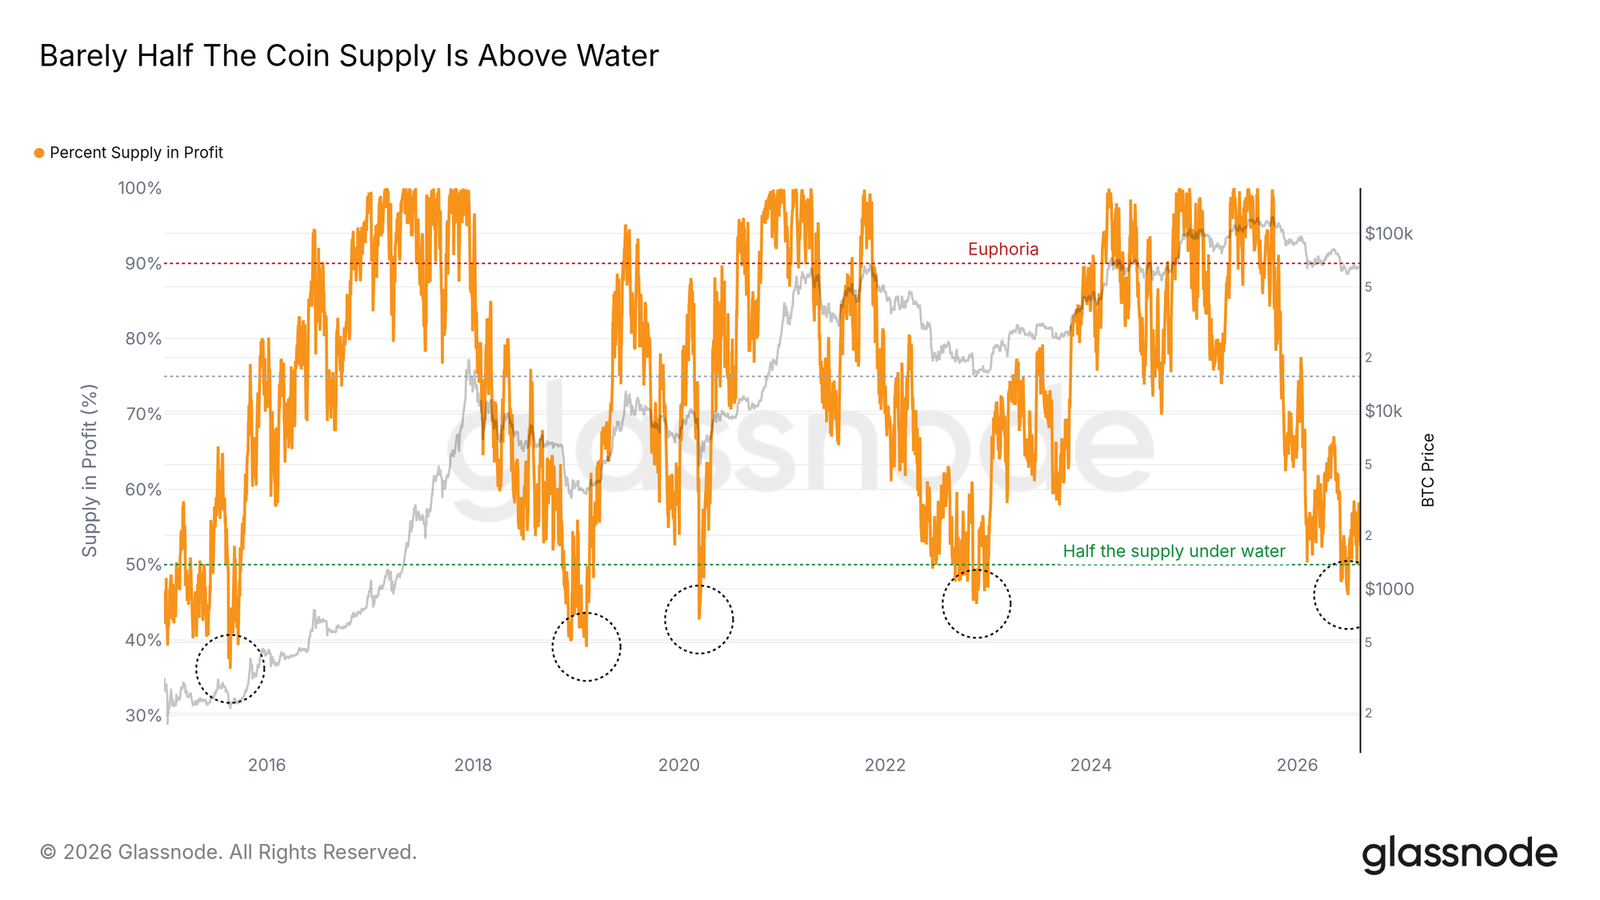
The Seller Exhaustion Constant (combining supply in profit and volatility to identify when sellers capitulate) has ground down to this cycle's low, one of the weakest readings since 2013, but still above all previous final bottoms. Sellers are clearly spent, yet the final capitulation that ended previous bear markets has not occurred. Last week we described this pullback as "boring capitulation" rather than "painful capitulation" — one painful purge would complete the historical pattern, while the alternative path is time: bottoming can last longer than anyone expects.

Breakeven Line Has Rejected Nine Times
The adjusted SOPR (the ratio of sale price to purchase price for actual on-chain spending) has been slightly below 1.0 for most of this bear market, meaning coins moving are essentially being sold at cost. Since the October top, the 7-day average has returned to this line nine times, and all nine times sellers treated it as an exit opportunity. The market is still digesting overhead supply.
The previous two bear markets spent longer below the breakeven line and fell deeper, making this cycle relatively mild by comparison. A sustainable recovery would manifest as the ratio holding steadily above 1.0 during rebounds. Until then, sellers still hold this threshold.
Buyers Remain Absent
ETF Inflows Are But a Trickle
The ETF complex has stopped net selling. Late July saw net flows turn positive for the first time in months, but the scale is merely a fraction of any previous accumulation wave, with cumulative holdings well below the October peak. At such meager flow levels, a single day of redemptions can flip it negative.
We interpret this as apathy. The June outflow wave has been exhausted, removing one source of pressure, but the institutional buying that drove the 2024–2025 bull market has not returned. Every previous recovery began with a demand impulse visible in this chart — and today, there is none.
Coins Still Flowing into Exchanges
Meanwhile, supply keeps arriving. Net exchange position changes remain in inflow territory, with coins flowing into exchanges on most days this year. The pace has slowed to a fraction of the early June peak, consistent with the broader picture of seller exhaustion, but the direction is unchanged: coins are still moving toward venues where they can be sold.
Against a demand ledger that is essentially empty, even modest inflows carry weight. A normal market could absorb this with ease; but on the thinnest tape since 2019, without ETF buying to underpin prices, the same trickle of supply is enough to suppress prices.
The Market Is Not Waiting
Leverage Has Already Stacked Up High
Derivatives traders have shown no hesitation. On Hyperliquid, whale accounts have maintained net long positions daily since mid-March, unprecedented in the data's brief one-year history, with positions peaking when prices hit the top of the range in mid-July. A cohort that was consistently short through the second half of 2025 flipped long in March and has been adding through the range-bound grind.
Nothing in the spot or flow data validates this conviction. Adding leverage early concentrates risk precisely in the most vulnerable position if the range fails.

Heavy Ledger, Thin Tape
Pressure is visible at the aggregate level as well. Futures open interest has surpassed an entire day's worth of futures volume, approaching the record set last September; that same ledger in 2019–2020 turned over roughly three times daily. Position sizes keep swelling while participation keeps drying up, with large amounts of stale contracts piling up on a quiet tape.
The risk is mechanical. When open interest far exceeds daily volume, liquidations encounter almost no standing liquidity to absorb them, and adverse moves get amplified to outsized degrees. Traders have accumulated significant risk in a market lacking matching demand, and they are predominantly long.

Bids Growing Ever Thinner
The order book delivers the final warning. The standing bid band that framed the summer range peaked in early July, has since shrunk by roughly a third, and support below the current price is weaker than when the lows were last tested. The ask side is equally thin, so the imbalance still appears tilted bullish, but absolute depth is eroding.
If the range is broken, a decline toward the June low of around $58,500 would land on a thinner order book than the one that caught price six weeks ago, while crowded longs overhead would provide downward momentum. Thin bids, heavy leverage, and historically low volume — the combination is sufficient to produce overshooting on the downside.
Conclusion
We are in a late-stage bear market compression phase,叠加an anomalous phenomenon: the crowd has already positioned for a recovery before demand has arrived. The sell side is constructive — supply in profit is near historical bottoms, seller exhaustion is at cyclical lows, and exchange inflows are moderating. The buy side remains empty, from negligible ETF flows to the coldest spot tape since 2019, with Bitcoin persistently underperforming record-high U.S. equities.
A high-volume reclaim of the short-term holder cost basis at $68,700, accompanied by ETF inflows, would confirm improvement signals. If this week's benign inflation data still fails to spark a rebound, or if price breaks below the $58,500 range low — on thin bids resonating with crowded longs — the bottom thesis would be invalidated. We remain cautious, and we remain patient.