Bitcoin’s short-term correction persists, HYPE approaches key support | Analyst's Take


- Key Thesis: Bitcoin’s daily wave B correction continues this week, with the focus on the validity of support in the $60,900–$61,500 key zone. If the price stabilizes in this area and holds above $63,600, wave B may conclude and initiate a wave C rebound. HYPE’s daily wave C has entered the key support zone of $50–$52, with repeated oversold signals indicating a near-term repair window, though direction remains unconfirmed.
- Key Factors:
- Bitcoin’s daily chart has shown a five-segment corrective structure since the May 6 high of $82,850. Wave A rebounded from the July 1 low of $57,820 to $66,955 (a 15.8% gain), while wave B has retraced to the 61.8% Fibonacci level of wave A (approximately $61,310), which largely satisfies technical requirements for the correction depth.
- The 4-hour chart shows wave B can be subdivided into six segments, forming an intermediate pivot F. The current segment is a rebound from (56-57). If the price effectively holds above $63,600 without breaking endpoint 56 ($62,268), the probability of wave B concluding rises significantly. Otherwise, further downside toward the $60,900–$61,500 zone is likely.
- Bitcoin’s trading strategy this week is split into medium-term and short-term approaches. Medium-term short positions are around 40%; if the price holds above $63,600, reduce to below 20%. For short-term trading, two plans (A and B) are provided, corresponding to entering long after holding above $63,600, or taking a light long position after stabilizing above $57,820, with position sizes around 30% in both cases.
- HYPE has been undergoing an A-B-C three-wave correction since the June 16 high of $76.94. Wave A fell 23.97%, wave B rebounded 24.74%, and wave C has run for 27 days, reaching a low of $51.11. It is currently in the key support zone of $50–$52, with the proprietary model continuously triggering bottom warning signals.
- HYPE short-term trading suggestions: If a stabilization signal emerges in the $50–$52 zone, consider a light long position with position size capped at 20% and strict stop-losses. Key resistance levels are $58.5–$60, $63.5–$66, and $72.97 in sequence.
- Last week’s Bitcoin short-term short trade (1x leverage) generated a profit of approximately 2.58%. The entry was based on stagnation signals near $65,700 aligned with model top warnings, while the exit was driven by stabilization signals above $62,000 and model bottom resonance, with a 30% position size.
This week, Bitcoin's daily-level wave B correction continued, with the price dipping to the $62,268 area. Whether it can find support in the key $60,900–$61,500 zone is the core validation for this week's structure. Meanwhile, HYPE is trading in the $50–$52 key support zone at the tail end of the daily-level wave C, with oversold signals having triggered repeatedly. A short-term repair window is approaching, but the direction has yet to be confirmed. The following is a multi-timeframe structural review and trading strategy for BTC and HYPE this week, along with market validation of last week's short-term trades, for your reference.
Key Trading Takeaways for This Week:
• BTC multi-timeframe price structure analysis (detailed in Part 1)
• BTC price forecast for this week and medium/short-term trading strategy (detailed in Part 2)
• HYPE daily-level price structure analysis (detailed in Part 3)
• HYPE price forecast for this week and short-term trading strategy (detailed in Part 4)
Market Validation of Last Week's Trading Strategy and Key Views:
• BTC price movement forecast validated: Last week's article explicitly noted monitoring the support strength when the price tested the $60,950–$61,500 zone. As it turned out, the price stabilized and rebounded near the low of $62,268, confirming our forecast.
• BTC short-term trade performance: Bitcoin completed one short trade (1x leverage) last week, capturing a gain of approximately 2.58%. (Detailed in Part 5)
• HYPE price movement forecast validated: In last week's analysis, we presented two technical paths for HYPE's subsequent movement. The market's actual price action closely aligns with the second path—namely, the scenario in which the correction did not conclude at $56.47, and the price instead built a lower consolidation center before continuing to probe lower.
1. Bitcoin Multi-Timeframe Structure Analysis
1.1 Bitcoin Daily-Level Structure Analysis: (Based on price action after May 6)
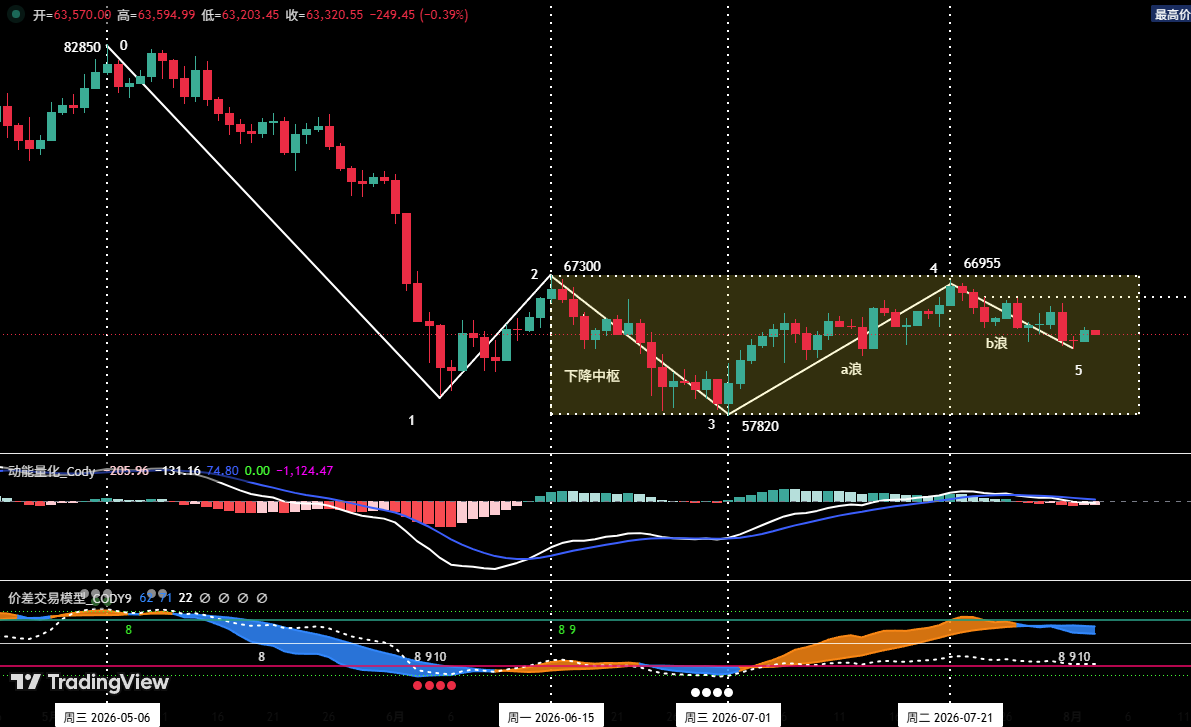
Figure 1 Bitcoin Daily Candlestick Chart
① As shown in Figure 1, the correction that began from the May 6 high of $82,850 has formed a five-segment corrective structure on the daily chart: (0-1), (1-2), (2-3), (3-4), and (4-5).
② From a daily structure perspective: (Since the July 1 low rebound)
• Wave A rebound: From July 1 (approximately $57,820) to July 21 (approximately $66,955), spanning 21 days, with a maximum gain of approximately 15.8%.
• Wave B correction: From July 21 (approximately $66,955) to present. It has been running for 12 days, reaching a low of $62,268. The current retracement depth has approached approximately 61.8% of wave A's rebound (with the Fibonacci retracement level at approximately $61,310). Therefore, from a magnitude perspective, the wave B correction has largely satisfied its technical requirement.
• Potential wave C rebound: Once the wave B correction concludes (with the prerequisite that the correction low does not break below wave A's low of $57,820), the market is expected to initiate a potential wave C rebound, which could challenge the resistance zone near $67,300 again.
1.2 Bitcoin Hourly-Level Structure Deep Dive: (Using the 4-hour timeframe) 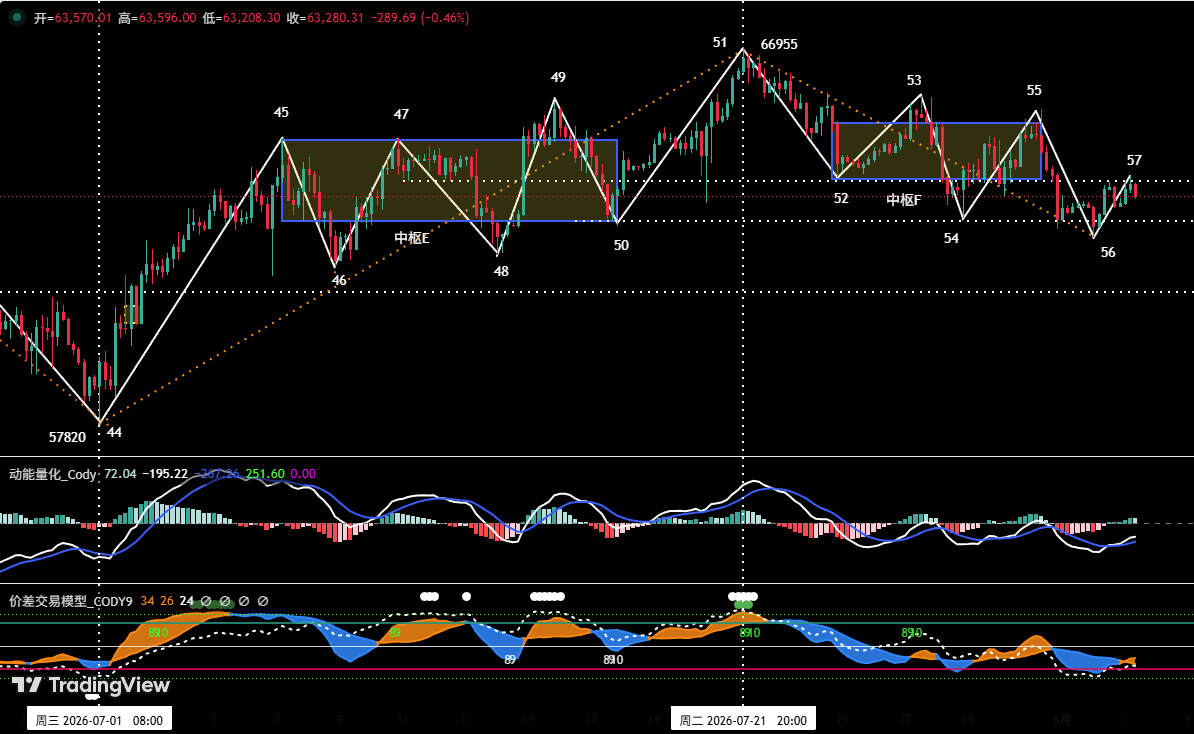
Figure 2 Bitcoin 4-Hour Candlestick Chart
① On the 4-hour chart, the daily-level wave B correction that began from the July 21 high (Endpoint 51, approximately $66,955) can be clearly divided into six segments from (51-52) to (56-57). Among these, segments (52-53), (53-54), and (54-55) overlap, forming Consolidation Center F.
② The market is currently running the (56-57) rebound segment. If the price does not break below "Endpoint 56" and holds above $63,600 before staging a sustained rebound, the probability that the daily wave B correction concludes at "Endpoint 56" (approximately $62,268) is significant. Otherwise, the market may continue to probe lower, with key focus on support in the $60,900–$61,500 zone.
2. Bitcoin Price Forecast and Trading Strategy for This Week
2.1 BTC Price Forecast for This Week:
Core view for this week: Closely monitor whether the daily wave B correction concludes above the key $60,900–$61,500 zone, with the prerequisite that the correction low does not break below $57,820.
2.2 Key Resistance Levels:
• First resistance zone: Near $63,600 (previous key resistance area)
• Second resistance zone: $65,700–$67,300 area (previous key resistance area)
• Third resistance zone: $69,500–$71,000 area (previous key resistance area)
2.3 Key Support Levels:
• First support level: $60,950–$61,500 zone (previous key support area)
• Second support level: Near $57,820 (previous key support level)
2.4 Trading Strategy for This Week (Excluding Impact of Unexpected News)
① Medium-term strategy:
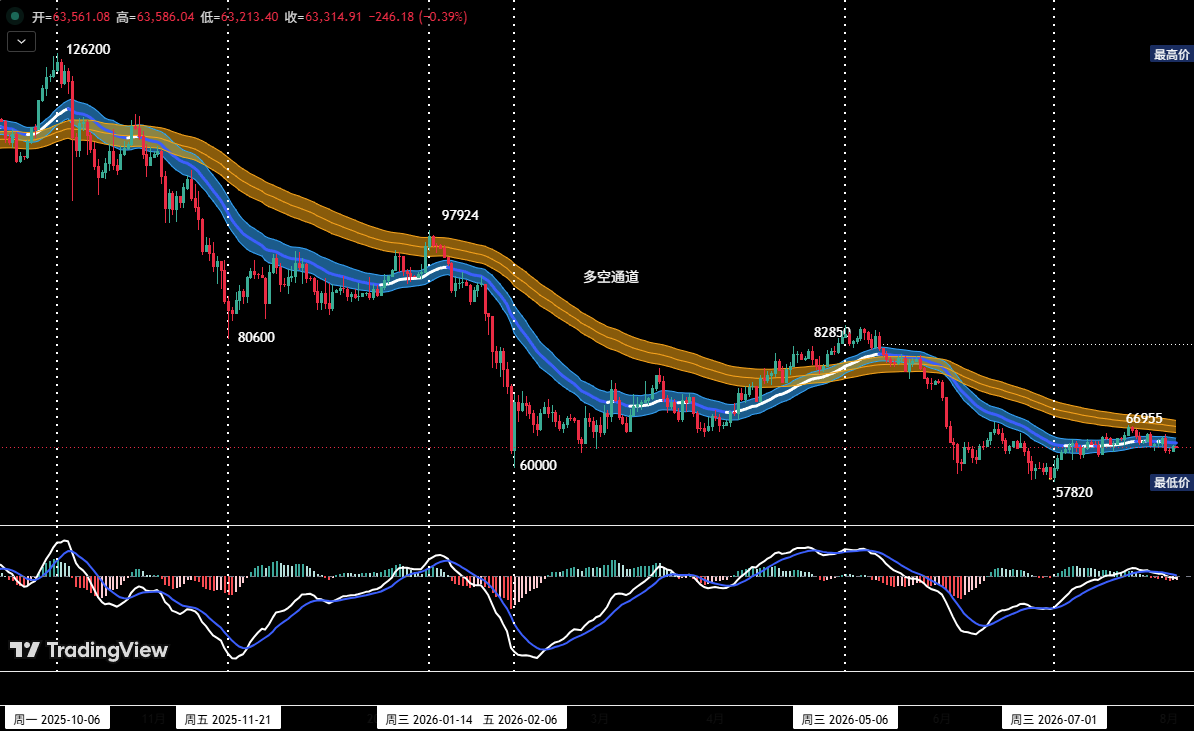 Figure 3 Bitcoin Daily Candlestick Chart: (Position Monitoring Model)
Position Monitoring Model: As shown in Figure 3, the price has effectively broken below the "long/short channel," confirming a shift in market structure to a bearish-dominant regime. The current medium-term short position stands at approximately 40%.
If the price holds above $63,600 and stages a sustained rebound, it is recommended to reduce the medium-term short position to below 20%.
② Short-term strategy: Use 30% of the position with a stop-loss in place, seeking "spread" opportunities based on support and resistance levels. (Using the 30-minute/60-minute timeframe as the operating cycle).
③ For short-term trading, to dynamically respond to complex market developments, we have pre-drafted two specific trading plans: Plan A and Plan B.
• Plan A: Tentatively go long after a valid hold above the core support level.
• Entry: If the price continues to rebound early in the week and holds validly above $63,600, combined with quantitative model signals, establish a long position of approximately 30%.
• Risk control: Set an initial stop-loss.
• Exit: When the price reaches key resistance zones and quantitative model signals align, gradually close the position to lock in profits.
• Plan B: Light long position in the strong support zone.
• Entry: If the price continues to correct and shows signs of stabilization above the previous low of $57,820, combined with bottom signals from the quantitative model, establish a long position of approximately 30%.
• Risk control: Set an initial stop-loss.
• Exit: When the price rebounds to key resistance levels and model signals align, gradually close the position to lock in profits.
3. HYPE Daily-Level Structure Analysis
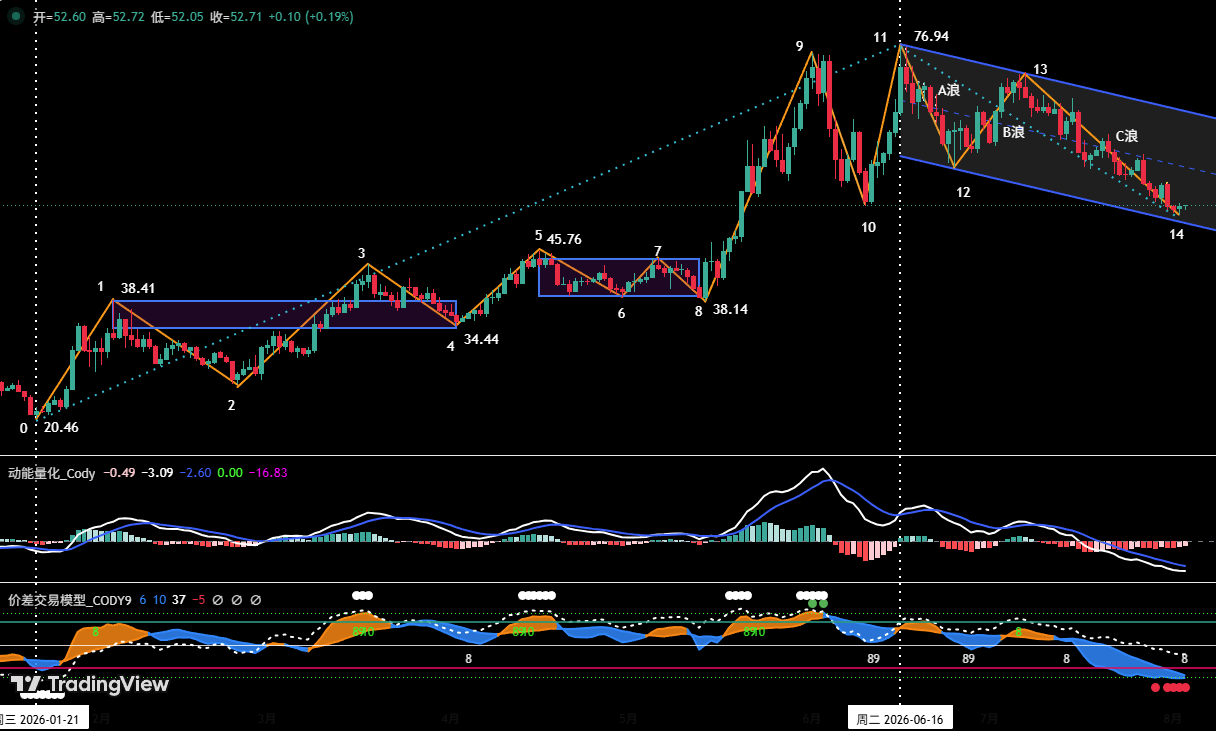
Figure 4 HYPE Daily Candlestick Chart
3.1 As shown in Figure 4, the correction in HYPE that began from the June 16 high of $76.94 has clearly presented an A-B-C three-wave correction structure on the daily chart. Specifically:
① Wave A (Decline): From the June 16 high (approximately $76.94) to the June 25 low (approximately $58.50), spanning 9 days, with a cumulative decline of 23.97%.
② Wave B (Rebound/Repair): From the June 25 low (approximately $58.50) to the July 7 high (approximately $72.97), spanning 12 days, with a rebound of 24.74%.
③ Wave C (Decline): Initiated from the July 7 high (approximately $72.97), has been running for 27 days, with the price reaching a low of $51.11 during this period.
3.2 At present, wave C on the daily chart has descended into the key $50–$52 support zone. Given the prolonged correction, multiple technical indicators have entered oversold territory. Our proprietary "Spread Trading Model" has triggered bottom warning signals (red dots) consecutively, suggesting a short-term technical repair is due. Therefore, chasing shorts at current levels is not advisable. It is recommended to patiently wait for a confirmed signal of a daily-level wave D repair rally.
4. HYPE Price Forecast and Short-Term Trading Strategy for This Week
4.1 HYPE Price Forecast for This Week:
① Key resistance levels:
• First resistance level: $58.5–$60 zone
• Second resistance level: $63.5–$66 zone
• Third resistance level: Near $72.97
② Key support levels:
• First support level: $50–$52 zone
• Second support level: Near $45
Core view for this week:
Closely monitor the price's test of support strength in the $50–$52 zone.
4.2 HYPE Short-Term Trading Strategy for This Week:
For short-term trading this week:
If the price shows signs of stabilization in the $50–$52 zone, investors may consider entering a light long position, strictly adhering to stop-loss discipline, with position size controlled within 20%.
5. Bitcoin Short-Term Trade Review
We strictly followed the trading plan, acting on signals generated by our proprietary "Spread Trading Model" and "Momentum Quant Model." Last week, we completed one short-term (short) trade, with total trading profit of approximately 2.58%.
5.1 Short-Term Trade Record: (See Table 1)
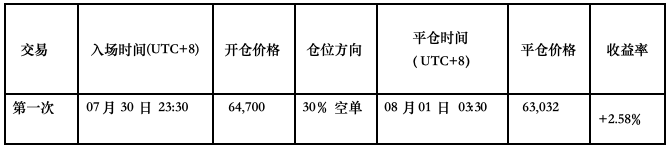
Table 1 Bitcoin Short-Term Trade Details Summary: (1x leverage)
5.2 Short-Term Trade Review: (See Figure 5)
• Entry strategy:
a. When the price rebounded to near $65,700, a stall signal appeared, with the candlestick forming a "top fractal" pattern;
b. The "Spread Trading Model" triggered a strong top warning signal (white dot + green dot), followed by the signal band (blue) in the chart breaking below the skyline (green), issuing a downtrend signal; this was simultaneously reinforced by an adjustment signal from the "Momentum Quant Model."
Therefore, we established a 30% short position at $64,700.
• Exit strategy:
a. When the price fell to above $62,000 and showed stabilization signals, the candlestick formed a "bottom fractal" pattern;
b. The "Spread Trading Model" triggered consecutive bottom warning signals (white dot + red dot), followed by the signal band (orange-yellow) breaking above the horizon line (magenta), forming a bottom resonance signal with the "Momentum Quant Model."
Therefore, we closed the entire position near $63,032.
• Summary: This trade yielded a profit of approximately 2.58%.
5.3 Short-Term Trade Chart
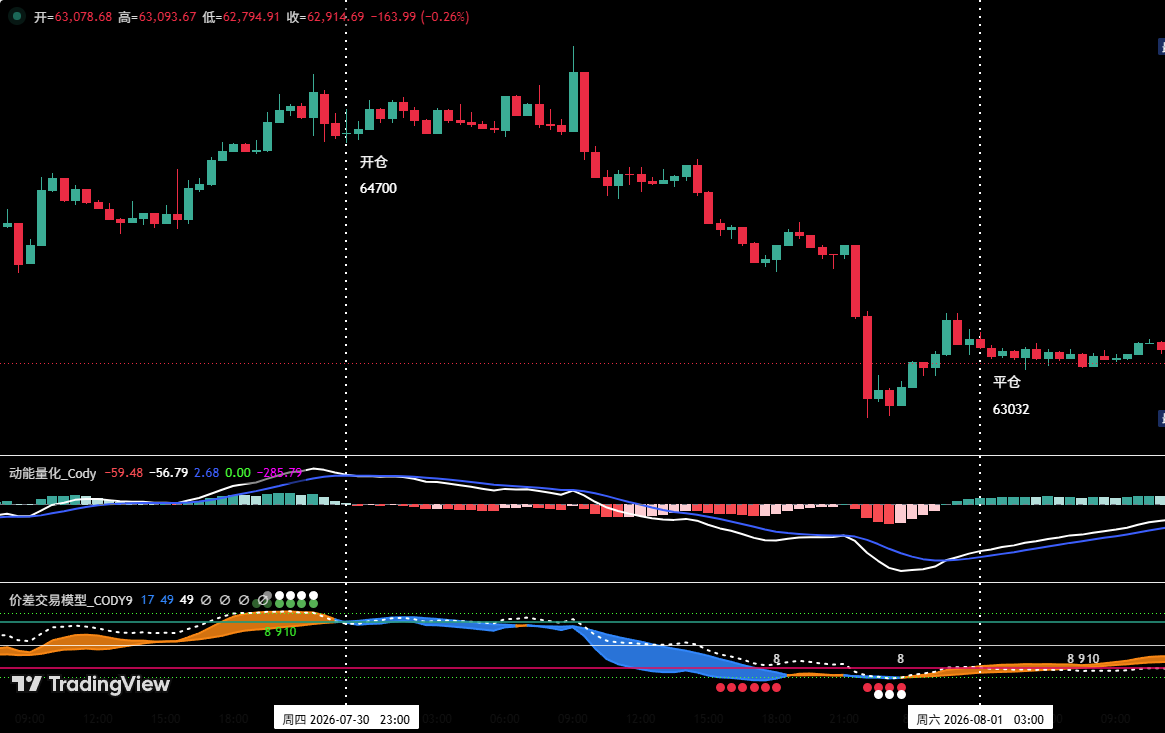
Figure 5 BTC 30-Minute Candlestick Chart: (Momentum Quant Model + Spread Trading Model)
6. Special Reminders:
1. On entry: Immediately set an initial stop-loss.
2. When profit reaches 1%: Move the stop-loss to the entry cost price (break-even point) to protect principal.
3. When profit reaches 2%: Move the stop-loss to the 1% profit level.
4. Continuous tracking: For every additional 1% profit thereafter, move the stop-loss up by 1% in tandem, dynamically protecting and locking in gains.
Financial markets change rapidly, and all market analysis and trading strategies require dynamic adjustment. All views, analytical models, and trading strategies presented in this article are derived from personal technical analysis and serve solely as personal trading logs. They do not constitute any investment advice or basis for trading decisions. Markets carry risk, and investment should be undertaken with caution. Please do not make decisions solely based on this content.