BitMart VIP Insights | June Crypto Market Review and Hotspot Analysis


- Core View: In June 2026, the global macro environment presented a contradictory pattern of "geopolitical easing but persistent inflation." Expectations for rate cuts have cooled, while rate hike expectations have intensified, creating sustained downward pressure on the crypto market. Major assets like BTC and ETH experienced significant monthly declines, with continuous net capital outflows and tightening market liquidity.
- Key Factors:
- On the macro front, May CPI remained elevated at 4.2% year-over-year, non-farm payrolls increased by 172,000, exceeding expectations, and the Fed's hawkish signals strengthened, putting pressure on risk asset valuations in a high-interest-rate environment.
- The crypto market declined overall, with total market capitalization dropping approximately 16.1% in June. BTC fell 18.4% monthly, closing around $60,000; ETH fell 25% monthly, underperforming BTC; SOL was relatively resilient, declining 9.5% in the month.
- Funding conditions tightened, with the total supply of major stablecoins decreasing by approximately $7 billion (-2.5%) during the monitoring period. The net asset value of BTC ETFs shrank by a magnitude (-22.3%) exceeding the spot price decline (-18.5%), indicating active institutional redemptions.
- Key market events included the Strategy trust crisis (coin selling, stock price decline), the Zcash vulnerability (supply credibility questioned), valuation pressure on SpaceX post-listing, and Warsh's first FOMC meeting delivering a hawkish signal.
- Market focus in July will be on whether the CLARITY Act can secure 60 votes in the Senate to pass, whether June CPI data will confirm inflation is easing, and whether US-Iran negotiations can shift from "technical openness" to "commercial openness."
 Key Takeaways:
- The core macroeconomic contradiction in June globally was that the US-Iran ceasefire pushed down oil prices, easing energy pressures. However, US inflation, employment, and consumption data remained relatively strong. Coupled with Warsh's hawkish signals at his first FOMC meeting, expectations for rate cuts cooled significantly while expectations for rate hikes heated up again. The May CPI and PCE remained high, non-farm payrolls added 172,000, the unemployment rate held at 4.3%, and the ISM price indices surged sharply. This indicates the US economy is still in a "high inflation + strong employment + resilient consumption" combination, leaving the Fed with almost no room to pivot towards easing in the short term. At the asset level, BTC, US tech growth stocks, and high-valuation AI sectors were all suppressed by expectations of higher interest rates. Although the semiconductor sector saw a structural rebound driven by Micron's earnings, market focus has shifted from "explosive AI demand" to "the ability of AI to realize profits," keeping overall risk asset valuations under pressure.
- In June, the crypto market saw two brief surges in trading volume that quickly subsided, resulting in overall low liquidity, primarily driven by specific events. Total market capitalization fell by approximately 16.1% for the month, with continuous net capital outflows. Newly listed tokens also performed weakly. Only ARX and RE garnered short-term attention due to popular narratives, but their high valuations and turnover rates indicated strong speculative characteristics.
- In June, BTC and ETH spot ETFs faced pressures but showed clear divergence: BTC ETF net assets shrank more than the spot price decline, indicating active institutional redemptions beyond price depreciation. In contrast, ETH ETF net assets remained largely stable, suggesting that ETH's decline was more attributable to selling pressure on-chain and in the derivatives market. For stablecoins, from May 25 to June 26, the total supply of major stablecoins decreased by approximately $70 billion. Centralized stablecoins like USDT, USDC, and PYUSD saw significant contraction, reflecting tightening market liquidity. However, DAI grew against the trend, indicating continued demand support from on-chain lending.
- Major coins weakened overall in June. BTC fell from around $74,000 to approximately $60,000, a monthly decline of about 18.4%, primarily driven by ETF outflows, stablecoin contraction, waning institutional confidence, and the high-interest-rate environment. Short-term focus is on resistance at $65,000–$66,000 and support at $58,000–$60,000. ETH underperformed BTC with a monthly decline of about 25%, with key resistance at $1,700–$1,780 and important support at $1,500. SOL was relatively resilient, declining about 9.5% for the month, with strong support at $65–$69. Whether it can reclaim the $82–$84 level will determine if the trend reverses.
- Key market events in June included the Strategy trust crisis, the Zcash vulnerability, SpaceX's post-IPO valuation pressure, and Warsh's hawkish signals at his first FOMC meeting. Strategy's pressure stems from BTC falling below its cost basis, preferred stock trading at a discount, small BTC sales, and lawsuits/investigations. The key to recovery lies in whether BTC can return above $75,000. Zcash faced supply credibility concerns due to a privacy pool vulnerability. SpaceX faced simultaneous pressure on its stocks and bonds due to high valuation and cash flow pressures. Warsh's hawkish stance further suppressed valuations of risk assets like BTC and AI growth stocks.
- Three key events to watch in July: whether the CLARITY Act can surpass the 60-vote threshold in the Senate, whether the June CPI will verify a decline in inflation, and whether the US-Iran MOU can transition from "technical opening" to "commercial opening" for the Strait of Hormuz. If the CLARITY Act fails to advance to a full floor vote in July, the probability of it passing within the year will significantly decrease. On the macro front, falling oil prices may help ease headline inflation, but core inflation remains stubborn. The July FOMC is likely to hold rates steady at 3.50%–3.75%. However, if US-Iran negotiations change, a rebound in oil prices could reignite inflationary pressures.
1. Macro Perspective
The core narrative for global macro markets in June was a fierce tug-of-war between two opposing forces within the same time window: a phase of geopolitical de-escalation brought a rapid decline in energy costs, while the hawkish debut of new Fed Chair Warsh simultaneously pushed up expectations for the interest rate path. The constant pull between these forces plunged global risk assets into a pattern of high-volatility fluctuations.
On the inflation front, the US Bureau of Labor Statistics reported on June 10 that the May CPI rose 4.2% year-over-year, the highest in three years. Core CPI was 2.9% year-over-year, and the energy component had surged 23.5% year-to-date. The persistent impact of the Middle East geopolitical conflict on the supply side was fully transmitted to consumers. Meanwhile, the May PCE data released at the end of June further reinforced inflationary pressures – headline PCE was 4.1% year-over-year, core PCE hit a three-year high of 3.4% (month-over-month +0.3%). Coupled with Q1 GDP revised up to 2.1%, personal income and spending both accelerating by 0.7%, yet the savings rate falling to a low of 3.0%, the combination of "high inflation + resilient consumption" left the Fed with virtually no policy room to cut rates. New York Fed President Williams stated bluntly at the end of the month that inflation was "unambiguously high," pushing back the timeline for the 2% target to 2028 and raising the end-2026 inflation forecast to 3.5%. This essentially signaled to the market that the current relatively tight policy stance would persist far longer than anyone anticipated.
On the employment front, the May non-farm payrolls report released on June 5 showed an increase of 172,000, far exceeding the market expectation of 80,000. Data for March and April were revised up by a combined 93,000. The unemployment rate remained unchanged at 4.3%. The ISM Manufacturing PMI came in at 54.0, and Services PMI at 54.5, but the price indices surged to 82.1 and 71.3 respectively, revealing a stagflationary characteristic of "strong employment + high costs," further blocking any logical path for the Fed to pivot towards easing.
On the geopolitical front, US-Iran negotiations achieved their most significant breakthrough of the month in June. A Memorandum of Understanding was announced by Trump on June 14 and formally signed on June 19 – Trump signed it during the G7 summit at Versailles, while Iranian President Pezeshkian simultaneously signed in Tehran, ending the military conflict that began on February 28. The framework is clear: the Strait of Hormuz must remain open, Iran's nuclear program must be fully dismantled, nuclear materials must be removed from the country, and Iran must stop funding regional armed groups. In return, the US commits to gradually unfreezing funds after Iran completes all its terms. However, the gap between "technical opening" and "commercial opening" remains evident: approximately 500 commercial vessels remain stranded inside and outside the Persian Gulf, war risk insurance premiums are still as high as 1%–4% of vessel value. The shipping industry describes the current situation with the phrase "cautious welcome." On the oil price front, Brent fell to $78.96 and WTI to $76.05, a monthly drop of over 17%, erasing all the premiums gained during the war. However, Rystad Energy warns that restarting oil production and logistics infrastructure during the ceasefire negotiation phase still takes time, with permanent daily demand loss potentially between 200,000 and 600,000 barrels. Notably, a drone attack targeted a cargo ship flying the Singapore flag at the end of the month. The International Maritime Organization subsequently suspended the evacuation of commercial vessels in the Persian Gulf, reminding the market that geopolitical risks have not been entirely eliminated within the 60-day technical negotiation framework.
US stocks experienced a "narrative shift" in June. At the start of the month, the AI narrative and tech earnings expectations still supported major indices at high levels. However, following the strong May jobs report and high inflation data, the Nasdaq fell 4.61% in a single week, and the S&P 500 fell 2.62%. The discount pressure on high-valuation growth stocks suddenly intensified. At the end of the month, strong earnings from Micron (rising as much as 19% intraday) led the SOX semiconductor index to surge 3.6%. Capital rotated from large-cap tech stocks towards upstream memory, HBM, and optical communications. The market narrative shifted from "AI demand explosion" to "who in the AI supply chain can truly realize profits," exacerbating structural divergence within the tech sector. Apple announced it would skip the high-end M6 Pro/Max roadmap and raise prices across its product line, causing its stock to plunge 6.1%. OpenAI delayed its IPO to 2027 to maintain its trillion-dollar valuation. Both point to the same core issue: the market is beginning to question the return timeline and valuation rationality of AI investments. Gold lost the $4,000 level under the dual pressure of a strong dollar and rising real interest rates, oscillating near that level for several days, indicating marginally diminished safe-haven appeal. The 10-year Treasury yield rose to 4.536%, and the 30-year yield approached 5.0%.
2. Crypto Market Overview
Token Data Analysis
Trading Volume & Daily Growth Rate
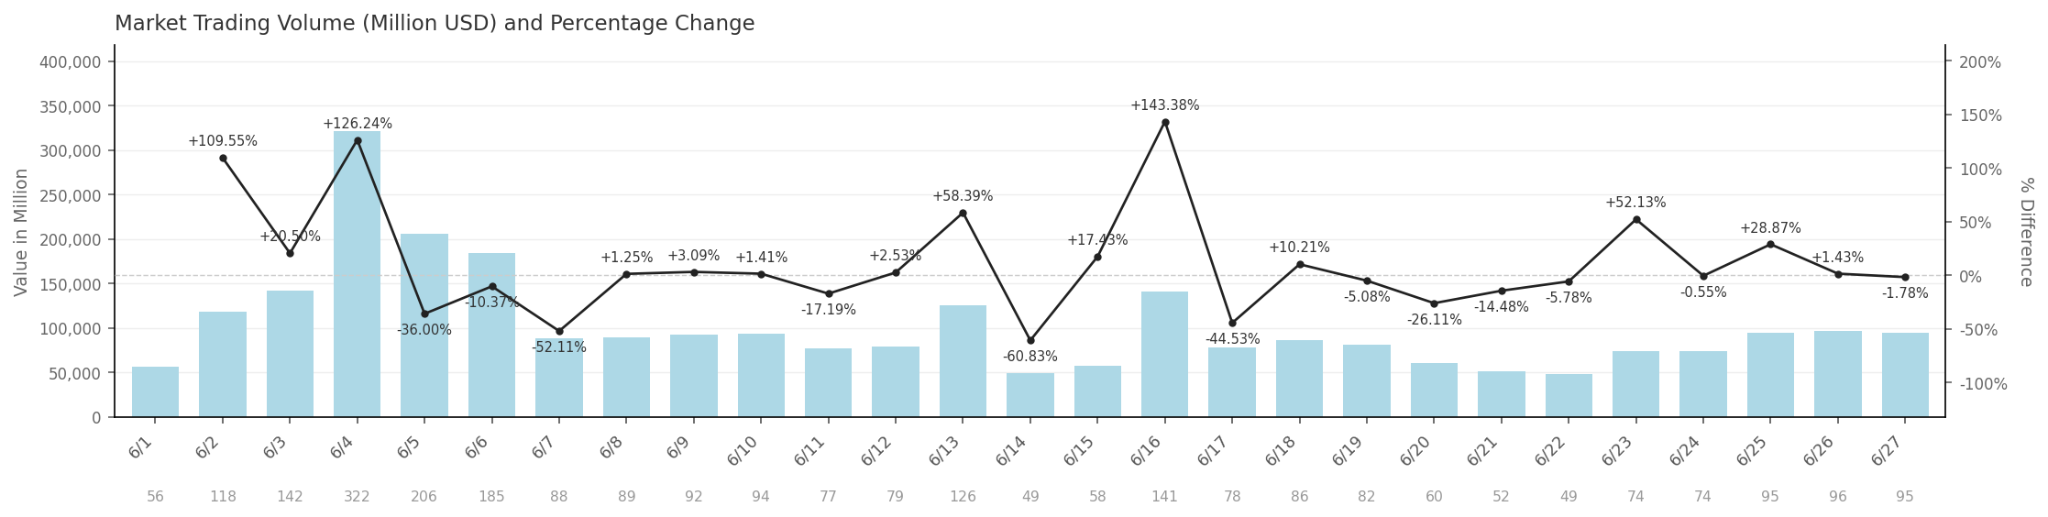
The cryptocurrency market's trading volume in June showed an overall "high-open oscillation" pattern. At the beginning of the month, on June 1, volume was only about $56 billion, a relatively low point. However, it then surged to a monthly peak of $321.6 billion on June 4, a single-day sequential increase of 126.24%, indicating a strong short-term trading sentiment. Subsequently, volume contracted rapidly, falling back to $88.3 billion by June 7 (-52.11%), entering a period of relatively stable low volatility. A second significant contraction occurred on June 14, dropping to $49.3 billion (-60.83%), followed by another volume surge on June 16 to $140.8 billion (+143.38%), forming a second volume high for the month. In the second half of June, volume generally narrowed, oscillating within a range of $49 billion to $96 billion, closing the month on June 27 at approximately $94.5 billion. Overall, the two volume surges in June (6/4 and 6/16) were impulsive and lacked sustainability, reflecting that market participants' emotions rapidly faded after short-term event-driven activity, indicating overall liquidity was not abundant.
Total Market Cap & Daily Growth
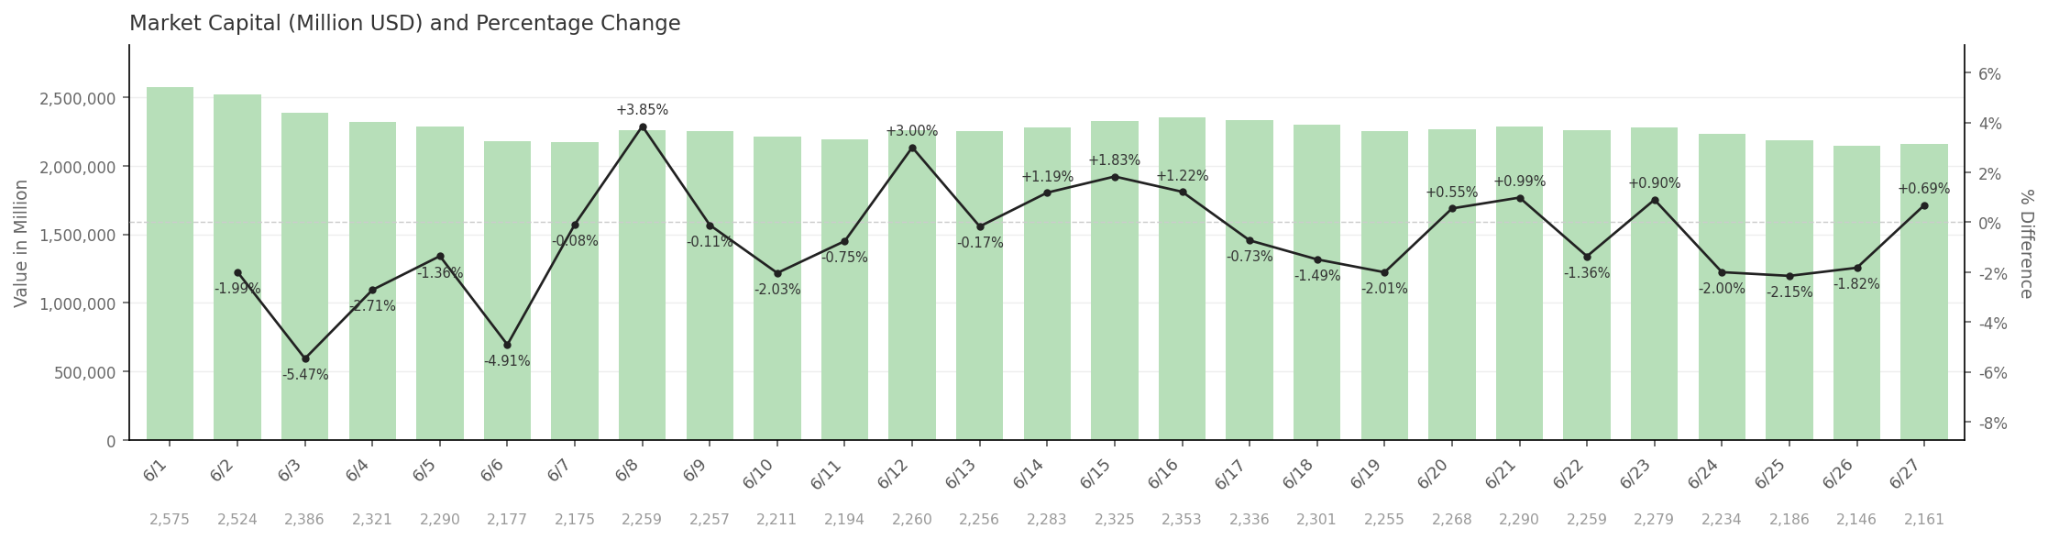
The total cryptocurrency market capitalization in June showed a clear unilateral downward trend, with a cumulative monthly decline of approximately 16.1%. The market cap started the month at around $2.575 trillion and continued to face downward pressure. The largest single-day declines occurred on June 3 (-5.47%) and June 6 (-4.91%), accelerating the market cap shrinkage. Despite several brief rebounds during the period, such as on June 8 (+3.85%), June 12 (+3.00%), and a continuous slight recovery from June 15 to 16, none were able to reverse the overall downward direction. The rebounds were limited in strength and short in duration. The market cap touched its monthly low of approximately $2.146 trillion on June 26, before recovering slightly to $2.161 trillion on June 27 (+0.69%). The overall trend indicates that the market was under significant bearish pressure in June. Buying power was insufficient to support a sustained rebound, capital continued to flow out, and market sentiment was cautious. Whether the slight stabilization at the end of the month can be sustained remains to be seen.
Hot Tokens in June
 Newly listed tokens generally performed poorly in June. ARX gained high attention based on its Solana ecosystem association, MPC+FHE+ZK tech stack, and the "AI + Privacy Computing" narrative, with a 24-hour trading volume of $1.3 billion. However, its high valuation also brought significant volatility. RE attracted short-term liquidity due to its RWA + Reinsurance narrative and listings on multiple exchanges, but its high turnover rate and pullback suggest strong speculative characteristics.
3. On-Chain Data Analysis
Analysis of BTC and ETH ETF Inflows and Outflows
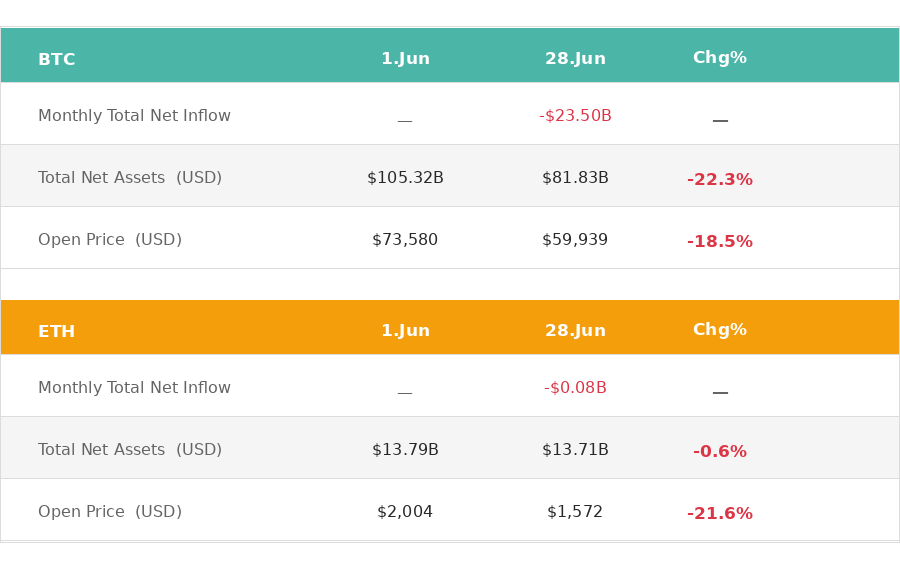
In June, both Bitcoin and Ethereum spot ETFs faced pressure, but their performance diverged significantly. The total net assets of Bitcoin ETFs shrank sharply from $105.3 billion to $81.8 billion, a decline of 22.3%, corresponding to net outflows of approximately $23.5 billion. Meanwhile, the spot price of BTC fell from an opening of $73,580 at the start of the month to $59,939 at the end, a decline of 18.5%. The decline in net assets was significantly larger than the price decline, indicating that besides the valuation shrinkage from price declines, institutional investors also actively redeemed. The combination of these two factors created dual pressure. The large-scale net outflows suggest that institutions chose to reduce positions rather than buy the dip during the downturn. Ethereum ETFs were relatively more stable, with net assets only slightly decreasing from $13.79 billion to $13.71 billion. Net outflows of approximately $8 million were negligible, suggesting ETH ETF holders largely chose to stay put. However, the spot price of ETH fell from $2,004 to $1,572 over the same period, a decline of 21.6%, actually higher than BTC. This divergence indicates that ETH's decline was primarily driven by selling pressure in the on-chain spot and derivatives markets, rather than institutional redemptions at the ETF level. Overall, the crypto market was in a risk-off phase in June. BTC ETFs experienced significant capital withdrawals, while ETH ETFs were relatively stable on the capital flow front, but their price weakness was more pronounced. Neither showed effective signs of capital returning, and short-term price stabilization still awaits an improvement in macro sentiment.
Analysis of Stablecoin Inflows and Outflows
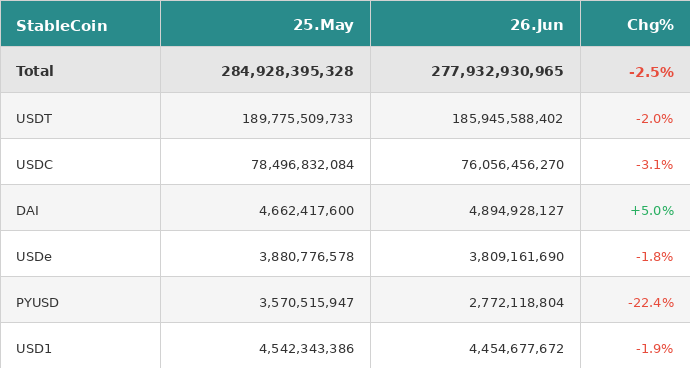
From May 25 to June 26, 2026, the total supply of major stablecoins decreased from approximately $284.9 billion to approximately $277.9 billion, a sequential decrease of about $7 billion (-2.5%), indicating a clear tightening of overall liquidity. The supply of the two leading stablecoins, USDT (-2.0%) and USDC (-3.1%), both declined, totaling a decrease of approximately $6.2 billion. This was the core driver of the total supply contraction, with USDC showing a slightly larger decline, suggesting relatively higher withdrawal pressure on regulated stablecoins. PYUSD experienced the most prominent drop, plunging from about $3.57 billion to about $2.77 billion (-22.4%) within a month. USD1 (-1.9%) and USDe (-1.8%) showed moderate declines, within normal fluctuation ranges. The only one bucking the trend was DAI, with its supply increasing from about $4.66 billion to about $4.89 billion (+5.0%), indicating that decentralized lending protocol activity rebounded during the period, with on-chain collateralized borrowing demand strengthening. Overall, the stablecoin market exhibited a net capital outflow trend during this period. Centralized stablecoins were under significant pressure, while decentralized DAI achieved growth against the market trend, supported by on-chain demand.
4. Price Analysis of Major Currencies
Bitcoin (BTC) Price Analysis
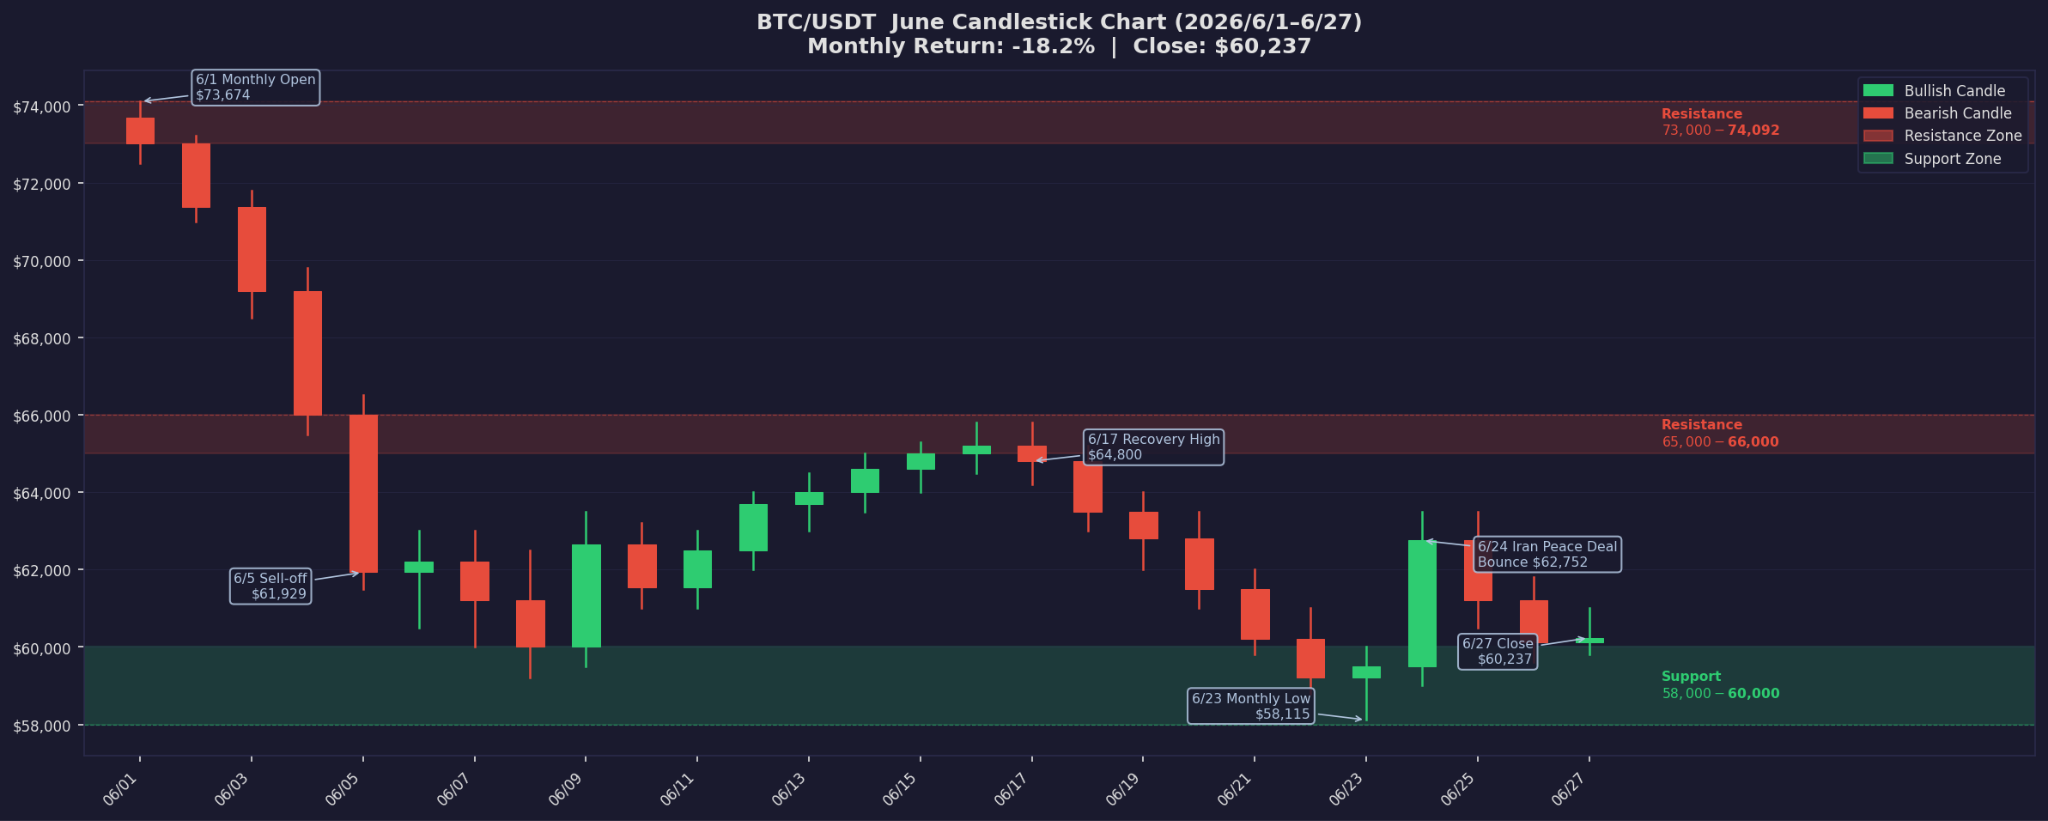
BTC opened June at $73,674 and briefly touched its monthly high of $74,092 at the start of the month. However, the bulls failed to hold the advantage, and a declining trend unfolded throughout the month. The first week was the most brutal period of the month, with BTC plummeting from around $73,000 to approximately $63,000, a weekly decline of about 14%. The main causes were continuous ETF outflows, a contraction in total stablecoin supply, and shaken institutional confidence triggered by Strategy's rare sale of BTC. The triple negative factors collectively dismantled market faith in "institutional buying" and the "corporate treasury narrative." In the second week, the price oscillated within the $62,000–$65,000 range, with a weekly drop of about 4%. BTC underperformed the Nasdaq and some AI-related assets. Its "digital gold" characteristic dimmed significantly in an environment of high interest rates and no renewed ETF inflows, behaving more like a high-beta risk asset. The third week (June 15) saw the largest rebound of the month. The temporary US-Iran peace