
Bulls approach the “ceiling”: Bitcoin breaks through the $80,000 mark, closing in on the key resistance at $85,000
- Core Thesis: After breaking through the key $80,000 resistance level, the market shows signs of a structural recovery. However, supply pressure near the $85,000 area and high realized losses overhead remain the primary constraints on upward movement. Sustained spot demand is required to confirm a durable continuation of the uptrend.
- Key Factors:
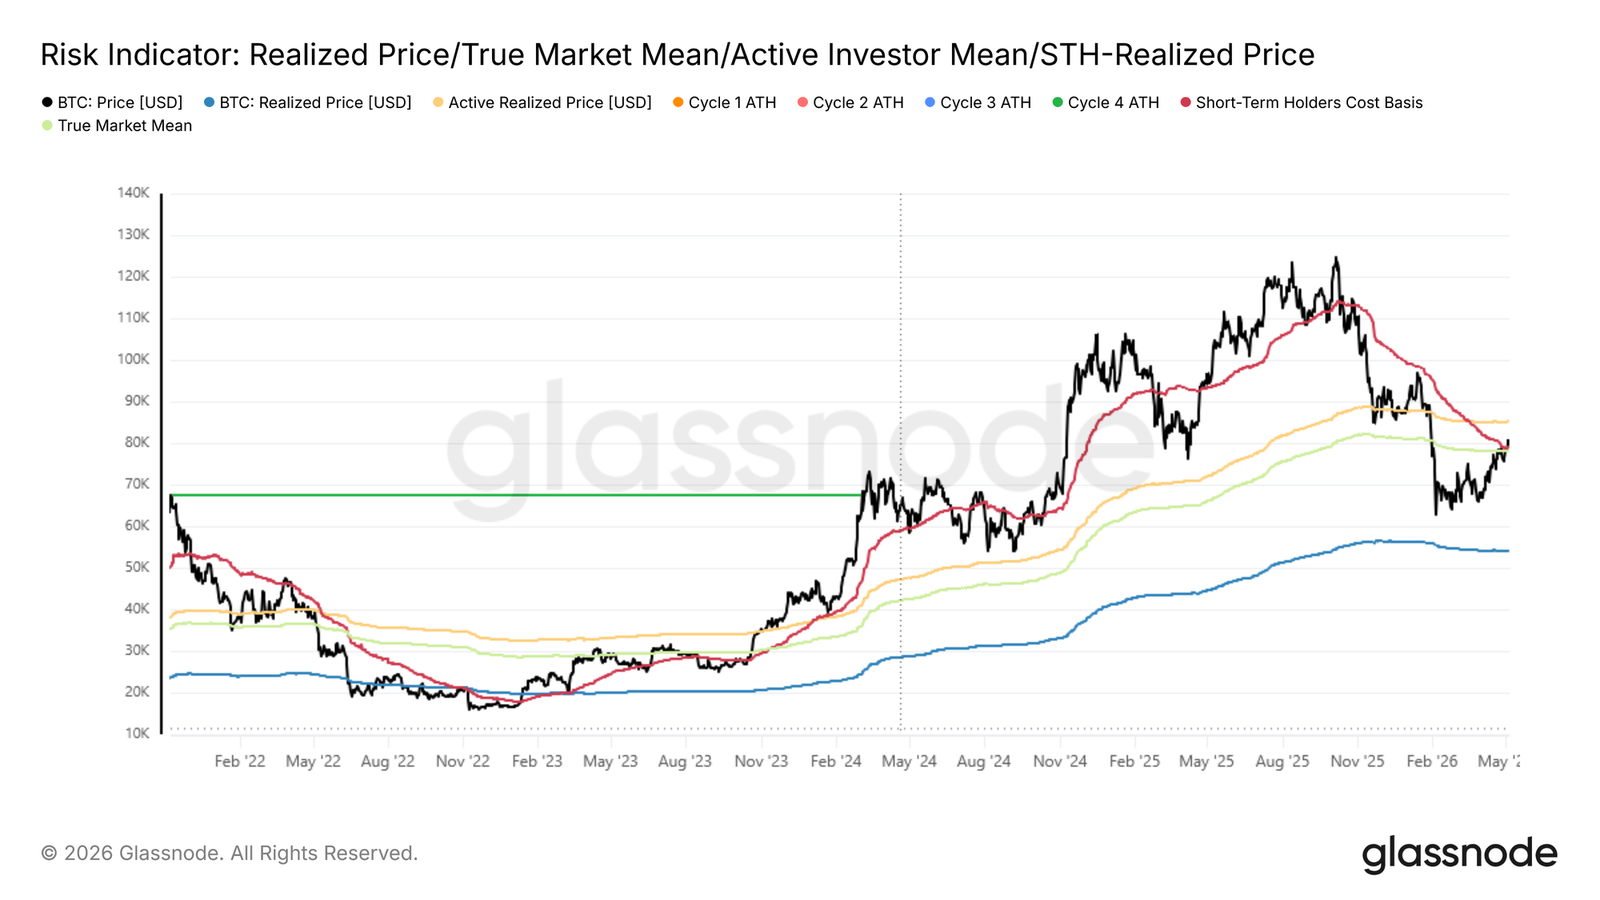
- Bitcoin has breached the Real Market Mean at $78,200 and the Short-Term Holder Cost Basis at $79,100. The next key resistance lies near the Active Realized Price at $85,200.
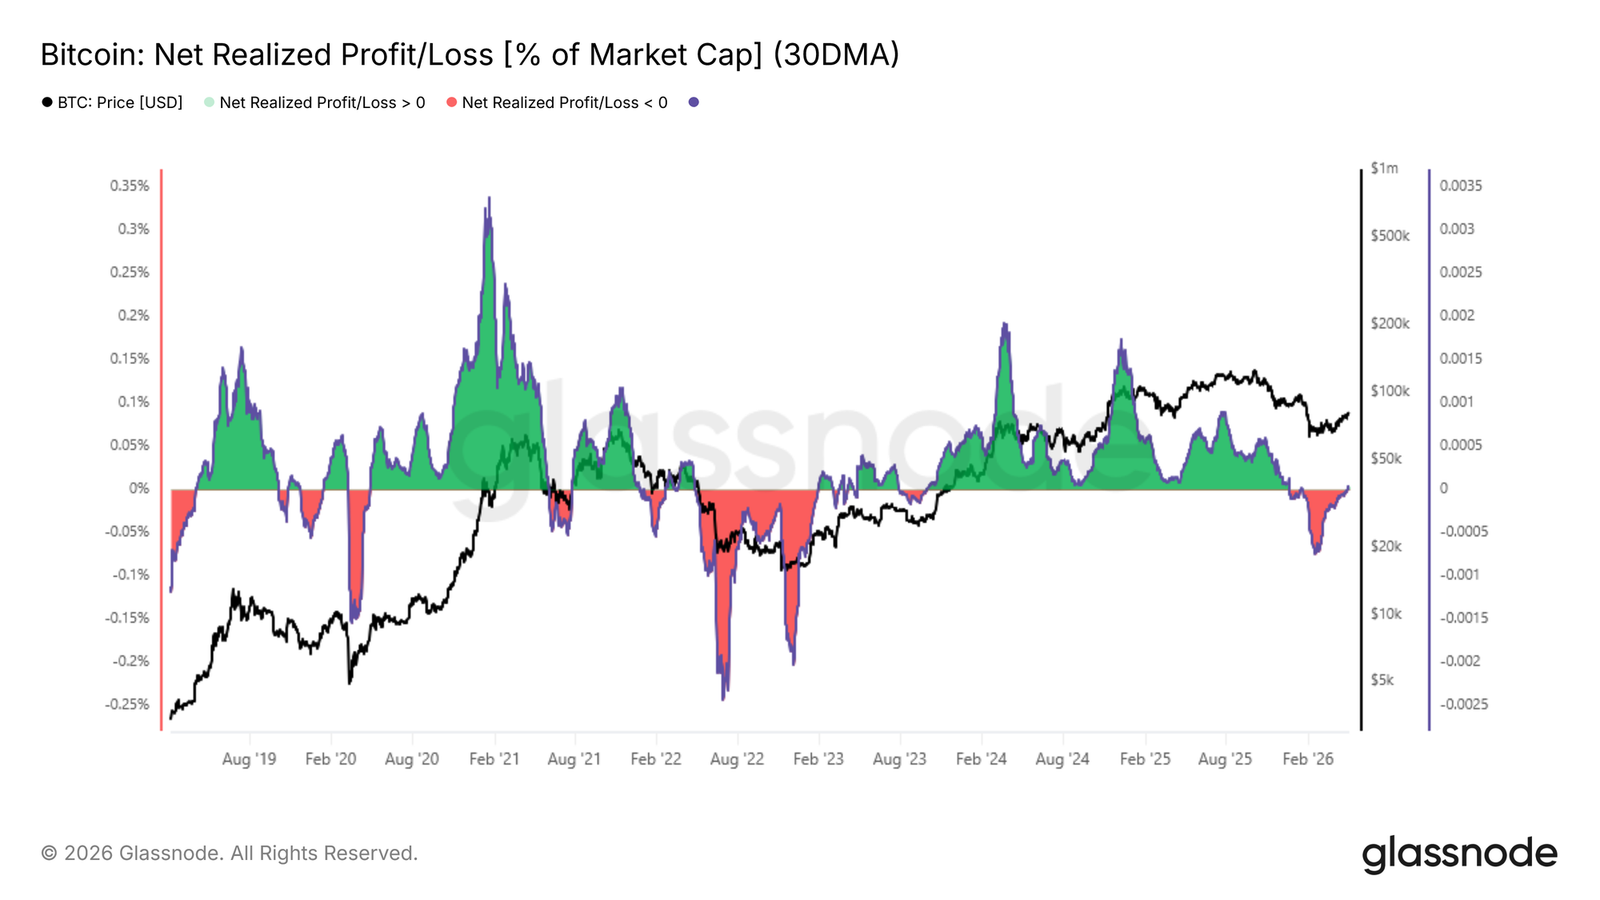
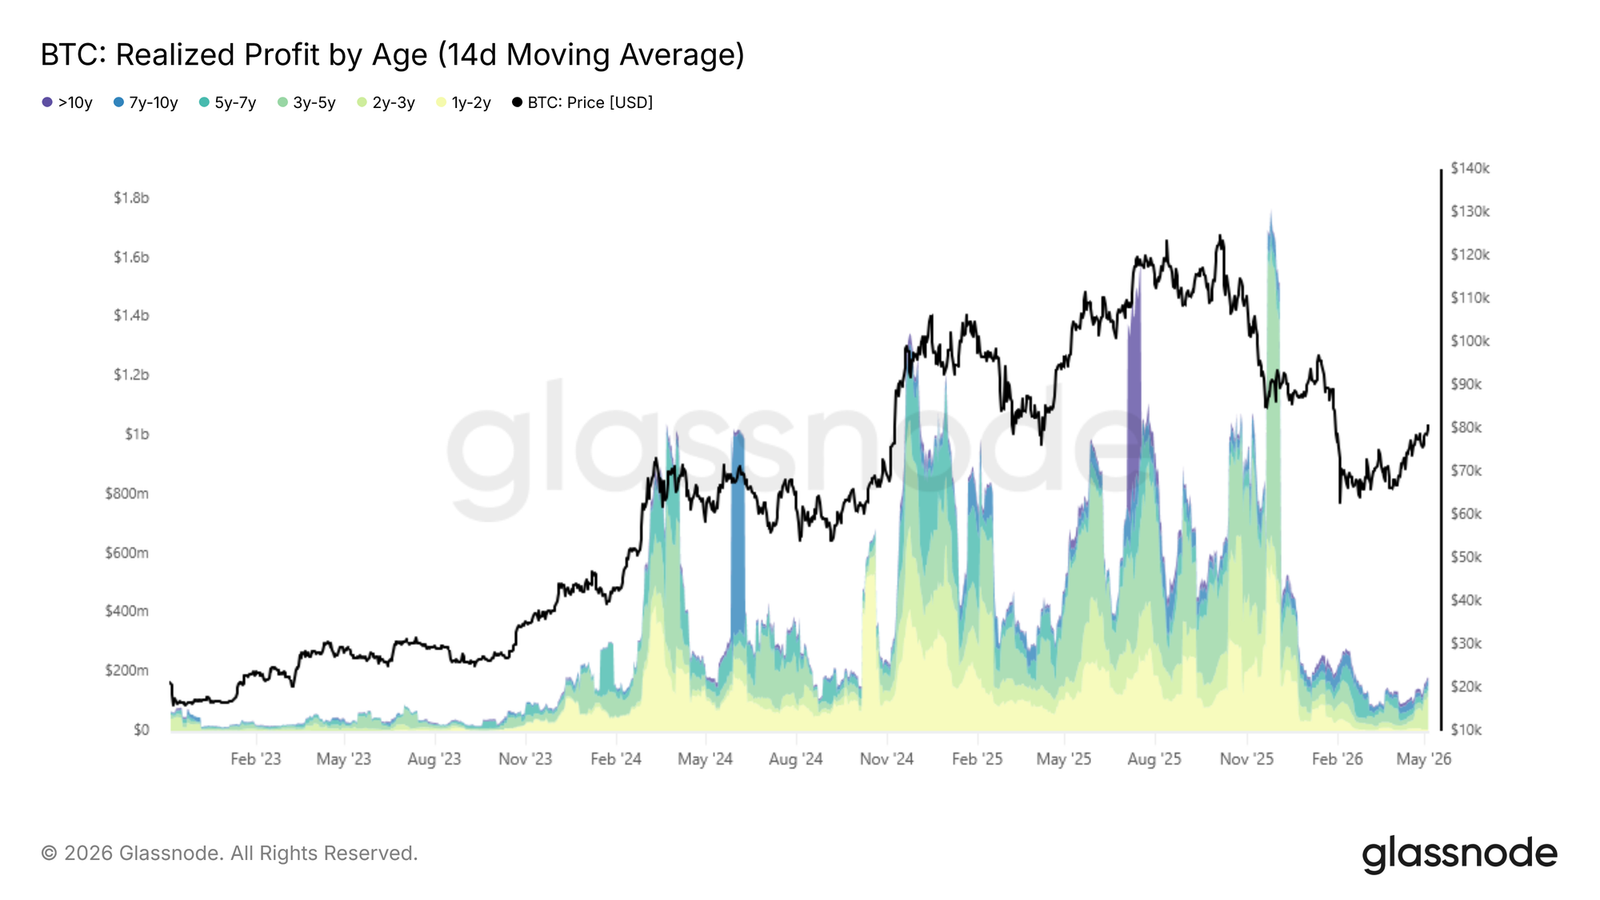
- The 30-day Net Realized Profit/Loss has turned positive (0.003% of market cap). Long-term holder profit-taking has risen to $180 million per day, but remains far below the cyclical peak of $1 billion per day.
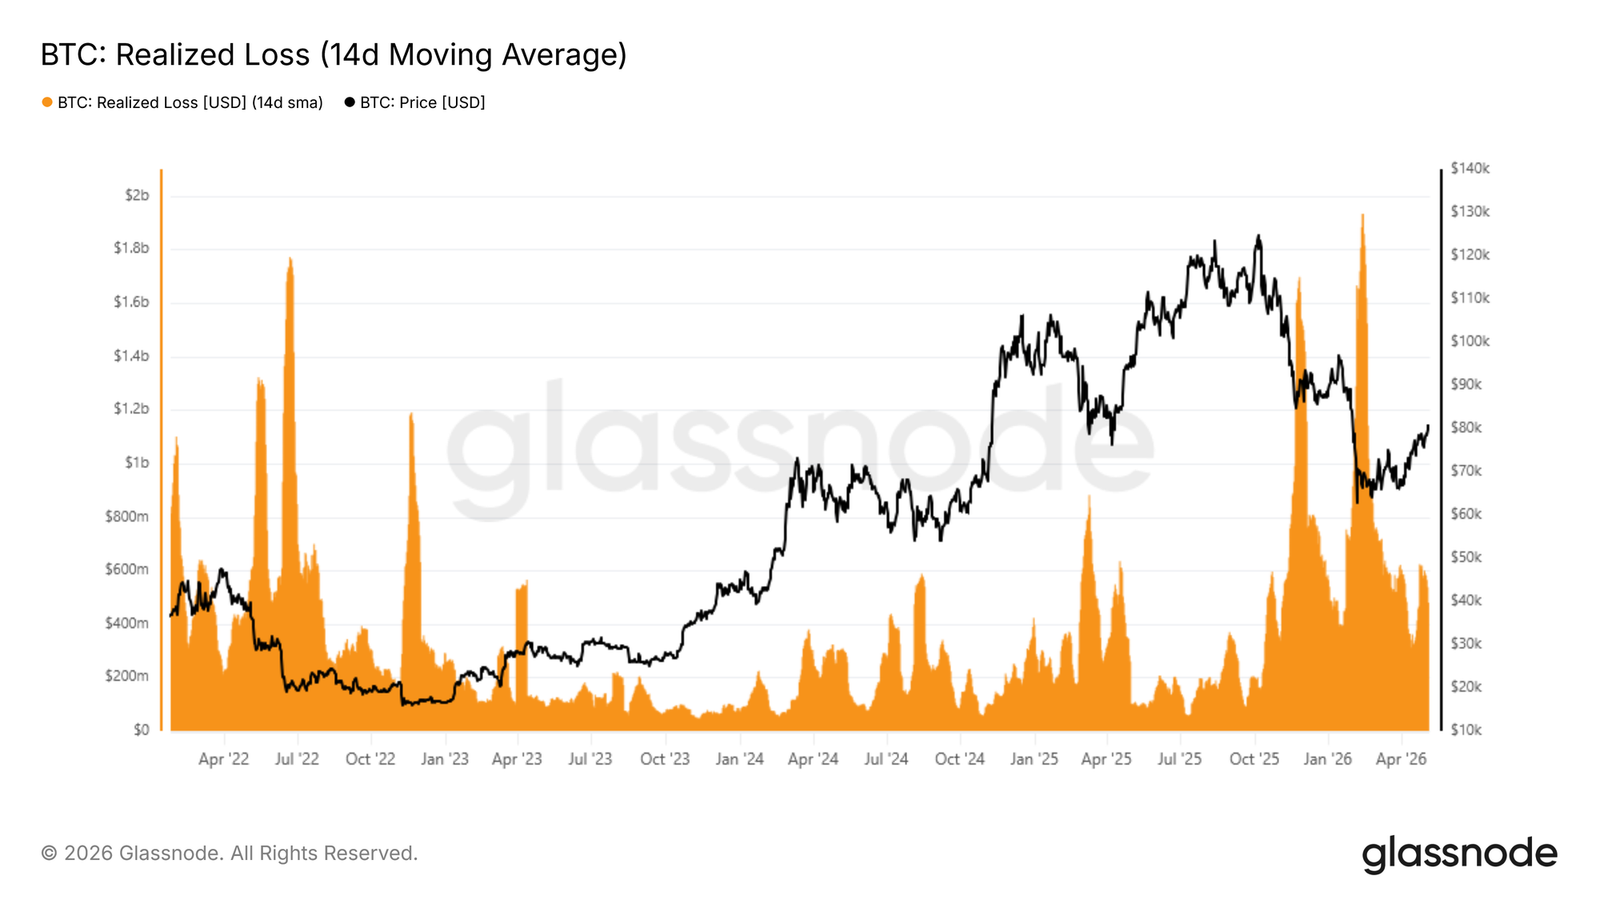
- Total Realized Loss is still high at $479 million per day, 140% above the cyclical baseline. This needs to compress to below $200 million per day to confirm selling pressure is exhausted.
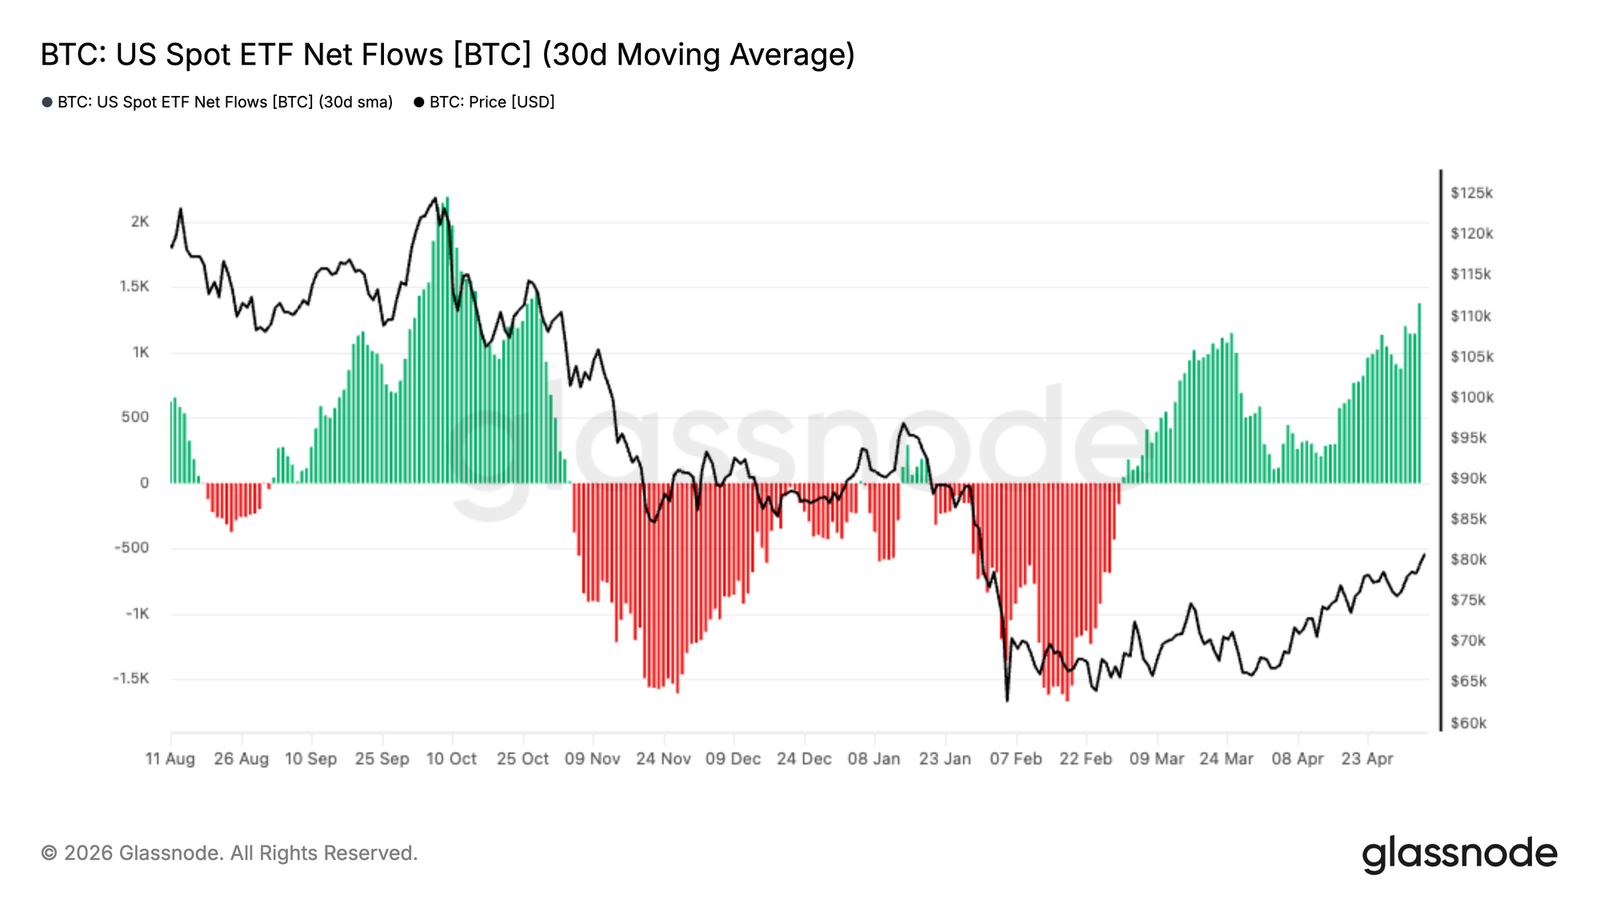
- US spot ETF inflows have turned positive on a 30-day basis, with institutional demand recovering to support prices returning to the $80,000 zone.
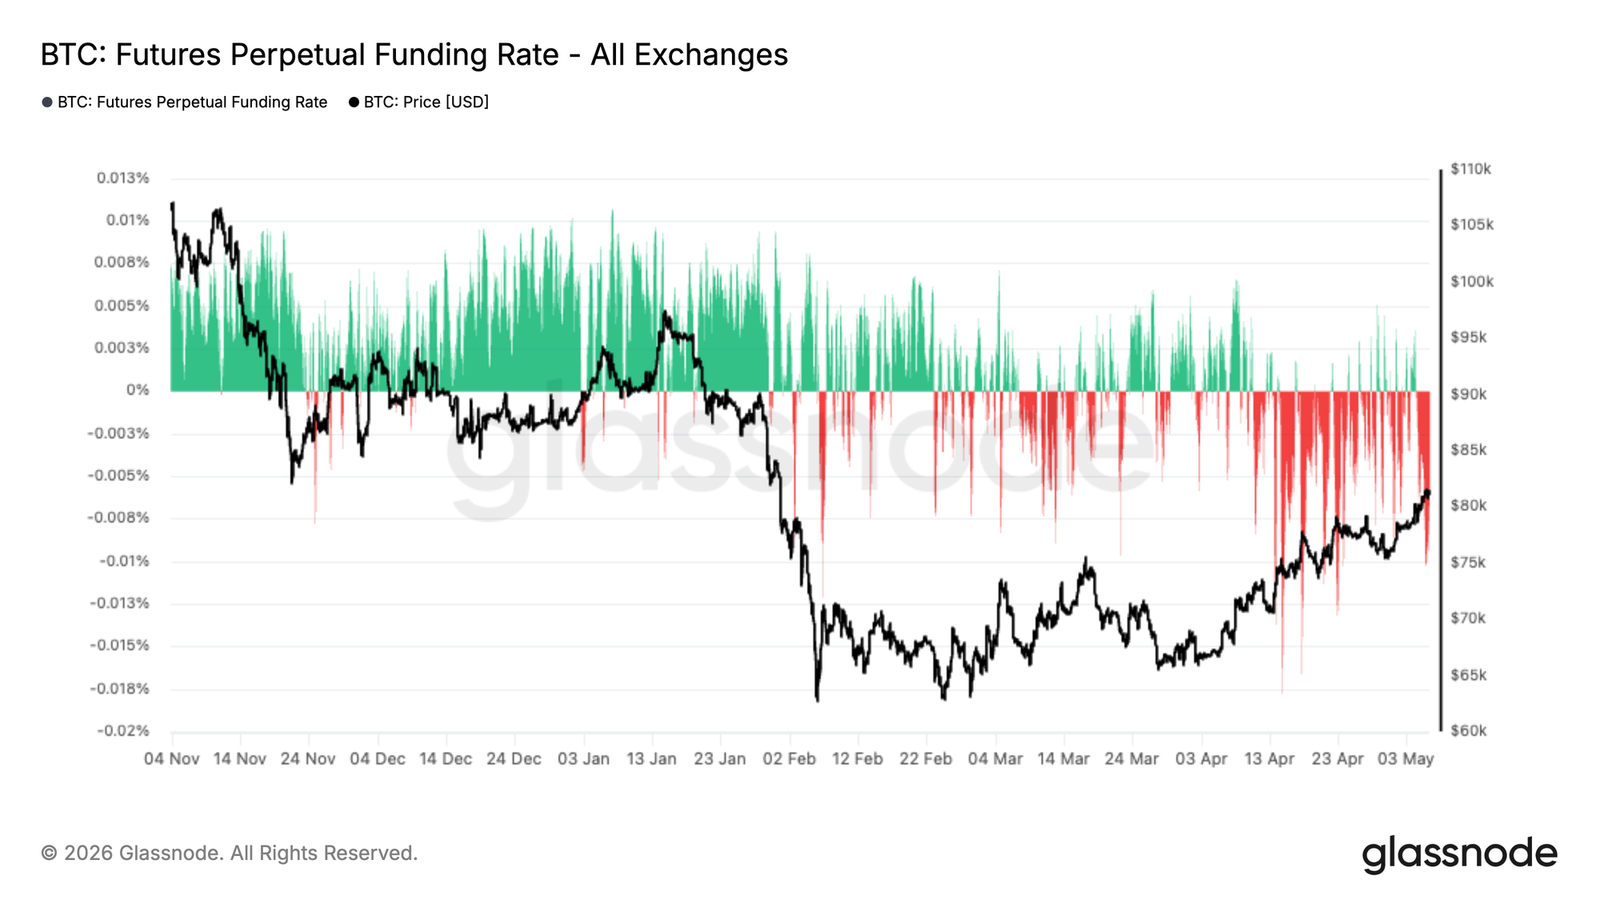
- Perpetual contract funding rates remain predominantly negative, indicating persistent short positioning. This could present further upside potential through a short squeeze.
- There is a nearly $2 billion near-term options Gamma cluster around the $82,000 level, where market maker hedging flows could amplify price volatility.
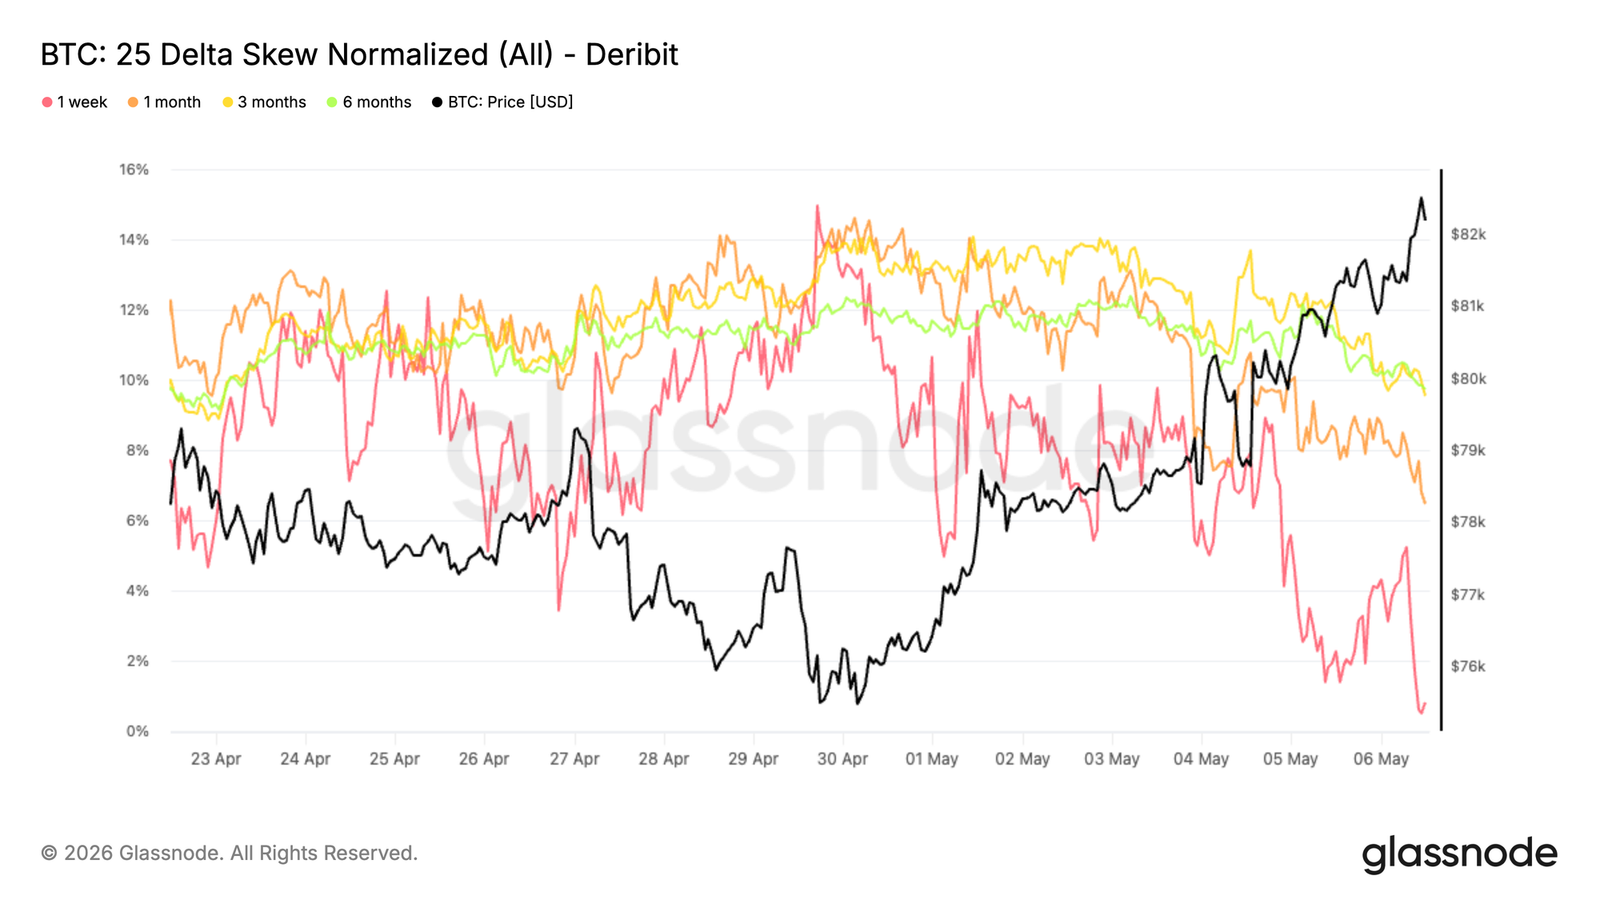
- Options skew is compressing towards neutral. The 1-week skew is near zero, suggesting reduced demand for downside hedges and a more balanced positioning.
Original Author: Glassnode
Original Translation: Aididiao JP, Foresight News
Bitcoin has broken through the $80,000 mark and is advancing towards key resistance around $85,000, with the bulls firmly in control. ETF demand is recovering, and short positions persist. However, overhead supply may cap the upside unless spot buying momentum strengthens further.
Summary
- Bitcoin has surpassed the Realized Market Price of $78,200 and the Short-Term Holder Cost Basis of $79,100. Holding above these levels suggests the recent deep-value phase was brief. The next key resistance sits at $85,200.
- The 30-day simple moving average of Net Realized Profit/Loss has turned positive at 0.003% of market cap. Meanwhile, Long-Term Holder profit-taking has risen to approximately $180 million per day, still significantly below the cycle peak of over $1 billion daily.
- Realized losses remain elevated at $479 million per day, which is 140% above the cycle baseline. A sustained compression to below $200 million daily is needed to confirm a more durable recovery pattern.
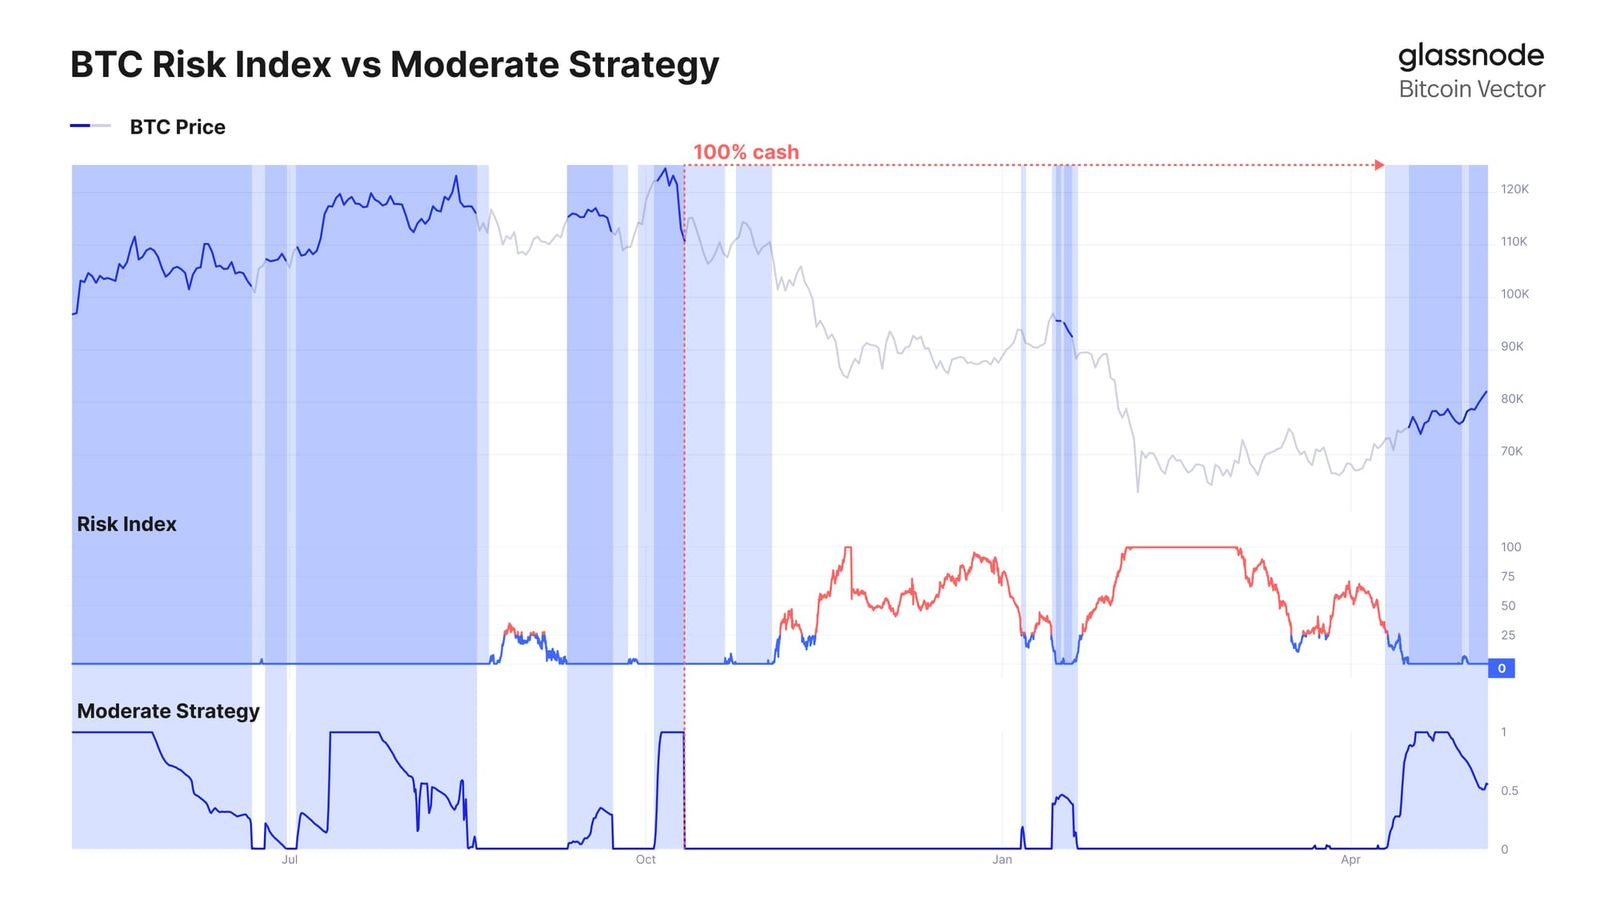
- Glassnode's neutral strategy re-entered the market after Bitcoin reclaimed the ~$76,000 level, capturing the recent upside while maintaining a focus on downside protection.
- U.S. spot ETF flows have turned positive on a 30-day basis, indicating a revival in institutional demand and supporting the price's return to the $80,000 region.
- Despite the rally, perpetual swap funding rates remain predominantly negative, highlighting persistent short positioning. This could fuel further upside via a short squeeze.
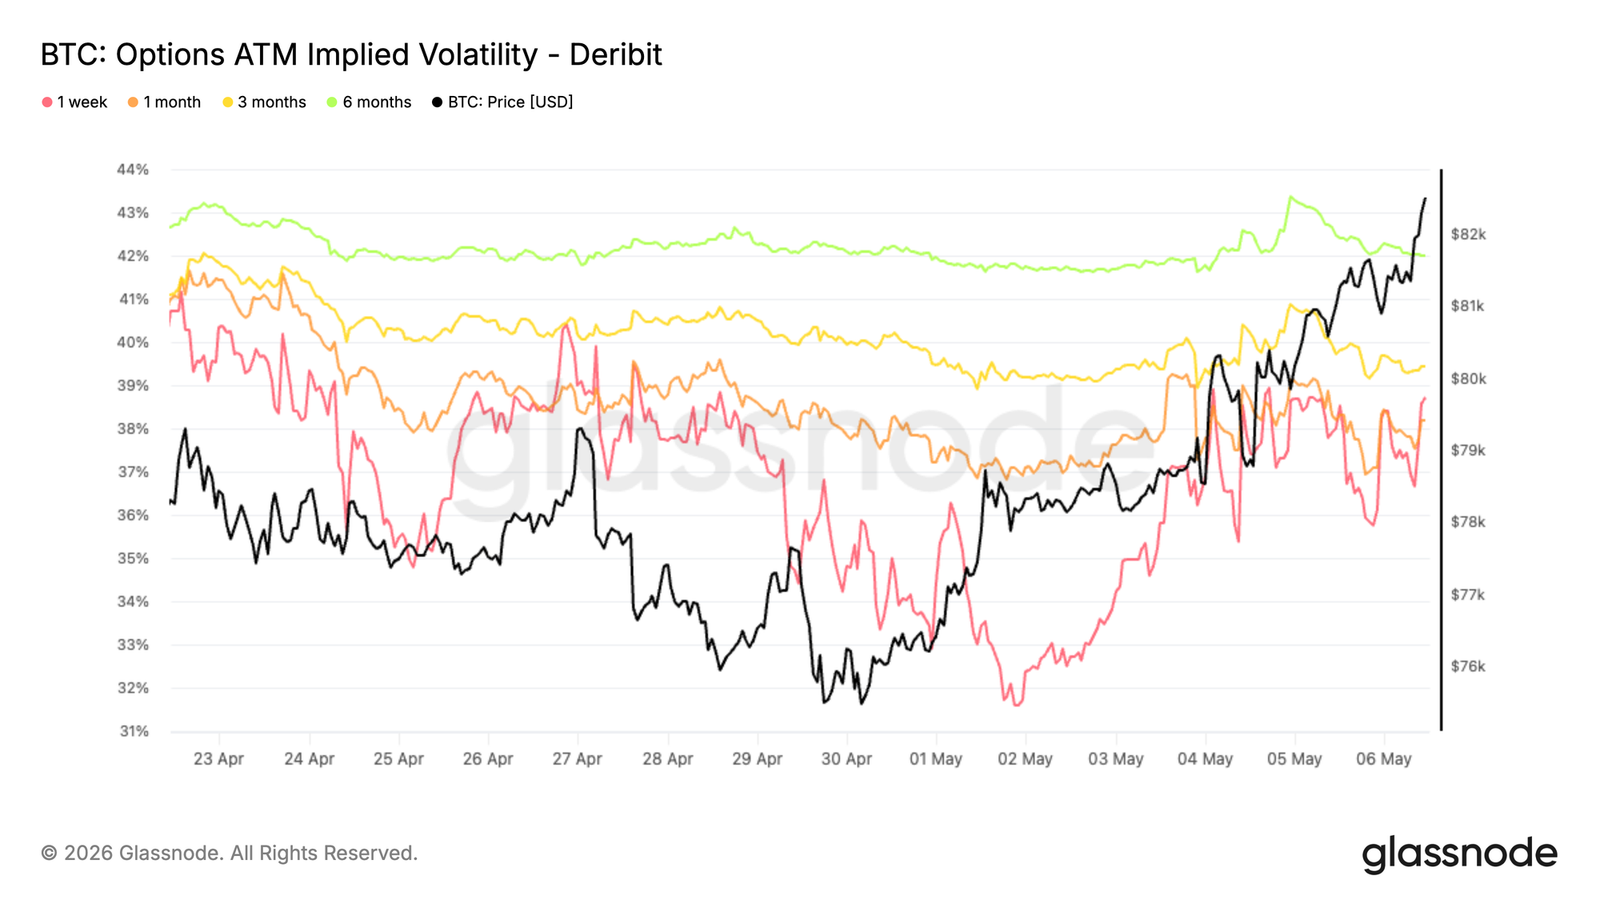
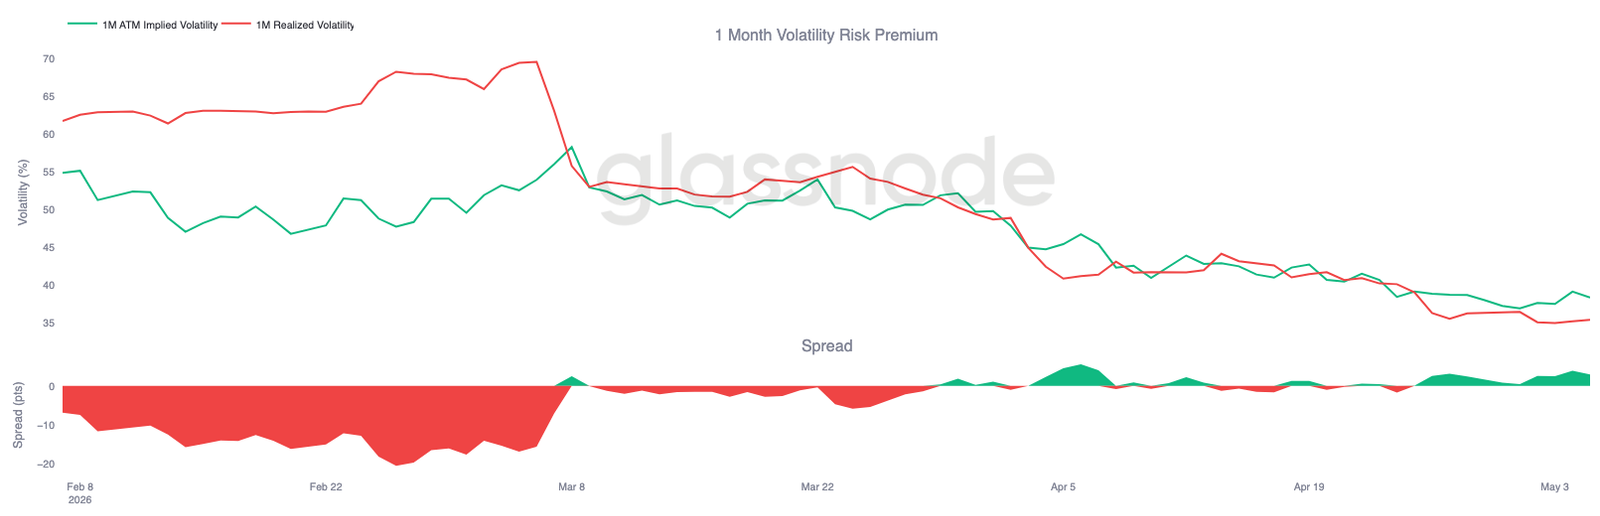
- Front-end implied volatility has repriced upwards following the breakout, while realized volatility lags. A positive volatility risk premium is being rebuilt.
- Options skew is compressing towards neutral, suggesting reduced demand for downside hedging and a shift towards more balanced positioning.
- A significant cluster of short-term option hedges exists near $82,000, increasing price sensitivity. Dealer hedging flows could amplify volatility while spot remains in this range.
On-Chain Insights
Breaking Above the Mean
Last week, this report noted that the rejection at the Realized Market Price (RMP) and Short-Term Holder Cost Basis confirmed short-term overhead resistance. It also highlighted the dense accumulation cluster between $65,000 and $70,000 as a foundation capable of supporting a rebound to the $84,000 supply zone. This rebound has now materialized: Bitcoin pushed to $81,000, breaking through the RMP ($78,200) and the Short-Term Holder Cost Basis ($79,100), thereby clearing the average purchase prices of all actively traded supply from the past 155 days and recent buyers.
If the price can hold above these levels in the coming week, the deep-value phase that began in early February 2026 will become one of the briefest such phases in Bitcoin's market history. Attention now turns to the next major resistance around $85,200, near the Active Realized Price. This price tracks the cost basis of all non-dormant supply and represents the next structural hurdle the market must face.
Profitability Turns Positive
With the breakout above the Realized Market Price, the improved price structure is now reflected in profitability metrics. The 30-day simple moving average of Net Realized Profit/Loss (the difference between on-chain realized profits and losses, divided by market cap) has turned positive, currently at 0.003% of market cap.
This metric serves as a broad indicator of whether spending investors are exiting at a profit or a loss overall. Its return to positive territory after a prolonged period of loss dominance is a constructive signal. The metric reached a low of -0.027% of market cap around mid-February, a notable negative value but with relatively limited depth compared to the extreme loss realization phases observed during the 2022-2023 bear market. In hindsight, this limited negative depth aligns with the historically brief duration of the recent deep-value phase mentioned earlier.
Long-Term Holders Begin to Stir
As Net Realized Profit/Loss turns positive, the key question becomes whether buyer liquidity can withstand the increasing wave of distribution from Long-Term Holders (LTHs). The 14-day simple moving average of realized profits from addresses holding coins for over a year has risen to approximately $180 million per day following the recent rally, a level comparable to September 2024 and December 2022.
This cohort has endured the entire recent bearish phase and now faces increasing incentives to take profits as prices recover to more favorable levels. If the current expansion continues, this distribution pressure is likely to intensify. Importantly, this metric has not yet approached the over $1 billion daily levels seen during the early peak conditions of this cycle, suggesting that LTH selling remains moderate rather than aggressive at this stage. Whether the market can absorb this gradually increasing supply while maintaining prices above the Realized Market Price will be the decisive test of the current recovery's structural support.
Realized Losses Remain Elevated
While LTH profit-taking remains below concerning levels in these early stages of a potential regime shift, the volume of realized losses in the broader market poses a more immediate drag on momentum. The 14-day simple moving average of Total Realized Losses is currently $479 million per day, approximately 140% above the ~$200 million daily baseline seen during more stable periods of this cycle. This reflects investors eager to exit at now-smaller loss magnitudes as prices rebound.
A sustained compression of this metric back below $200 million daily would serve as a strong on-chain confirmation that selling pressure is exhausted and the market is genuinely transitioning towards a healthier demand environment. Until that threshold is met, the dual pressure from LTH profit-taking and top buyers distributing at marginal losses may anchor the current rally, particularly in the absence of substantial catalysts for new buyer participation in the short term.
Off-Chain Insights
Following the recovery from the ~$66,000 low and a solid breakout above the ~$76,000 range, systematic strategies have begun to reintroduce risk. Glassnode's neutral strategy (which utilizes off-chain market data to manage exposure) has re-entered allocation, participating in the recent rally towards the $80,000 region.
This strategy, designed with a focus on downside protection, typically lags during sharp rallies but seeks to avoid deeper drawdowns and re-enter once conditions improve. This recent shift reflects a more constructive market backdrop as prices reclaim key levels and directional momentum rebuilds.
ETF Demand Regains Momentum
Demand for U.S. spot Bitcoin ETFs has seen a notable revival. The 30-day moving average of net inflows has turned decisively positive after a prolonged period of persistent outflows. This shift marks a clear inflection point in institutional appetite, which had experienced significant outflows during the late 2025 and early 2026 correction.
The recent acceleration in inflows aligns closely with Bitcoin's rebound from the ~$66,000 low back to the $80,000 region, suggesting a resurgence of conviction among traditional investors. If this trend continues, ETF demand could once again act as a structural tailwind, reinforcing spot market strength and supporting further upside.
Persistent Short Pressure
Despite the recovery from the ~$66,000 low and the retest of the $80,000 region, perpetual swap funding rates remain predominantly negative. This persistent negative funding indicates that short positioning continues to dominate, with traders willing to pay a premium to maintain downside exposure despite the recent upward price action.
Historically, such conditions often appear during phases of skepticism, where rallies are met with position reduction rather than aggressive long accumulation. The coexistence of negative funding rates and rising prices suggests the market may be climbing a "wall of worry," potentially setting the stage for further upside if short positions continue to come under pressure.
Front-End Volatility Reprices After Local Lows
Implied volatility bottomed out over the past weekend, with levels across tenors reaching their lowest point since October 2025, just before the 10/10 event.
Since then, Bitcoin's breakout has brought volatility back into the market. The 1-week tenor has risen approximately 6 volatility points from its low, driven by upside demand and position adjustments.
This move was amplified by Gamma sellers rolling their exposure: they buy back short-dated options and sell further out the curve. Consequently, the front end repriced sharply, while longer tenors moved only modestly, rising 1 to 2 volatility points.
This reflects a renewed demand for short-dated options without a broader shift in long-term volatility expectations.
Volatility Risk Premium Rebuilds as Implied Volatility Leads
Bitcoin's realized volatility continues to drift lower, with 1-month RV currently at 35.38%, even as prices moved significantly higher over the past week.
This creates a clear divergence: implied volatility repriced faster than realized volatility after the breakout. The volatility risk premium has turned positive again, with the spread nearing 3 volatility points, reflecting renewed demand for short-dated options. It indicates that realized volatility has not kept pace with the recent price action. Implied volatility leads, driven by positioning and front-end demand, while realized volatility remains relatively contained.
This setup still supports the market's upside, but the widening spread suggests the market is beginning to price in more volatility ahead than what has materialized so far.
Skew Normalizing, Downside Demand Fades
Skew across tenors is moving back towards neutral, reflecting a clear shift in positioning. After sustained put option premiums, the 25-delta skew is now compressing, though it remains in put territory.
This move is most pronounced on the front end. The 1-week skew is now approaching zero as downside demand fades. Since this metric is calculated as puts minus calls, this downward movement indicates that the premium for puts relative to calls is eroding. Longer tenors are also moving lower, though more gradually, still retaining a put premium despite compression.
This suggests that protection is being unwound rather than added, particularly in the short term. Following the recent price breakout, traders are reducing hedges and shifting more towards directional exposure. The skew no longer indicates strong demand for downside protection.
Large Short-Term Gamma Cluster Drives Spot Sensitivity
Gamma positioning reveals a significant short-term Gamma concentration near the $82,000 strike price, with nearly $2 billion in exposure currently at the prevailing spot level.
Short-term Gamma implies that dealers' positions force them to hedge in the direction of the price move—buying when prices rise, selling when they fall. This creates a feedback loop that can accelerate price action, helping to explain the recent push towards $83,000.
This effect is amplified by strong call option buying, which has accounted for approximately 40% of options volume over the past 24 hours, adding pressure into this zone.
With spot now sitting atop this large short-term Gamma cluster, the market enters a highly sensitive area where small price swings can trigger outsized reactions. Prices are likely to remain highly reactive here, with potential for sharp moves in either direction as hedging flows intensify.
Conclusion
Bitcoin is showing early signs of a structural recovery, advancing towards overhead resistance near $85,000 while reclaiming key on-chain cost basis levels. Spot demand and ETF inflows are rebuilding, suggesting the bulls remain in control. However, the market is now approaching a critical ceiling where overhead supply may begin to reappear.
Meanwhile, derivatives positioning remains tilted towards the short side, creating conditions where further upside could be driven by short pressure. The options market is resetting, and the presence of short-term Gamma near current price levels increases the likelihood of amplified volatility as the price tests resistance.
In summary, the trend appears constructive and bullish momentum is intact, but the market is now entering a more reactive phase. Sustained breakthroughs of resistance, supported by continued spot demand and easing selling pressure, will be necessary to confirm a more durable upward continuation.


