
Structural Choices Amid Continued Volatility: Bitcoin Range Trading and HYPE Swing Opportunities | Invited Analysis
- Core View: The analyst believes Bitcoin is currently in a volatile consolidation phase with unclear market direction, suggesting a focus on structural opportunities. This analysis also introduces, for the first time, a review of HYPE's price action and short-term trading operations.
- Key Elements:
- Bitcoin price is oscillating within the $65,500–$70,000 range. The weekly downtrend remains unchanged, while the daily chart shows an oversold rebound with weak momentum.
- The analyst holds a medium-term short position initiated at $89,000, currently with a profit of approximately 24.01%, and plans to reduce the position if the price rebounds and breaks above $74,500.
- First-time analysis of the HYPE token, noting that its daily chart has broken through a long-term descending trendline. The analysis details its potential wave structure and key confirmation levels.
- Based on HYPE's 1-hour technical signals, a successful short-term long trade was executed, yielding a profit of about 4.71%.
- This week, Bitcoin's key resistance zone is between $72,300 and $74,500, with support near $65,000. The strategy suggests reducing long positions on rallies and controlling risk.
- The short-term trading plan consists of two scenarios, both centered around establishing short positions if the price encounters resistance near $72,300 or $74,500, with clear stop-loss and trailing take-profit rules set.
Hello, I'm your old friend Cody, a market analyst invited by Odaily. Today is the seventh day of the Lunar New Year, and the Spring Festival holiday is basically coming to an end.
Judging from the market performance, the market trend this week is similar to the state we analyzed in our previous article — the pace is slow, dominated by consolidation, with no significant directional volatility.
Bitcoin mainly traded within the $65,500 to $70,000 range over the past week. The overall price structure maintained a consolidation pattern, neither effectively breaking above the upper resistance nor showing further signs of weakening with increased volume below.
Therefore, against this backdrop, what is more suitable this week is not to hastily judge the trend direction, but to observe the structural changes within the consolidation range.
It is precisely during this phase of "slowing momentum in mainstream assets" that we can shift our focus to some assets with relatively independent structures.
Therefore, this week's article will introduce a new coin for analysis for the first time — HYPE. Combining the results of a completed short-term practical operation, we will break down its current position and potential subsequent trading opportunities from the perspective of daily chart structure and wave analysis.

Core Summary of Trading Weekly Report:
• Verification of Strategy Execution (Short-term) Effectiveness: Based on strategy discipline, we did not conduct short-term operations last week as Bitcoin's price did not reach the predicted resistance zone.
• Verification of Strategy Execution (Medium-term) Effectiveness: Bitcoin followed the established medium-term strategy last week, continuing to hold the short position opened at $89,000 (1x leverage). As of last week's close, the profit was approximately 24.01%, with a maximum profit of about 32.58% during the period.
• Verification of Core View (Short-term): Bitcoin consolidated between $65,500 and $70,000 last week. The current price action aligns with our previous prediction of a range-bound market.
• HYPE: Analysis of price structure and short-term trading opportunities. (Detailed explanation in Figure 1)
The following will provide a detailed review of market predictions, strategy execution, and specific trading processes.
1. Interpretation of HYPE Price Structure and Review of Short-term Operation:
HYPE Daily K-line Chart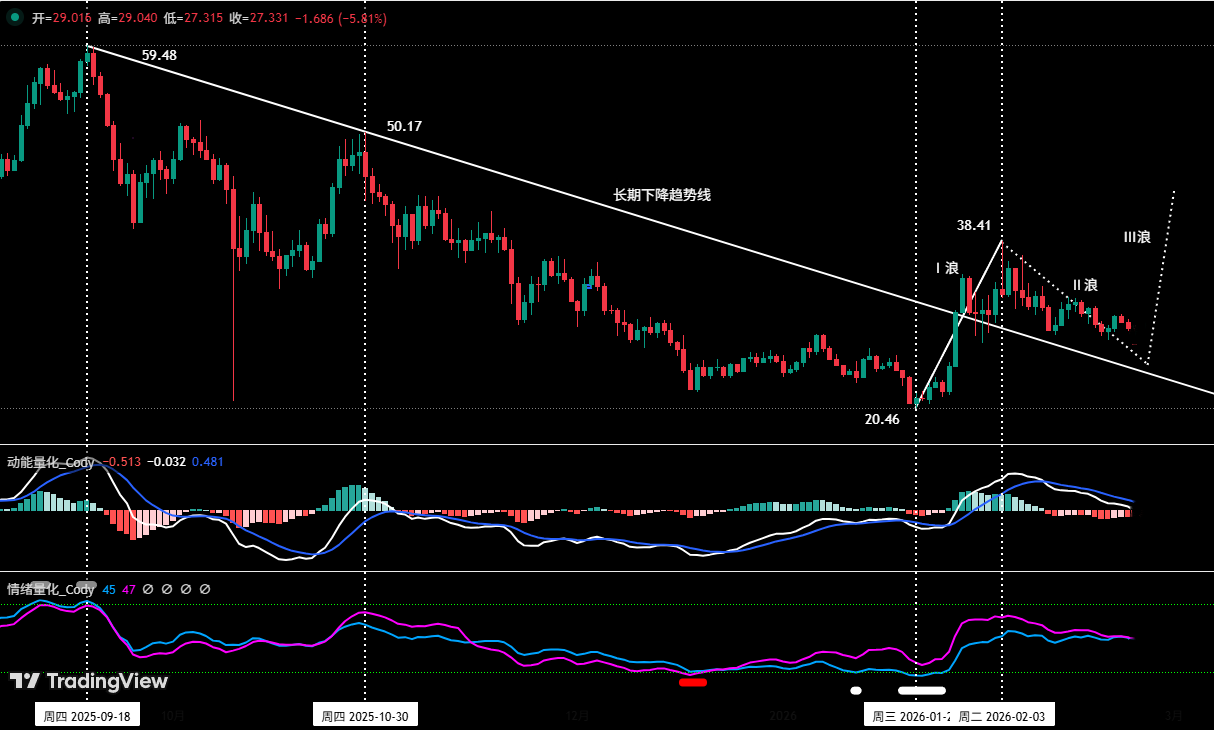
Figure 1
1. Daily Level Structural Framework (See Figure 1)
Since stabilizing around $20.46 on January 21, 2026, HYPE has initiated an independent upward consolidation trend. Currently, the price has confirmed a breakout above the long-term descending trendline connecting the September 2025 high (around $59.48) and the October 2025 high (around $50.17), suggesting a potential shift in the previous bearish structure.
Its daily price structure can be preliminarily divided as follows: (Based on price action after January 21)
• Wave I (Impulse Wave): From January 21 ($20.46) to February 3 ($38.41), completing an upward wave.
• Predicted Signal for Wave I Bottom: Analysis through a self-built quantitative model showed simultaneous occurrences near the end of Wave I (around January 21):
• Momentum Quantitative Model: Displayed a momentum divergence signal.
• Sentiment Quantitative Model: Triggered a bottom warning signal (white horizontal bar in the chart).
The superposition of the above signals reinforced the prediction that Wave I formed a significant low on January 21 ($20.46).
• Wave II (Corrective Wave): From February 3 ($38.41) to the present, manifesting as a correction of Wave I.
• Analysis of Key Confirmation Conditions for Wave III:
• Confirmation Signal for the Start of Wave III:
a. If the subsequent price does not break below the February 19 low of $27.73, this point can be confirmed as the end of Wave II and the starting point of Wave III.
b. If the subsequent price breaks below $27.73 but remains above the January 21 low of $20.46, then the current price action is considered merely a continuation of the Wave II correction. Wave III may not have started yet, requiring the search for the next bottoming signal.
• Confirmation Signal for the End of Wave III:
The high point reached during Wave III must exceed the Wave I peak of $38.41. Only when the price clearly breaks above the previous high can the continuation of the uptrend be confirmed; otherwise, it may still be part of a wide-range consolidation or a rebound within a downtrend structure.
2. HYPE Short-term Operation (1x Leverage Long)
• Opening Decision: Based on the correction following the first upward trend segment on the 1-hour chart, the first pullback after the momentum line in the Momentum Quantitative Model broke above the zero axis, and the price being above a key support zone.
• Closing Decision: The closing price was near the short-term technical resistance area around $30.97.
• Trading Summary: This operation successfully captured the rebound wave on the hourly level, achieving a profit of approximately 4.71%.
2. Bitcoin Consolidation Continues: (02.16~02.22)
1. Review of Short-term Trading Strategy:
As Bitcoin's price action did not reach the key resistance zone preset last week, and the self-built Momentum Quantitative Model and Spread Trading Model did not trigger top signals, we strictly adhered to the established short-term strategy and did not open any positions last week.
2. Review of Medium-term Trading Strategy:
Medium-term Strategy: Continued holding the 60% short position opened around $89,000 as planned. As of last week's close, the profit was 24.01%.
3. Review of Last Week's Key Price Levels:
Resistance Zone: $72,000~$74,500 area
Support Level: Around $65,000
3. Bitcoin Technical Indicator Analysis: Comprehensive Research Based on Multi-Model and Multi-Dimensional Perspectives
Combined with market movements, the author conducts an in-depth analysis of multiple Bitcoin technical indicators from the perspectives of multi-model and multi-dimension based on a self-built trading system.
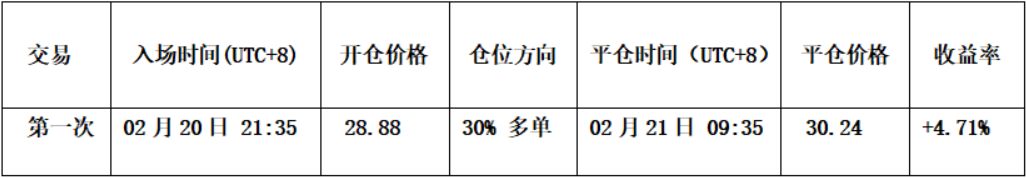
1. As shown in (Figure 2), analysis from the weekly chart:
Bitcoin Weekly K-line Chart: (Momentum Quantitative Model + Sentiment Quantitative Model)
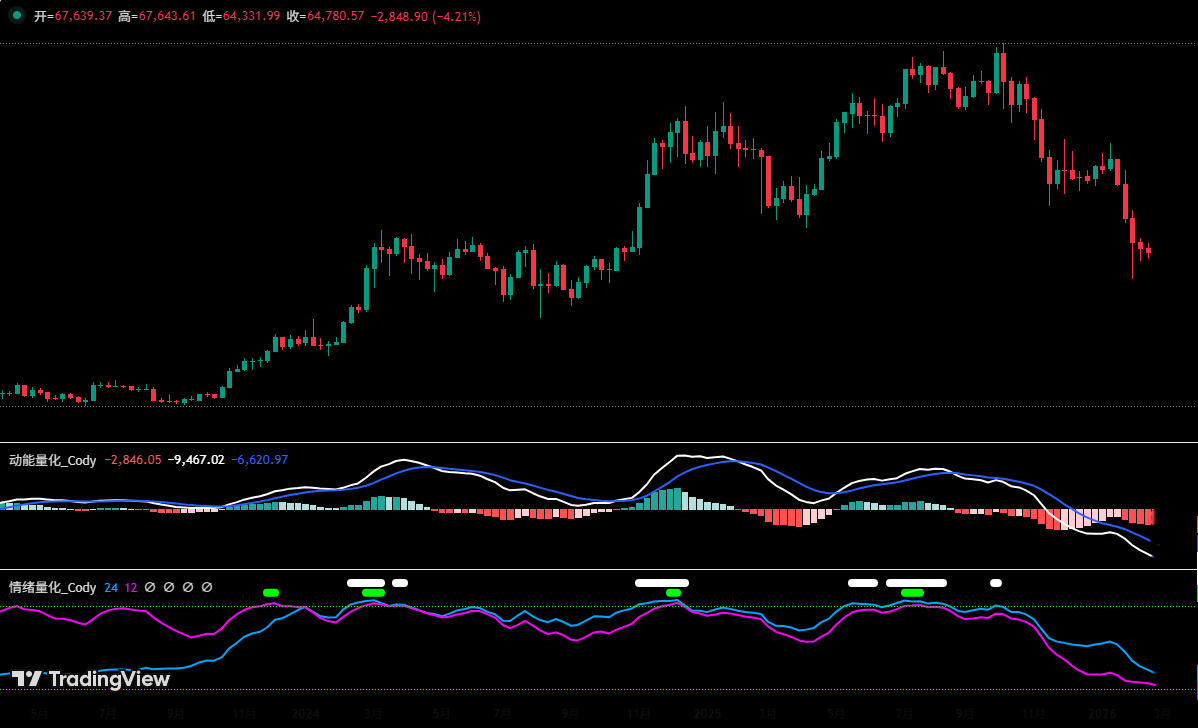
Figure 2
• Momentum Quantitative Model: Technical indicators show the momentum line declining synchronously, with negative energy bars gradually expanding for 4 consecutive weeks, and no momentum divergence signal has appeared.
The Momentum Quantitative Model indicates: Probability of price decline: High
• Sentiment Quantitative Model: The blue sentiment line value is 27, intensity zero; the purple sentiment line value is 10, intensity zero, peak value is 0. This means market oversold panic sentiment has not yet appeared.
The Sentiment Quantitative Model indicates: Index for price bottom support: Neutral
• Digital Monitoring Model: No bottom digital monitoring signal has appeared.
The Digital Monitoring Model indicates: No digital bottom signal appeared; last week's K-line closed as a small bearish candle with a decline of about 1.73%. The chart shows the price has exhibited a pattern of "lower highs and higher lows" for three consecutive weeks, overall forming a converging pattern.
The above data suggests: Bitcoin's weekly chart shows a bearish trend with narrowing declines. The probability of it being a continuation pattern within a downtrend is high.
2. As shown in (Figure 3), analysis from the daily chart:
Bitcoin Daily K-line Chart: (Momentum Quantitative Model + Sentiment Quantitative Model)
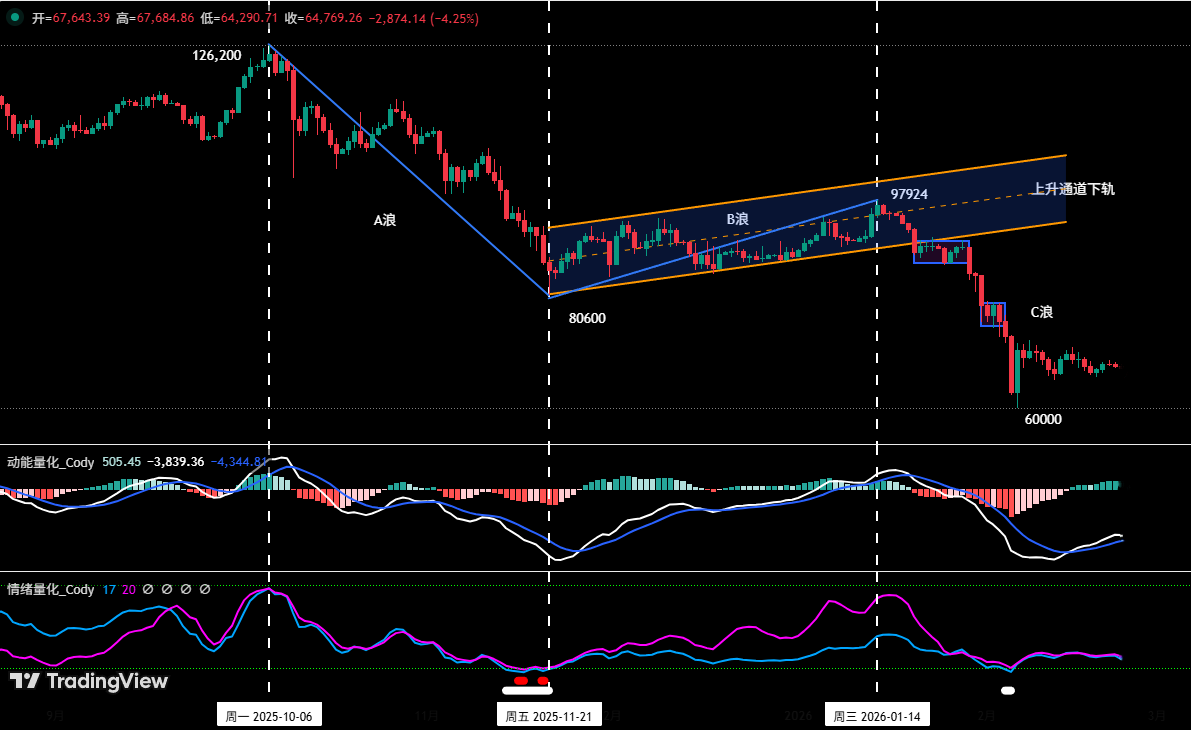
Figure 3
• Momentum Quantitative Model: Last week's overall price action presented a "narrow-range sideways consolidation" pattern. The momentum line formed a "golden cross" below the zero axis and then rose synchronously, with positive energy bars gradually expanding.
The Momentum Quantitative Model indicates: Bullish rebound momentum is being released, requiring observation of volume changes.
• Sentiment Quantitative Model: After the Sentiment Quantitative Model triggered a bottom warning signal (white dot) earlier, the direction of the sentiment lines turned upward. Currently, the blue sentiment line value is 20, intensity zero; the purple sentiment line value is 22, intensity zero. The two lines are almost converging, slowly moving away from the oversold area.
The Sentiment Quantitative Model indicates: The sentiment lines have turned upward, the timeliness of the bottom warning signal has been validated by the market; but the converging state of the two sentiment lines suggests that medium-term and short-term buying funds are not active, and the strength of the price rebound is weak.
The above data suggests: The daily bearish trend has not changed. In the short term, the oversold rebound is continuing.
4. This Week's Market Prediction: (02.23~03.01)
1. Bitcoin Uptrend Center Construction (Based on price action after the February 6 low):
Bitcoin 4-hour K-line Chart
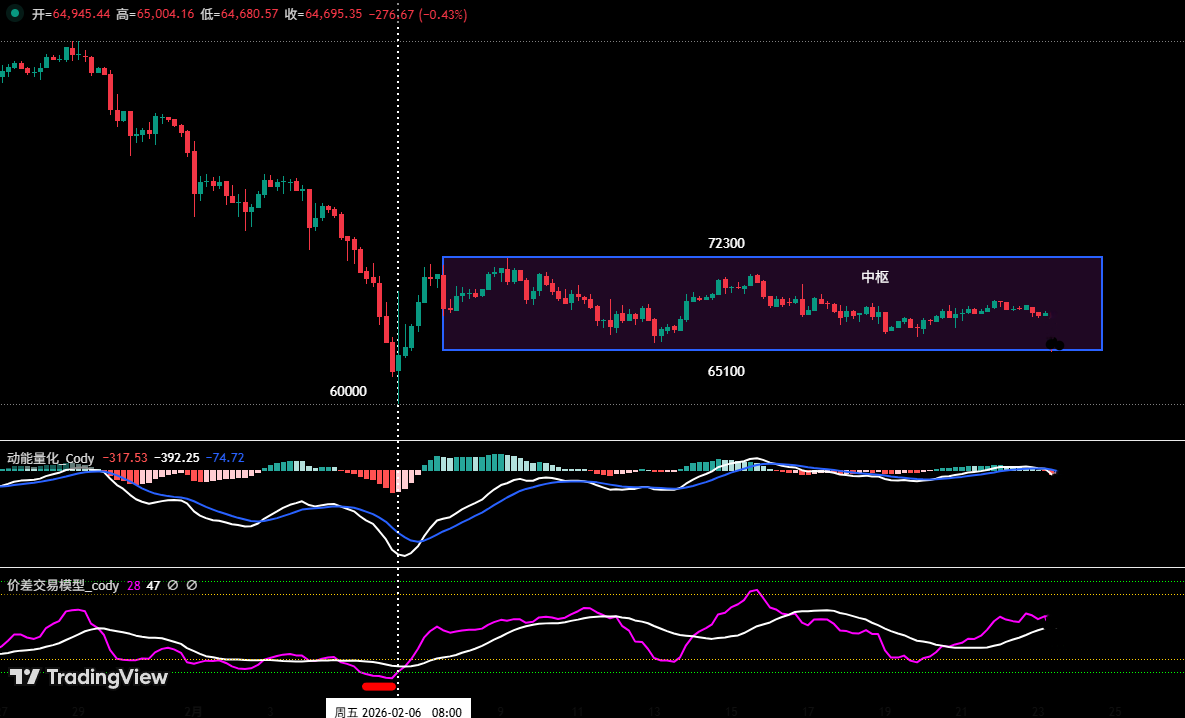
Figure 4
Using Bitcoin's 4-hour chart as the operational timeframe:
• Center Determination: From the 4-hour chart, it is known that the probability of currently constructing an "uptrend center" structure is relatively high. Its upper rail resistance is around $72,300, and the lower rail support is around $65,100.
• Core Deduction and Operational Plan:
• Scenario One (Breakout Failure): If the subsequent price rebound cannot effectively stand above the center's upper rail (around $72,300), the center consolidation pattern will continue. Operation: Long positions should consider reducing on rallies.
• Scenario Two (Successful Breakout): If the subsequent price rebound effectively stabilizes above the center, a successful breakout is confirmed. Operation: The uptrend may continue, long positions can be held temporarily, waiting for liquidation signals.
• Scenario Three: If the subsequent price adjustment effectively breaks below the center's lower rail (around $65,100), it will test the support effect of the February 6 low again.
2. This Week's Core View: Focus on the battle between bulls and bears around the gains and losses near the center's upper and lower rails. Strategically, firmly implement the operational principle of "reducing positions on rallies (longs), controlling risk".
3. Core Resistance Levels:
• First Resistance Zone: $72,300-$74,500 area (near the April 2025 low)
• Second Resistance Zone: $79,500-$80,600 area (near the Wave B starting point)
4. Core Support Levels:
• First Support Level: Around $65,000 (previous K-line bottom pattern low)
• Second Support Zone: $60,000-$62,500 area (near the February 6 low)
• Third Support Level: Around $57,400 (near the 210-week moving average)
5. This Week's Operational Strategy (Excluding Impact of Sudden News): (02.23~03.01)
1. Medium-term Strategy: Maintain 60% short position. If the rebound effectively breaks above $74,500, the position can be reduced to 40%.
2. Short-term Strategy: Utilize 30% of capital, set stop-loss points, and look for "spread" trading opportunities based on support and resistance levels. (Using 30-minute/60-minute as operational timeframe).
3. Since the market's medium-term direction is bearish, short-term operations should follow the principle of "go with the trend, sell on rallies". To dynamically respond to the market's complex evolution and combine signals from the self-built trading model, we have formulated two short-term operational plans, A/B:
• Plan A: If the price rebounds to near the center's upper rail at $72,300:
• Open Position: When the rebound reaches this resistance level and triggers a resistance signal combined with a model top signal, a 15% short position can be established.
• Risk Control: Initial stop-loss for the short position is set above $75,500.
• Close Position: When the price falls to near important support levels combined with model signals, positions can be gradually closed to take profits.
• Plan B: If the price rebounds to near $74,500:
• Add Position: When the rebound reaches this area and meets resistance combined with a model top signal, an additional 15% short position can be added.
• Risk Control: Initial stop-loss for the short position is set above $75,500.
• Close Position: When the price falls to support levels combined with model signals, positions can be gradually closed to take profits.
6. Special Notes:
1. When Opening a Position: Immediately set the initial stop-loss level.
2. When Profit Reaches 1%: Move the stop-loss to the opening price (breakeven point) to ensure capital safety.
3. When Profit Reaches 2%: Move the stop-loss to the 1% profit level.
4. Continuous Tracking: Thereafter, for every additional 1% profit in price, move the stop-loss up by 1% accordingly, dynamically protecting and locking in profits.
Financial markets change rapidly, and all market analysis and trading strategies require dynamic adjustment. All views, analytical models, and operational strategies mentioned in this article are derived from personal technical analysis, intended solely for personal trading log purposes, and do not constitute any investment advice or operational basis. The market carries risks, investment requires caution. Please do not make decisions based on this.


