
What is Driving the Once-in-45-Years Super Rally for Gold, Silver, and Copper?
- Core Viewpoint: Gold, silver, and copper are experiencing a structural bull market, driven by a surge in industrial demand from AI infrastructure and energy transition, multi-year supply shortages, and a reshaping of safe-haven demand for gold against the backdrop of central bank "de-dollarization." This signifies a fundamental shift in the global valuation logic for hard assets.
- Key Factors:
- Severe Supply Shortage: The silver market has seen supply deficits for five consecutive years, with a cumulative shortfall of nearly 820 million ounces; copper is projected to face a supply gap of 10 million metric tons by 2040, representing nearly 40% of current production, with new mine development cycles lasting 10-15 years.
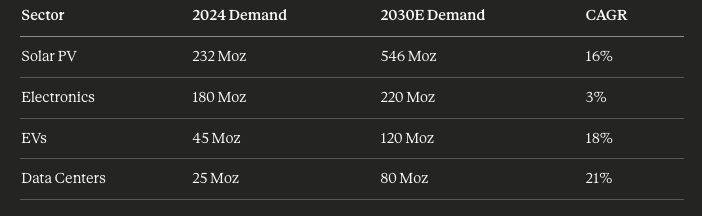
- Surge in AI and Energy Demand: AI data centers consume three times more copper than traditional data centers, with a single facility potentially using up to 50,000 tons; silver demand from the solar industry has grown from 54 million ounces a decade ago to nearly 250 million ounces in 2025, and is expected to account for 40% of global demand by 2030.
- Shift in Central Bank Gold Buying Behavior: Since 2022, global central banks have purchased over 1,000 tons of gold annually for three consecutive years, more than double the pre-pandemic average. Countries like China are significantly reducing their holdings of U.S. Treasuries while increasing gold reserves, positioning gold as the preferred safe-haven asset during geopolitical crises.
- Price Performance and Market Expectations: Year-to-date in 2025, prices for gold, silver, and copper have risen by 72%, 120%, and 40% respectively, marking the first time in 45 years that all three have simultaneously reached record highs. Institutions forecast copper prices could reach $12,500 per ton and gold could climb to $5,055 per ounce.
- Major Risk Factors: Easing geopolitical tensions could diminish safe-haven premiums; high prices may accelerate material substitution (e.g., silver-thrifting in solar cells) and recycling; an economic slowdown could dampen industrial demand; the assets themselves have a history of high volatility.
Original author: Eli5DeF
Original compilation: Yuliya, PANews
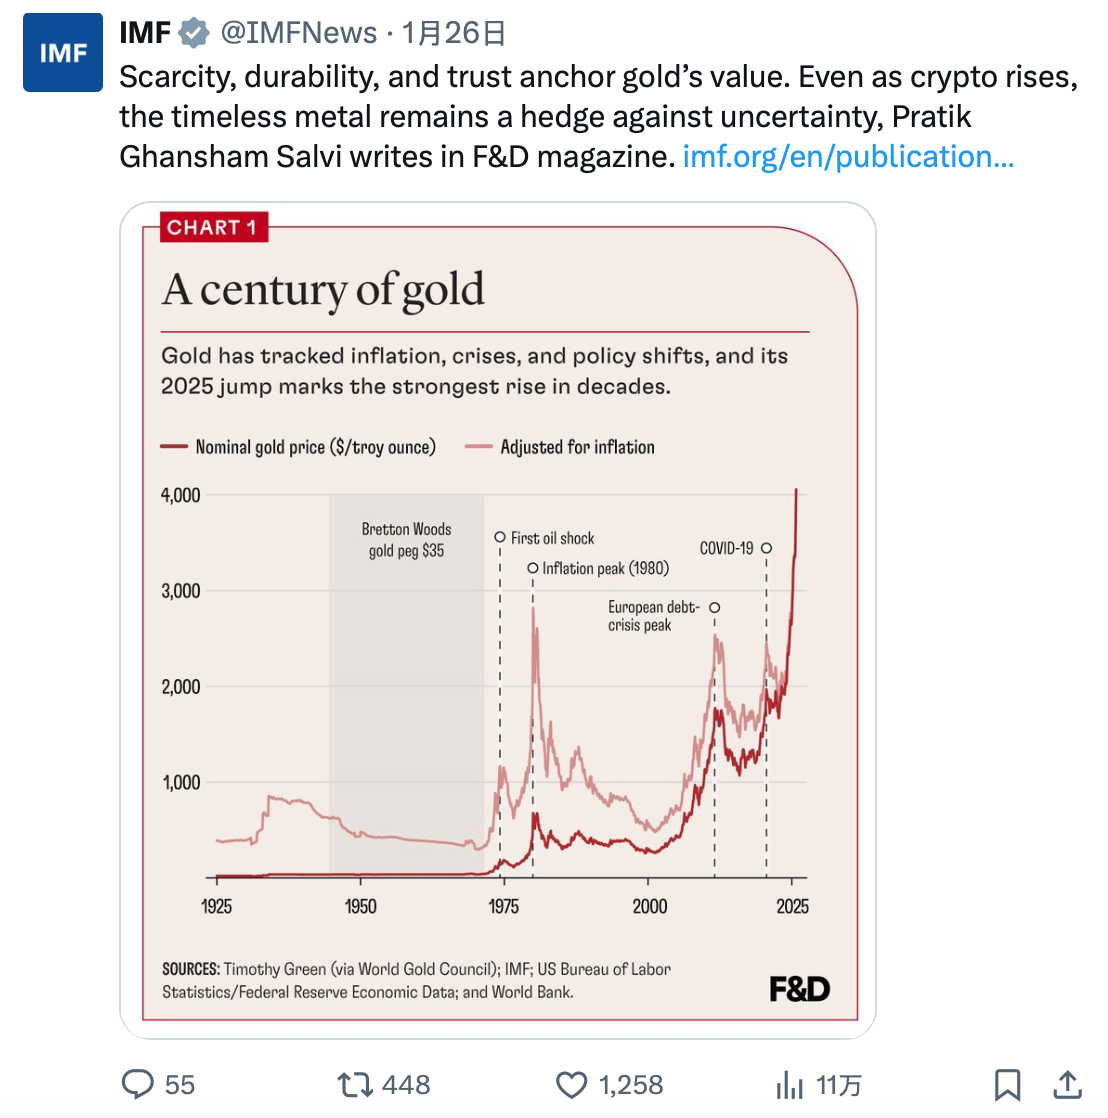
Driven by a "perfect storm" of supply scarcity, booming artificial intelligence (AI) infrastructure, and central banks' distancing from the US dollar, gold, silver, and copper are experiencing their hottest market since 1979.
This article will delve into over 40 research reports, distill core viewpoints, and explore their future trends.
TL;DR
- Data Level: Year-to-date 2025, gold prices are up 72%, silver is up 120%, and copper is up 40%. This marks the first time in 45 years that all three have simultaneously hit record highs.
- Core Argument: This is not a cyclical rebound but a fundamental shift in the global valuation logic for hard assets.
- Investment Opportunity: Silver mining ETFs have delivered a 195% return in 2025, and this trade is not over yet.
- Risk Warning: Peace agreements, the emergence of material substitutes, and short-term market corrections could lead to price pullbacks of 20% to 40%.
From AI to Energy: Gold, Silver, and Copper Become the New "Troika"
Currently, all eyes are on AI chips, but the real supply bottleneck lies in the copper wires connecting these chips.
A sobering statistic: AI data centers consume three times more copper than traditional data centers, with a single facility potentially using up to 50,000 tons. Microsoft's $500 billion "Stargate" project alone could consume more copper than the annual output of some small countries.
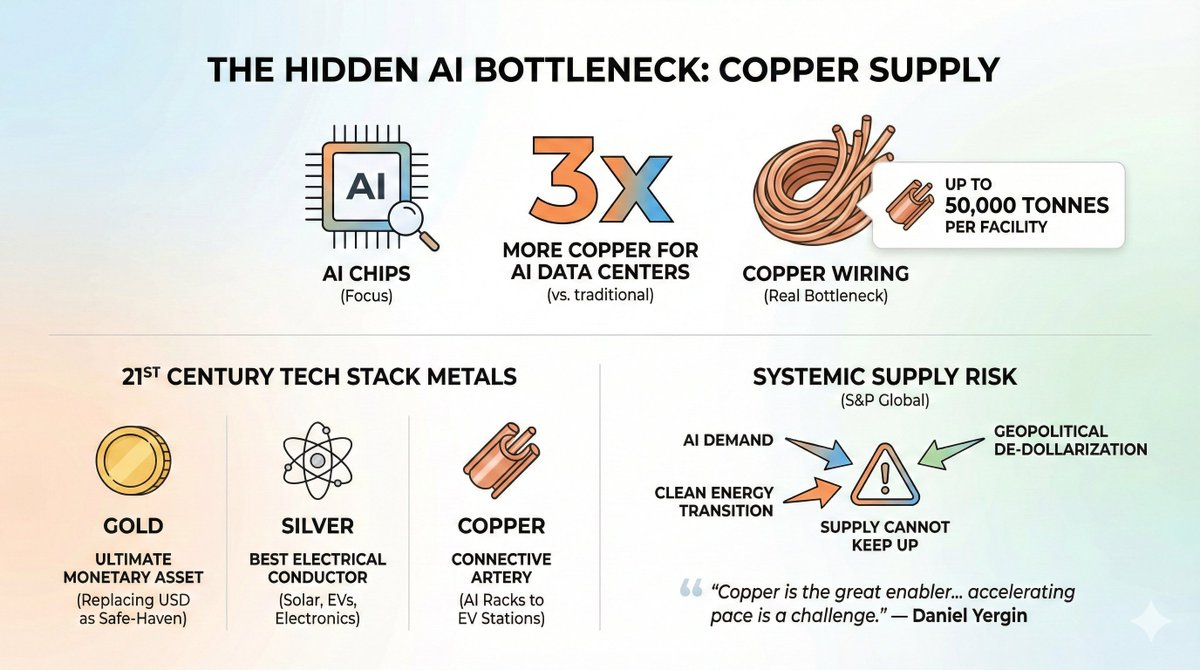
And it's not just AI driving demand. The entire 21st-century technology stack is built on these three metals:
- Gold: The ultimate monetary asset, increasingly replacing the US dollar as the primary safe haven during geopolitical crises.
- Silver: The most conductive metal on Earth, crucial for solar panels, electric vehicles, and data center electronics.
- Copper: The "arteries" connecting all electrified systems, found everywhere from AI server racks to EV charging stations.
The convergence of AI demand, the clean energy transition, and geopolitical "de-dollarization" has created what S&P Global calls a "systemic risk" for the global economy, as supply struggles to keep pace with demand.
"Copper is the great enabler of electrification, but the acceleration of electrification is posing an increasingly severe challenge to copper supply."
— Daniel Yergin, Vice Chairman, S&P Global
This is not hyperbole. Let's break down the data.
I. The Unsolvable Supply Crisis
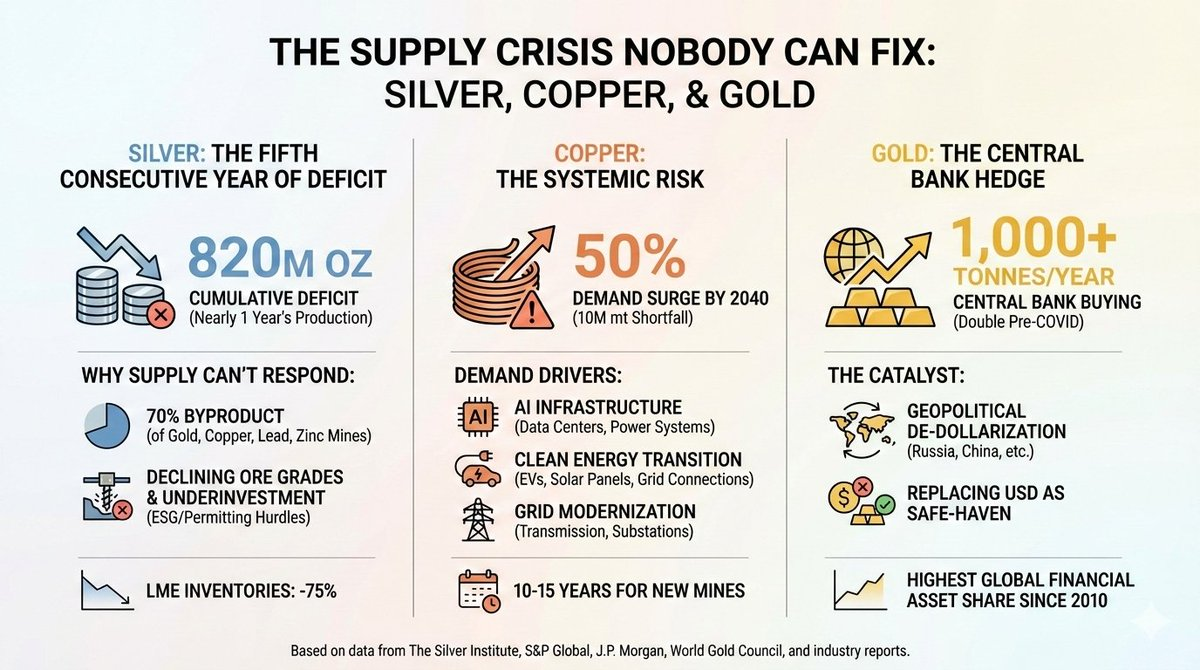
Silver: The Fifth Consecutive Year of Supply Deficit
The silver market has not been in balance since 2020, and the situation is worsening.
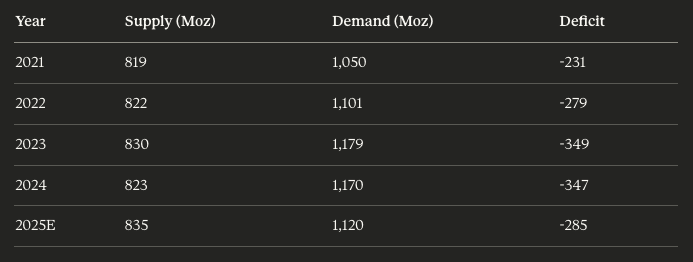
The cumulative supply deficit from 2021 to 2025 is nearly 820 million ounces, almost equivalent to a full year of global production. LME silver inventories have plummeted 75% from their 2019 peak. In October 2025, silver briefly touched a record high of $54.24/oz before retreating.
Why Can't Supply Keep Up?
A little-known secret of silver mining is that 70% of its production comes as a by-product of gold, copper, lead, and zinc mining. This means that when the market needs more silver, you can't simply mine more silver; the primary metal mining must also be economically viable to drive increased silver output. Currently, that's not the case.
Primary silver mines themselves face challenges: declining ore grades, severe underinvestment in exploration over the past decade, and ESG and permitting hurdles that can delay new projects by over 10 years.
The Silver Institute states bluntly: "Investment in silver mines has been insufficient over the past decade."
Copper: Systemic Risk
If silver's situation is concerning, copper's problem is existential.
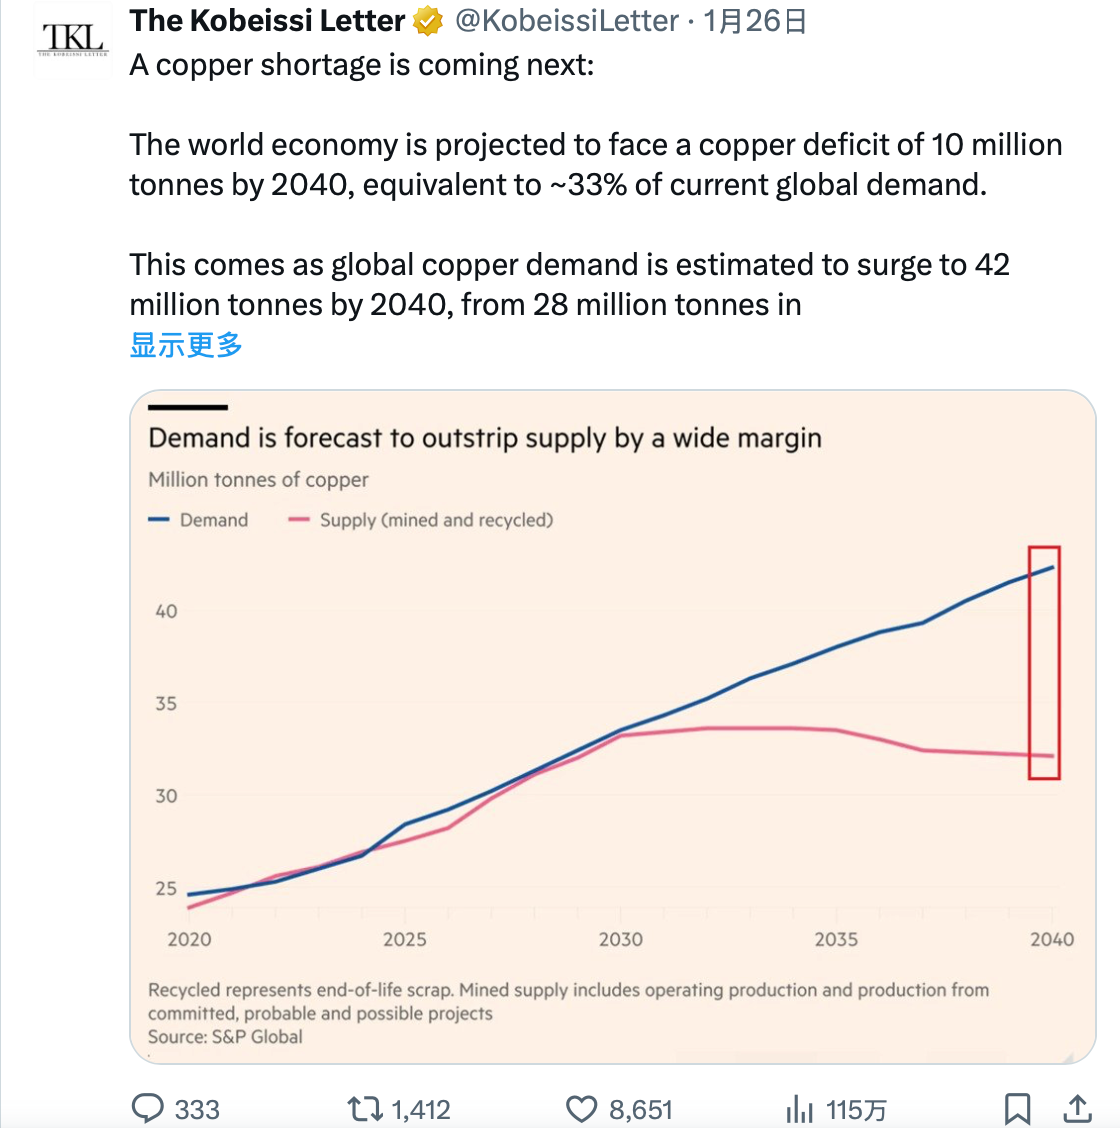
S&P Global's January 2026 report forecasts global copper demand will surge 50% by 2040, from 28 million metric tons to 42 million metric tons. Supply growth, however, is flattening or declining.
The projected supply deficit by 2040 is 10 million metric tons, nearly 40% of current global production.
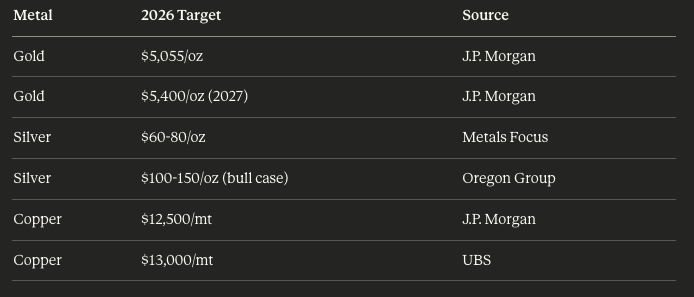
J.P. Morgan predicts a refined copper market deficit of 330,000 tons for 2026 alone, with prices potentially reaching $12,500/metric ton by mid-year.
What's Driving Demand?
Three macro trends are converging simultaneously:
- AI Infrastructure: Half of US GDP growth in 2025 came from AI-related spending, including data centers, chips, and power systems. A hyperscale AI facility requires 27 to 33 tons of copper per megawatt of capacity. The underlying data is stark: global data center power demand is projected to grow from 2% of global electricity today to 9% by 2050.
- Clean Energy Transition: An EV uses 2.9 times more copper than an internal combustion engine car, about 60 kg more per vehicle. Annual solar PV capacity additions now exceed 500 GW, and each gigawatt of solar panels, inverters, and grid connections consumes thousands of tons of copper.
- Grid Modernization: Getting power to AI data centers is actually more copper-intensive than the data centers themselves. Grid upgrades, transmission lines, substations—all heavily rely on copper.
Why Can't Supply Keep Up?
New copper mines take 10 to 15 years from discovery to production, and there are few projects in the pipeline. A series of major disruptions in 2025 exacerbated the shortage—a landslide at Indonesia's Grasberg (the world's second-largest copper mine), ongoing issues at the DRC's Kamoa-Kakula, and drought at Chile's El Teniente.
The US's Resolution Copper project, which could have been a major domestic source, is stalled in litigation over Apache sacred lands and is at least a decade away from production.
As one analyst noted, "Mining companies are pushing a compelling long-term shortage story—and the market is buying it. But conviction and fundamentals are not the same thing."
For now, however, the fundamentals support the conviction.
Gold: The Central Bank Hedge
Gold's story is different. There is no industrial supply crisis; gold production is relatively stable at around 3,000 tons annually.
The real change is in who is buying.
Since Russia's invasion of Ukraine in 2022 and the freezing of its FX reserves, central banks have been accumulating gold at an unprecedented pace. For three consecutive years, global central bank purchases have exceeded 1,000 tons annually, more than double the pre-pandemic average.
China alone has added to its gold reserves for 13 consecutive months while reducing its holdings of US Treasuries to a 17-year low ($688 billion as of end-2024).
This is not speculation; it's a structural shift in how sovereign wealth managers think about reserve assets.
Gold's share of total global financial assets has risen to 2.8%, its highest since 2010, according to the World Gold Council. J.P. Morgan forecasts central bank buying will continue at 755 tons in 2026, with gold potentially reaching $5,055/oz in Q4.
One under-discussed catalyst:
Prior to 2022, the US dollar was the primary safe-haven asset during geopolitical crises. That has changed. During the 2025 Venezuela crisis—when the US captured Nicolás Maduro—gold prices surged while the dollar barely moved.
Gold has replaced the dollar as the market's preferred safe haven when geopolitical risk spikes.
II. The Unforeseen AI Demand
For readers focused on the tech sector, the following will be particularly compelling.
Data Centers: The New Copper Giants
Traditional data centers were already significant copper consumers for power distribution, cooling, and networking. AI data centers are on a completely different scale.
The numbers:
- A typical hyperscale data center uses 2,000 to 3,000 tons of copper.
- AI-focused facilities can use up to 50,000 tons of copper.
- Global AI infrastructure investment exceeded $500 billion in 2025.
- Data center power demand grew 19% in 2024 alone, compared to 8% growth in 2022.
BloombergNEF predicts data centers could consume 500,000 metric tons of copper annually by 2030, about 2% of global production, up from virtually zero a decade ago.
But the real demand isn't from inside the data center; it's from the grid infrastructure needed to power it.
"The data center itself is becoming less copper-intensive per unit, but getting the power to the data center is extremely copper-intensive." — Colin Hamilton, BMO Capital Markets
Every 100 MW AI facility requires massive grid upgrades—transmission lines, substations, transformers—all competing for limited copper supply.
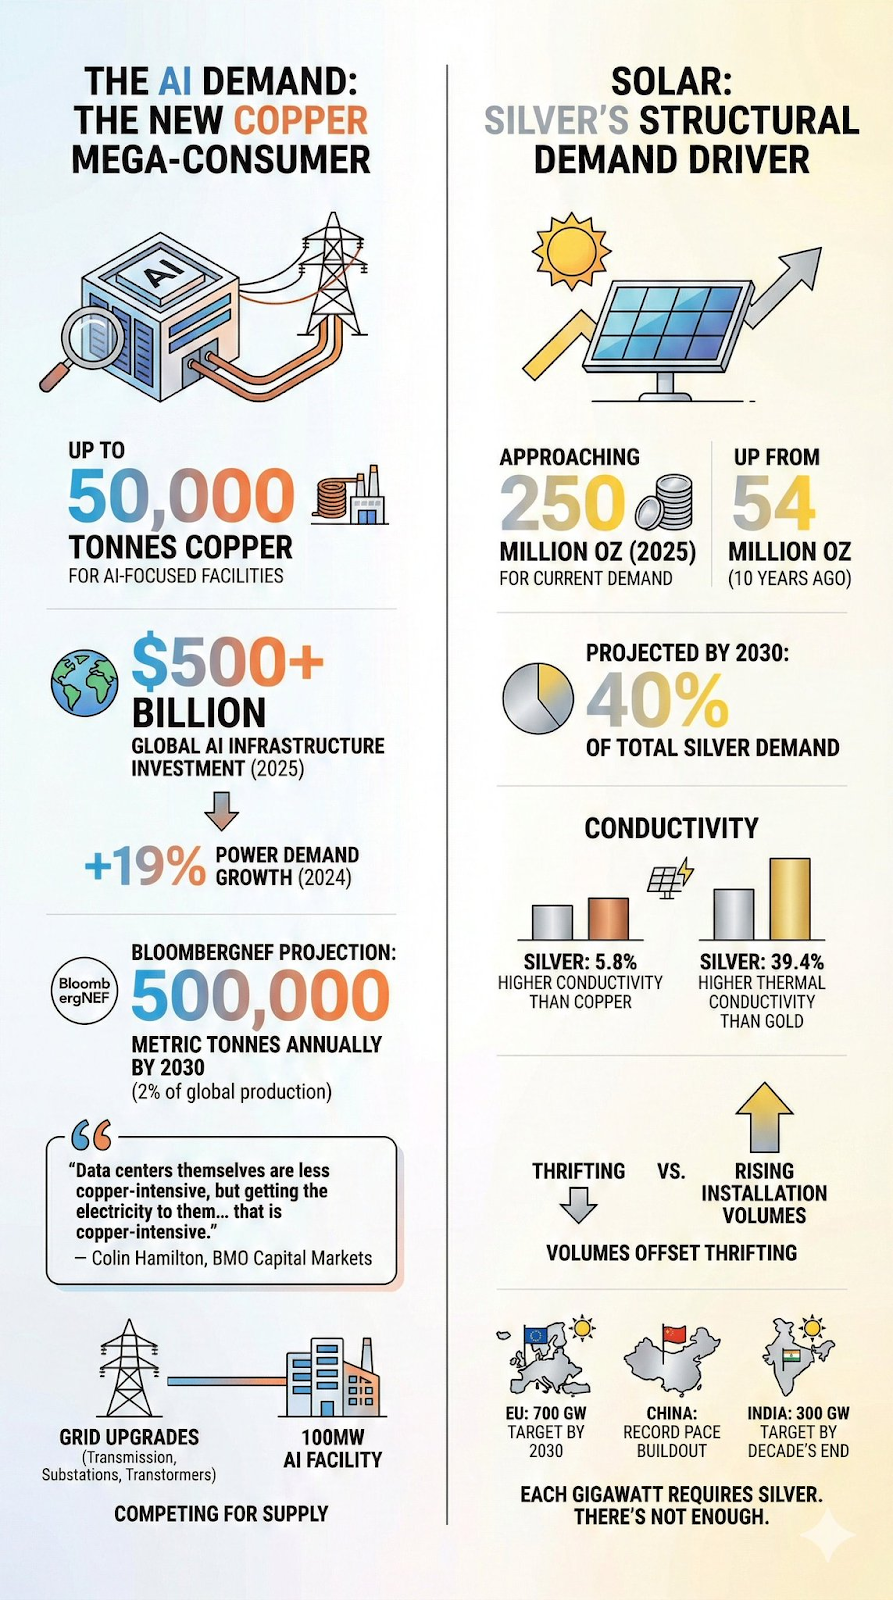
Solar: The Structural Demand Driver for Silver
The solar PV industry has transformed the silver market. A decade ago, solar consumed 54 million ounces of silver annually. By 2025, that figure approached 250 million ounces and is still growing.
Solar is projected to account for 40% of total global silver demand by 2030.
Silver's superior conductivity (5.8% higher than copper) and thermal conductivity (39.4% higher than gold) make it irreplaceable in high-efficiency applications. While solar cell manufacturers are pushing "silver thrifting" (reducing silver content per panel), rising installation volumes completely offset these savings.
The EU targets 700 GW of solar capacity by 2030; China continues its build-out at an unprecedented pace; India plans to reach 300 GW of solar by the end of the decade.
Every gigawatt requires silver, and silver supply is stretched thin.
III. Geopolitical Catalysts
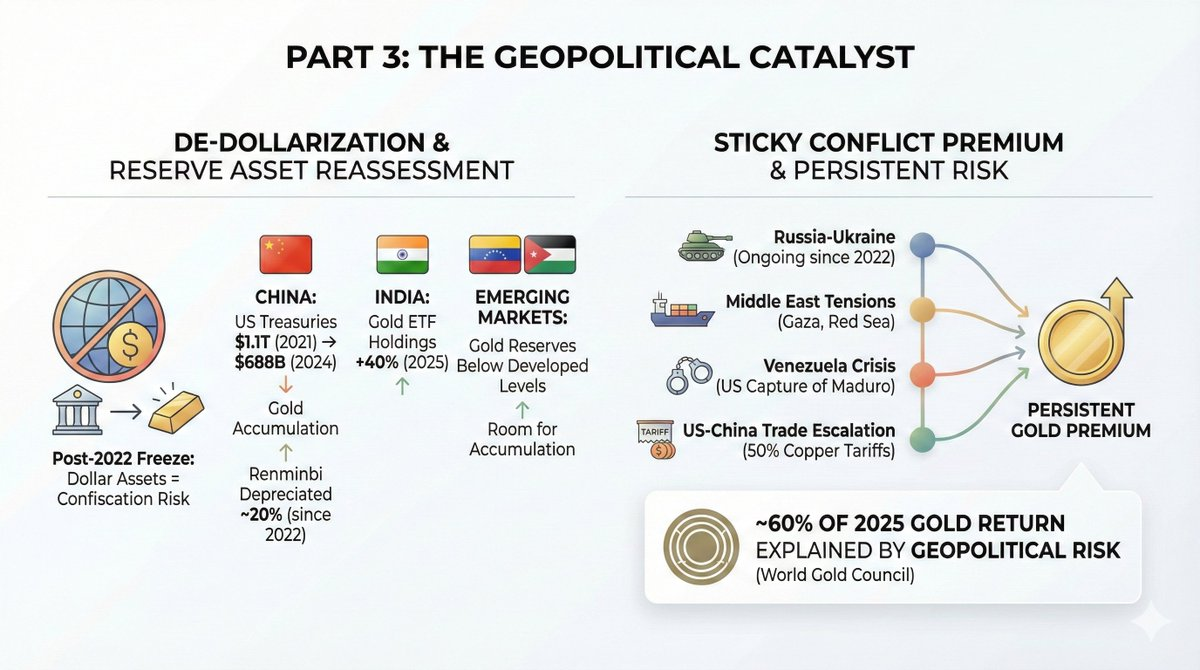
"De-dollarization" is Real
The Russia-Ukraine war not only disrupted commodity supplies but triggered a fundamental rethink of reserve asset allocation among sovereign wealth managers.
When Western nations froze Russia's FX reserves in 2022, central banks everywhere took note. The message: dollar-denominated assets carry confiscation risk.
The response has been clear:
- China: Cut its US Treasury holdings from $1.1 trillion in 2021 to $688 billion in 2024, while accumulating gold heavily.
- India: Gold ETF holdings increased 40% in 2025.
- Emerging Markets: Their gold reserve levels remain far below those of developed economies, indicating room for continued accumulation.
The renminbi has depreciated nearly 20% since early 2022, making gold a more attractive store of value for Chinese savers and institutions.
Conflict Premiums Are Sticky
Traditional market wisdom held that geopolitical premiums in commodity prices fade quickly once headlines cool. Not anymore.
2025 witnessed multiple geopolitical flashpoints:
- Russia-Ukraine conflict (ongoing since 2022)
- Middle East tensions (Gaza, Iran strikes, Red Sea shipping disruptions)
- Venezuela crisis (US capture of Maduro)
- Escalating US-China trade friction (50% tariff on copper announced)
Each event reinforced gold's safe-haven status. The cumulative effect: a persistent premium that hasn't dissipated even during relatively calm periods.
World Gold Council analysis shows geopolitical risk explained about 60% of gold's 2025 returns, the highest contribution on record.
IV. Investment Logic
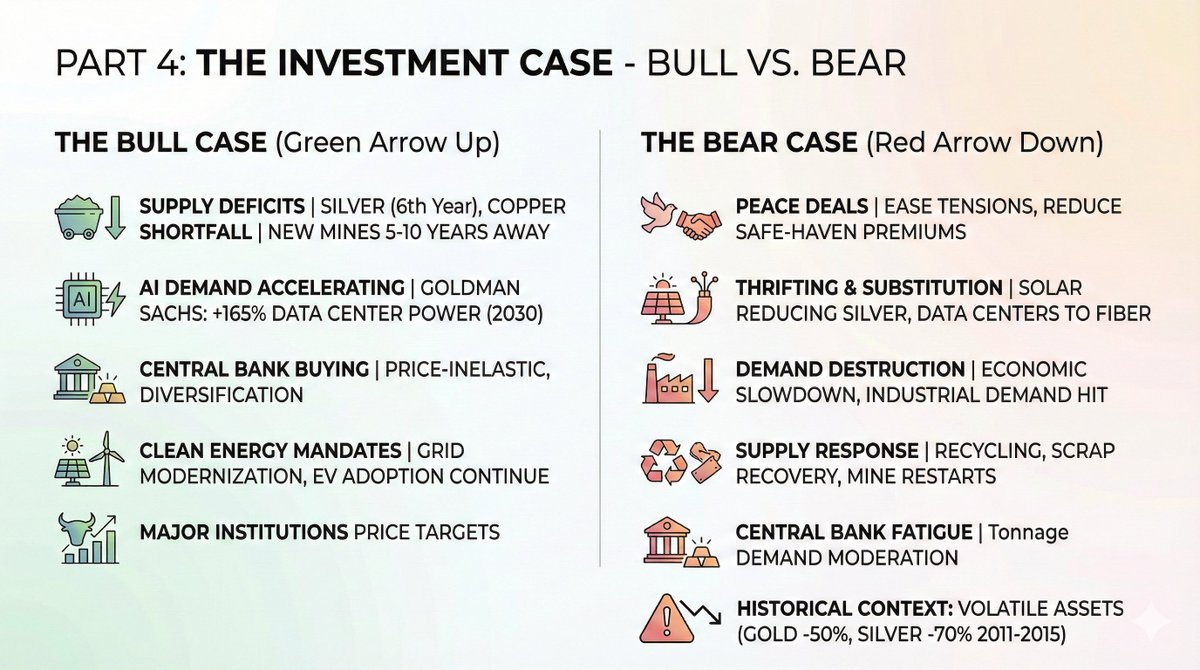
Bull Case
Persistent structural drivers:
- Ongoing Supply Deficits: Silver is forecast for a sixth consecutive deficit year in 2026. Copper shortages are widening. New mine supply takes 5-10 years to come online.
- AI Demand Acceleration: Goldman Sachs predicts a 165% increase in data center power demand by 2030. Every watt requires copper.
- Continued Central Bank Buying: Central banks are price-insensitive even above $4,000/oz. The urgency for diversification outweighs short-term price sensitivity.
- Clean Energy Mandates Remain: Despite political shifts, grid modernization and EV adoption continue globally.
Price targets from major institutions:
Bear Case
Risks to consider before going all-in:
- Peace Deals: Easing Russia-Ukraine tensions, de-escalation in the Middle East, or US-China trade détente could significantly reduce safe-haven premiums.
- Thrifting & Substitution: Solar manufacturers are aggressively reducing silver use. Data centers are shifting some applications to fiber optics. These trends accelerate at high prices.
- Demand Destruction: An economic slowdown could severely hit industrial demand. Remember: 60% of silver demand is industrial.
- Supply Response: High prices incentivize recycling, scrap recovery, and restarting marginal mines. Some "deficit" could be met from above-ground stocks.
- Central Bank Fatigue: Above $4,000/oz, central banks need to buy fewer tons to achieve the same dollar allocation target. Tonnage demand could slow.
Historical context: After the post-financial crisis rally, gold fell 50% from 2011 to 2015, while silver crashed 70%. These are high-volatility assets.
How to Position
Investment vehicles by risk profile:
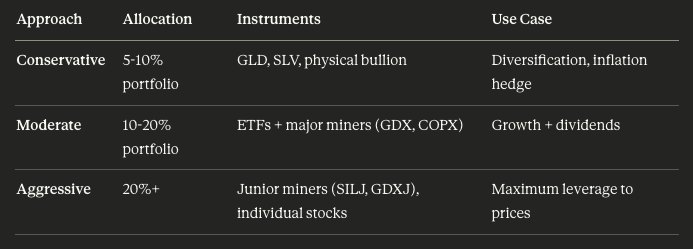
Selected ETFs:
1. Physical Exposure:
- $GLD (SPDR Gold Shares) — Largest, most liquid gold ETF.
- $SLV (iShares Silver Trust) — Most liquid silver ETF.
- $PSLV (Sprott Physical Silver) — Redeemable for physical metal.
2. Mining Exposure:
- $GDX (VanEck Gold Miners) — Major gold miners, up 166% YTD 2025.
- $SILJ (Amplify Junior Silver Miners) — Junior silver miners, up 195% YTD 2025.
- $COPX (Global X Copper Miners) — Broad copper miner exposure, up 80% YTD 2025.
3. Stocks to Watch:
- Wheaton Precious Metals ($WPM) — "Streaming" model with lower operational risk.
- Pan American Silver ($PAAS) — Largest primary silver-focused producer.financeinvestcurrencyAI


