
Bitcoin's Key Channel Broken? History Won't Simply Repeat Itself | Guest Analysis
- Core View: Analyst Cody, based on quantitative models and historical structural analysis, believes Bitcoin is currently at a critical decision point. Close attention must be paid to the holding or breaking of the lower boundary of the ascending channel, which will determine whether the short-term trend continues with a Wave B rebound or initiates a deeper Wave C correction.
- Key Elements:
- Market Validation: Last week's price action precisely validated the analyst's view, with the price breaking below the core $94,500-$95,000 range and finding support at the indicated $86,000 level.
- Historical Comparison: The current correction structure bears a striking resemblance to the pattern following November 2021, exhibiting a three-wave A-B-C structure, with the market potentially currently in Wave C.
- Critical Level: The lower boundary of the ascending channel is the short-term "lifeline." A decisive break below could accelerate a decline towards $84,000 or even $80,600; holding above it could lead to a rebound testing the $94,500 resistance.
- Quantitative Signals: Weekly-level models indicate a bearish trend. The daily-level momentum line has crossed or is about to cross below the zero axis, showing initial signs of a bearish setup.
- Trading Strategy: This week's core focus is to execute corresponding short-term shorting plans (Plan A/B) based on whether the channel's lower boundary is broken, while strictly adhering to dynamic stop-loss discipline.
- Target Forecast: If the Wave C correction continues, key support levels below are at $80,600 (Wave B starting point) and $75,200 (coinciding Fibonacci retracement and historical low).
Odaily's exclusive market analyst, Cody, holds a Master's in Financial Statistics from Columbia University. Since his university days, he has focused on quantitative trading in US stocks and gradually expanded into digital assets like Bitcoin. Through practical experience, he has developed a systematic quantitative trading model and risk control framework. He possesses keen data-driven insights into market volatility and is dedicated to continuous growth in the professional trading field, pursuing stable returns. Each week, he will delve deeply into changes in BTC's technicals, macro environment, and capital flows, review and showcase practical trading strategies, and preview noteworthy upcoming events for your reference.

Core Summary of the Trading Weekly Report:
In our previous article, we compared the BTC price structure of 2021 and 2025, suggesting history might repeat (BTC would continue to decline). This received significant feedback, with some analysts holding differing views. Below, based on this week's updates, we provide a detailed analysis of the current market's price action characteristics and future focal points. We welcome everyone to discuss together.
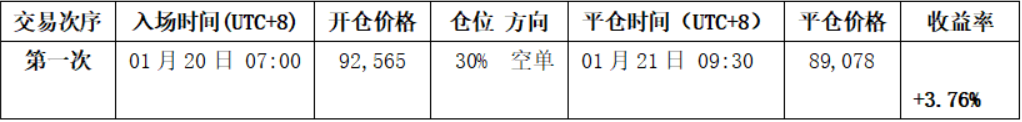
• Strategy Execution (Short-term) Performance Verification: Last week's trading strictly followed the established strategy, completing one short-term operation (1x leverage) and successfully achieving a return of 3.76%. (See Figure 1 for details)
• Core View (Short-term) Verification: At the beginning of last week, the price quickly broke below the core range of $94,500–$95,000, re-entering the original consolidation range of $84,000–$94,500 and continued moving towards the lower boundary of that range. It is particularly noteworthy that last week's price low precisely landed on the $86,000 support level we previously identified. Overall, last week's price action and the performance of key support levels were precisely validated by the market.
The following sections will review the market outlook, strategy execution, and specific trading process in detail.
1. Learning from History: A Dialectical View of the Current Market (See Figure 3)
By comparing the weekly-level corrections following two historical peaks of BTC, we observe a strikingly similar structural pattern between the correction starting in October 2025 and the one in November 2021. Currently, the market is at a critical technical decision point.
1. Key Technical Position: The Fate of the Ascending Channel's Lower Boundary
The rebound starting from the low of $80,600 on November 21, 2025, has formed a clear ascending channel. The lower boundary of this channel has become the "lifeline" determining the short-term trend.
2. Two Possible Paths for Bitcoin's Subsequent Price Action:
• If the price re-establishes itself above the channel's lower boundary, the Wave B rebound is expected to continue. The next step would first test resistance near $94,500, followed by a challenge of the key resistance level at the 21-week moving average. Realizing this path requires support from macro factors, particularly a shift towards a more dovish policy expectation from the Federal Reserve.
• If the price effectively breaks below the channel's lower boundary and the model's momentum line (daily) falls below the zero axis, it would signal a return to a bearish market on the daily timeframe. This would mean the Wave B rebound initiated on November 21, 2025, may have concluded, and the Wave C correction will extend further, significantly increasing the likelihood of the price falling below $80,600.
3. Analysis of the Three-Wave Correction Structure: Based on the premise of an effective break below the channel's lower boundary
The current correction starting in October 2025 exhibits a typical three-wave structure:
• Wave A Correction: $126,200 (2025-10-06) to $80,600 (2025-11-21), lasting 46 days, a decline of 36%.
• Wave B Rebound: $80,600 (2025-11-21) to $97,924 (2026-01-14), lasting 54 days, a gain of 21.5%. This phase represents a technical recovery.
• Wave C Correction: $97,924 (January 14) to present. The market is currently in this phase, and the fate of the channel's lower boundary will be a key basis for judging the intensity of Wave C.
4. Wave C Correction Target Predictions:
• $80,600, which is the starting point of Wave B. An effective break below this level would suggest the completion of the A-B-C three-wave correction structure starting from $126,200.
• $75,200. This level coincides with both the 50% Fibonacci retracement of Wave A's decline and the correction low from April 2025, forming a significant historical support zone.
"History repeats itself, but not simply" is the most profound dialectic in financial markets. It requires investors to respect historical patterns while also discerning the uniqueness of the current market. Therefore, all rational market outlooks are probabilistic projections derived from a comprehensive analysis of fundamentals and technical structure, not deterministic prophecies. Their ultimate purpose is not to predict the future precisely but to formulate more resilient response strategies.
2. Bitcoin Market Review Last Week: (01.19~01.25)
1. Review of Last Week's Short-term Operations: As shown in (Figure 1)
①、Summary of Trade Details: (No leverage used)
We strictly followed the trading signals generated by our self-constructed Spread Trading Model and Momentum Quantification Model, combined with our market outlook, to execute one short-term trade, achieving a profit of 3.76%.
The specific trade details and review are as follows:
Bitcoin 30-minute K-line chart: (Momentum Quantification model + Spread Trading model)
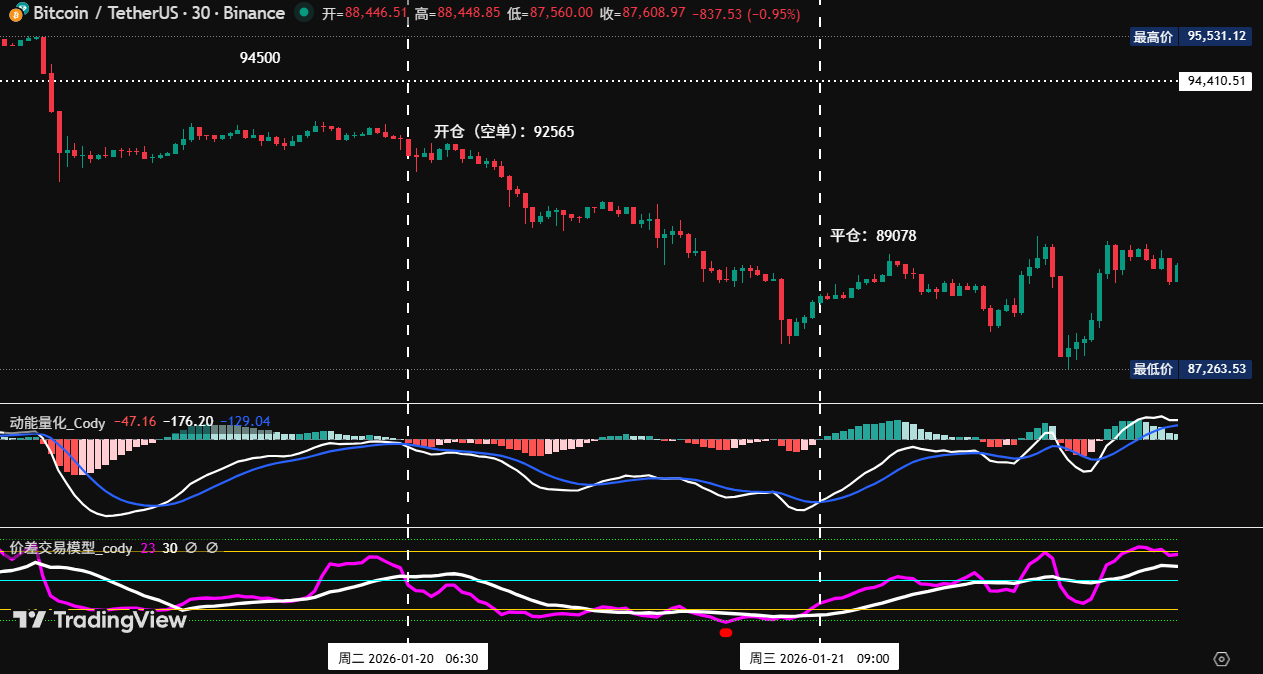
Figure 1
②、Short-term Trade Review:
• First Trade (Profit 3.76%): This operation executed Plan B (shorting upon effective break below the key area) strategy: When the price broke below the $94,500–$95,000 area and failed to rebound strongly, while the Spread Trading Model and Momentum Model simultaneously triggered top signals, and the two momentum lines formed a death cross below (near) the zero axis, constituting a triple bearish signal. Based on this, we established a 30% short position at $92,565. Subsequently, the market corrected as anticipated. When the price fell to a significant support level, the Spread Model first issued a bottom warning signal (red dot), followed by the Momentum Quantification Model and Spread Trading Model resonating again to generate a bottom signal. Accordingly, we closed the entire position at $89,078, achieving the expected profit target.
2. Review of Last Week's Market Outlook and Operational Strategy:
①、Last week clearly emphasized: Focus on the fate of the $94,500–$95,000 area. An effective break below would maintain consolidation within the $84,000–$94,500 range.
②、Review of Key Levels: Resistance was seen at the $94,500–$95,000 area; first support at the $89,500–$91,000 area, second support at $86,000–$86,500.
②、Review of Operational Strategy:
• Medium-term Strategy: Stay in cash.
• Short-term Strategy: Since the price effectively broke below the $94,500–$95,000 area, execute operations according to Plan B (see below):
• Entry: If a rebound to this area confirms the break is effective, a 30% short position can be established.
• Risk Control: Initial stop-loss for the short position set around 1.5% above the entry price (i.e., 1.015 * entry price).
• Exit: When approaching $86,500 and combined with model signals, gradually close the position to take profits.
3. Bitcoin Price Structure: Daily Timeframe Maintains Bearish Pattern
Combined with market movements, the author, based on a self-constructed trading system, provides an in-depth analysis of Bitcoin's price structure from multiple models and dimensions.
Bitcoin Weekly K-line chart: (Momentum Quantification Model + Sentiment Quantification Model)
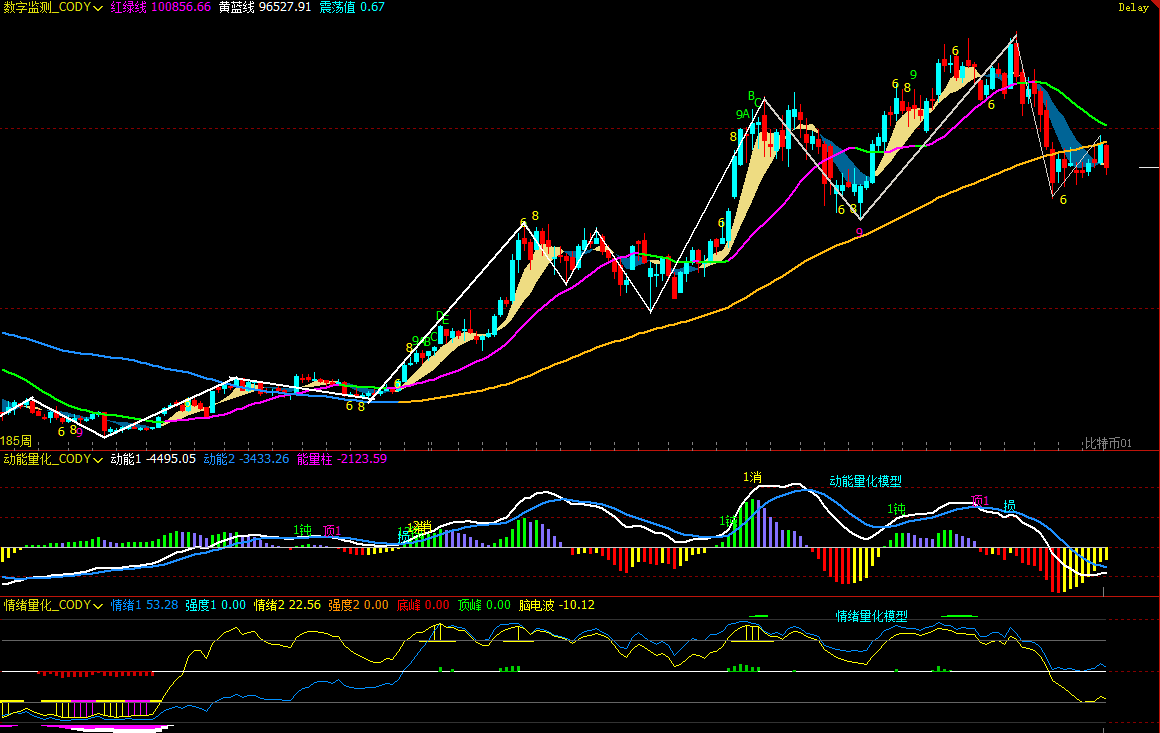
Figure 2
1. As shown in (Figure 2), analysis from the weekly chart:
• Momentum Quantification Model: Technical indicators show that last week, selling momentum was released to some extent, with the two momentum lines showing signs of divergence. The negative energy bars did not change significantly; monitor the bears' subsequent performance.
The Momentum Quantification Model indicates: Price Decline Index: High
• Sentiment Quantification Model: Blue sentiment line value 53.28, intensity zero; yellow sentiment line value 22.56, intensity zero; peak value is 0.
The Sentiment Quantification Model indicates: Price Pressure and Support Index: Neutral
• Digital Monitoring Model: The price has been below the bull-bear (yellow-blue line) demarcation line for 10 weeks, and the price has fallen again, moving further away from the demarcation line.
The Digital Monitoring Model indicates: No monitoring (top/bottom) digital signals have appeared; the weekly K-line closed as a large bearish candle, down about 7.55%; the last three weekly K-lines form a "strong top divergence" bearish pattern.
The above data suggests: Bitcoin's weekly trend is bearish, beware of the risk of volatile declines.
Bitcoin Daily K-line chart: (Momentum Quantification Model + Sentiment Quantification Model)
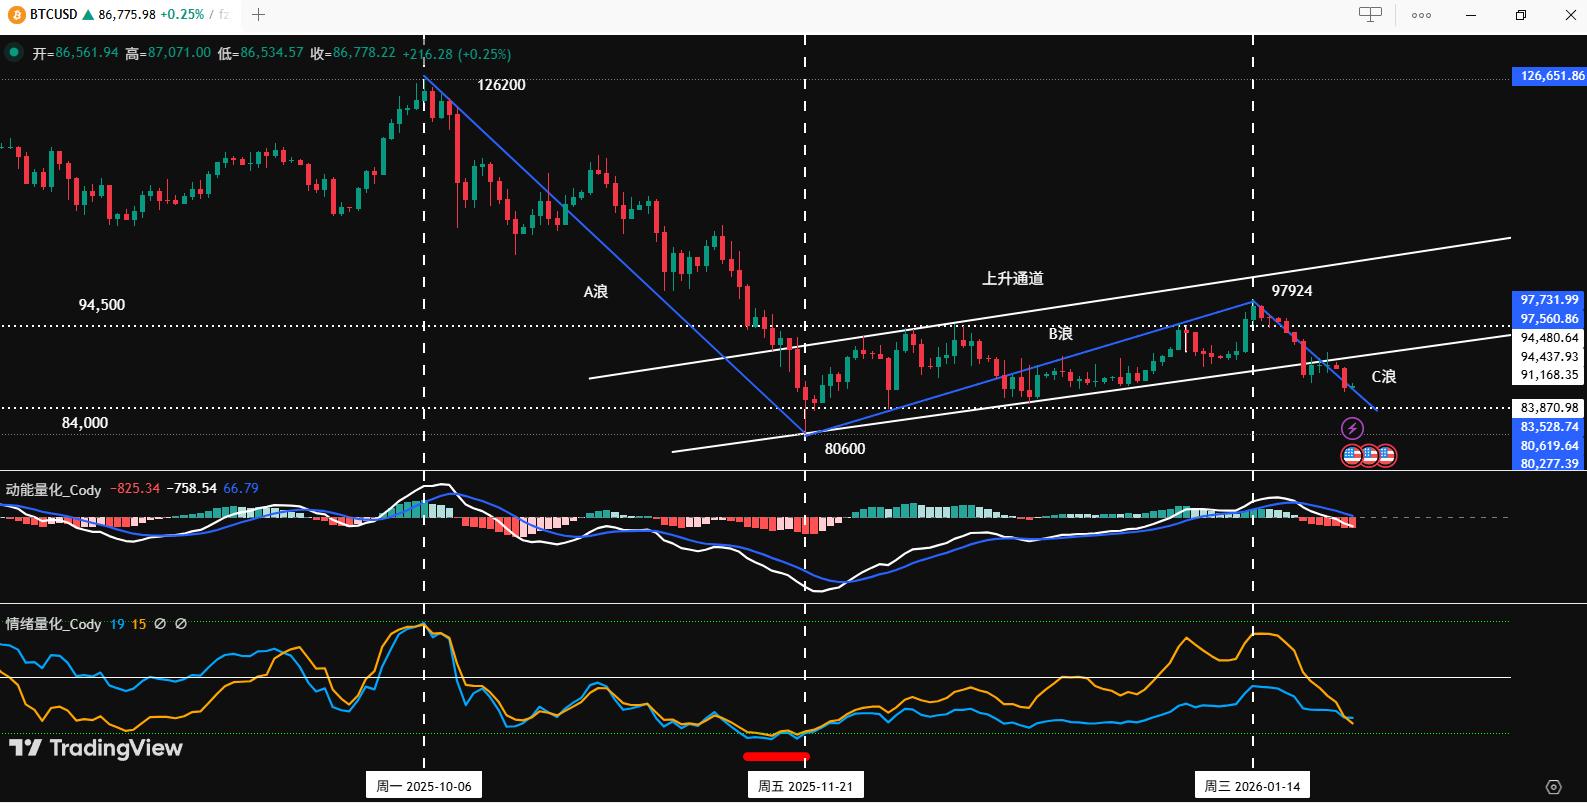
Figure 3
2. As shown in (Figure 3), analysis from the daily chart:
• Momentum Quantification Model: Last week overall presented a "decline-consolidation-decline" pattern. After Sunday's close, Momentum Line 1 has already crossed below the zero axis, and Line 2 is about to cross below; negative energy bars are gradually expanding.
The Momentum Quantification Model indicates: Daily selling momentum is being released; monitor the fate of the zero axis.
• Sentiment Quantification Model: After last Sunday's close, blue sentiment line value 19, intensity zero; yellow sentiment line value 20, intensity zero.
The Sentiment Quantification Model indicates: Pressure and Support Index: Neutral
The above data suggests: A bearish pattern is initially appearing on the daily timeframe, but its validity needs confirmation; monitor the battle between bulls and bears over the zero axis.
4. This Week's Market Forecast: (01.26~02.01)
1. This Week's Core View: Monitor the effective confirmation after a break below the ascending channel's lower boundary.
• If the price effectively breaks below the lower boundary, the price will likely accelerate its correction, with the initial target near the lower edge of the original consolidation box at $84,000.
• If the price effectively holds above it, consolidation within the ascending channel will continue, but upside potential is limited.
2. Core Resistance Levels:
• First Resistance Zone: $88,500–$91,200 area (previous consolidation pivot)
• Second Resistance Zone: $94,500–$95,000 area (previous consolidation pivot)
• Important Resistance Zone: Near the 21-week moving average
3. Core Support Levels:
• First Support Level: $86,000–$86,500 area (previous high-volume transaction zone)
• Second Support Level: Near $84,000 (previous box lower edge)
• Important Support Level: Near $80,000–$80,600 (vicinity of last November's low)
5. This Week's Operational Strategy (Excluding Sudden News Impact): (01.26~02.01)
1. Medium-term Strategy: If the price effectively breaks below the ascending channel's lower boundary, consider establishing a 60% short position opportunistically.
2. Short-term Strategy: Utilize 30% of capital, set stop-loss points, and look for "spread" trading opportunities based on support and resistance levels. (Using the 30-minute chart as the operational timeframe).
3. In operations, focus on the fate of the ascending channel's lower boundary. To dynamically respond to market evolution and combine real-time model signals, we have formulated two short-term operational plans, A/B:
• Plan A: If the price breaks below the ascending channel's lower boundary:
• Entry: Upon effective break and combined with model top signals, a 30% short position can be established.
• Risk Control: Initial stop-loss for the short position set around 1.5% above the entry price (i.e., 1.015 * entry price).
• Exit: When approaching important support levels and combined with model signals, gradually close the position to take profits.
• Plan B: If the price re-establishes itself above the ascending channel's lower boundary: (Short on resistance)
• Entry: When encountering resistance upon reaching important resistance levels or the channel's upper boundary, combined with model top signals, a 30% short position can be established.
• Risk Control: Initial stop-loss for the short position set around 1.5% above the entry price (i.e., 1.015 * entry price).
• Exit: When falling to the channel's lower boundary or support levels, and combined with model signals, gradually close the position to take profits.
6. Special Notes:
1. Upon Entry: Immediately set the initial stop-loss level.
2. When Profit Reaches 1%: Move the stop-loss to the entry price (breakeven point) to ensure capital safety.
3. When Profit Reaches 2%: Move the stop-loss to the 1% profit level.
4. Continuous Tracking: Thereafter, for every additional 1% profit, move the stop-loss up by 1% accordingly, dynamically protecting and locking in profits.


