
"Cold Bear": Another Perspective Beyond the "Deep Bear Market"
- Core Viewpoint: The BTC market is at a turning point between old and new cycles, with the direction still unclear.
- Key Factors:
- Macro liquidity has shown initial improvement but remains tight.
- On-chain data indicates significant market losses, with selling pressure persisting.
- Long-term holders continue distributing, but the selling pressure is being absorbed without signs of panic.
- Market Impact: The market needs time to clear out losses, making a strong performance unlikely in the short term.
- Timeliness Note: Medium-term impact
The markets, projects, tokens, and other information, views, and judgments mentioned in this report are for reference only and do not constitute any investment advice.
The BTC correction triggered by tight US macro liquidity and cyclical selling has persisted for over two months. As liquidity gradually recovers, US stocks are returning to historical highs. However, BTC, which typically leads liquidity movements, has shown only a slight rebound and continues to fluctuate at post-adjustment lows, still more than 30% below its previous peak.
Although the Fed cut rates again in December, marking a short-term liquidity inflection point, market funds remain tight. Coupled with the 10-year US Treasury real yield remaining at a high level of around 4.12%, long-duration assets are still under significant pressure. This can be attributed as one reason for BTC's weak rebound.
There is also little positive news regarding industrial policy and consensus expansion, with the "Structural Act" still under discussion. Conversely, DAT companies are under pressure, and the highly-watched leading Strategy company raised additional cash reserves for the "winter" through a stock issuance this month. This has also weakened market confidence in a BTC rebound.
On-chain data shows the entire market is at a loss of over 30%, indicating continued significant pressure. Long-term holders are still locking in profits, while short-term holder loss selling is weakening, yet unrealized losses remain high. This suggests the market is still mired in difficulties, requiring more time to clear losses and accumulate bullish momentum before any meaningful performance.
Most indicators from EMC Labs' "BTC Cycle Multi-Factor Analysis Model" show BTC remains in a bear market, with deep-seated issues hard to reverse. Against the backdrop of no further improvement in macro liquidity and ongoing on-chain clearing, it remains unclear whether this decline is a relatively strong "mid-term correction" or a slide into a "deep bear market" following the 4-year halving.
In this monthly report, besides analyzing the latest market developments, we will introduce a new concept, "Cold Bear," attempting to use it to observe the BTC market at the turning point between old and new cycles.
Macro Liquidity: Inflection Point Passed, But Not Yet Abundant Again
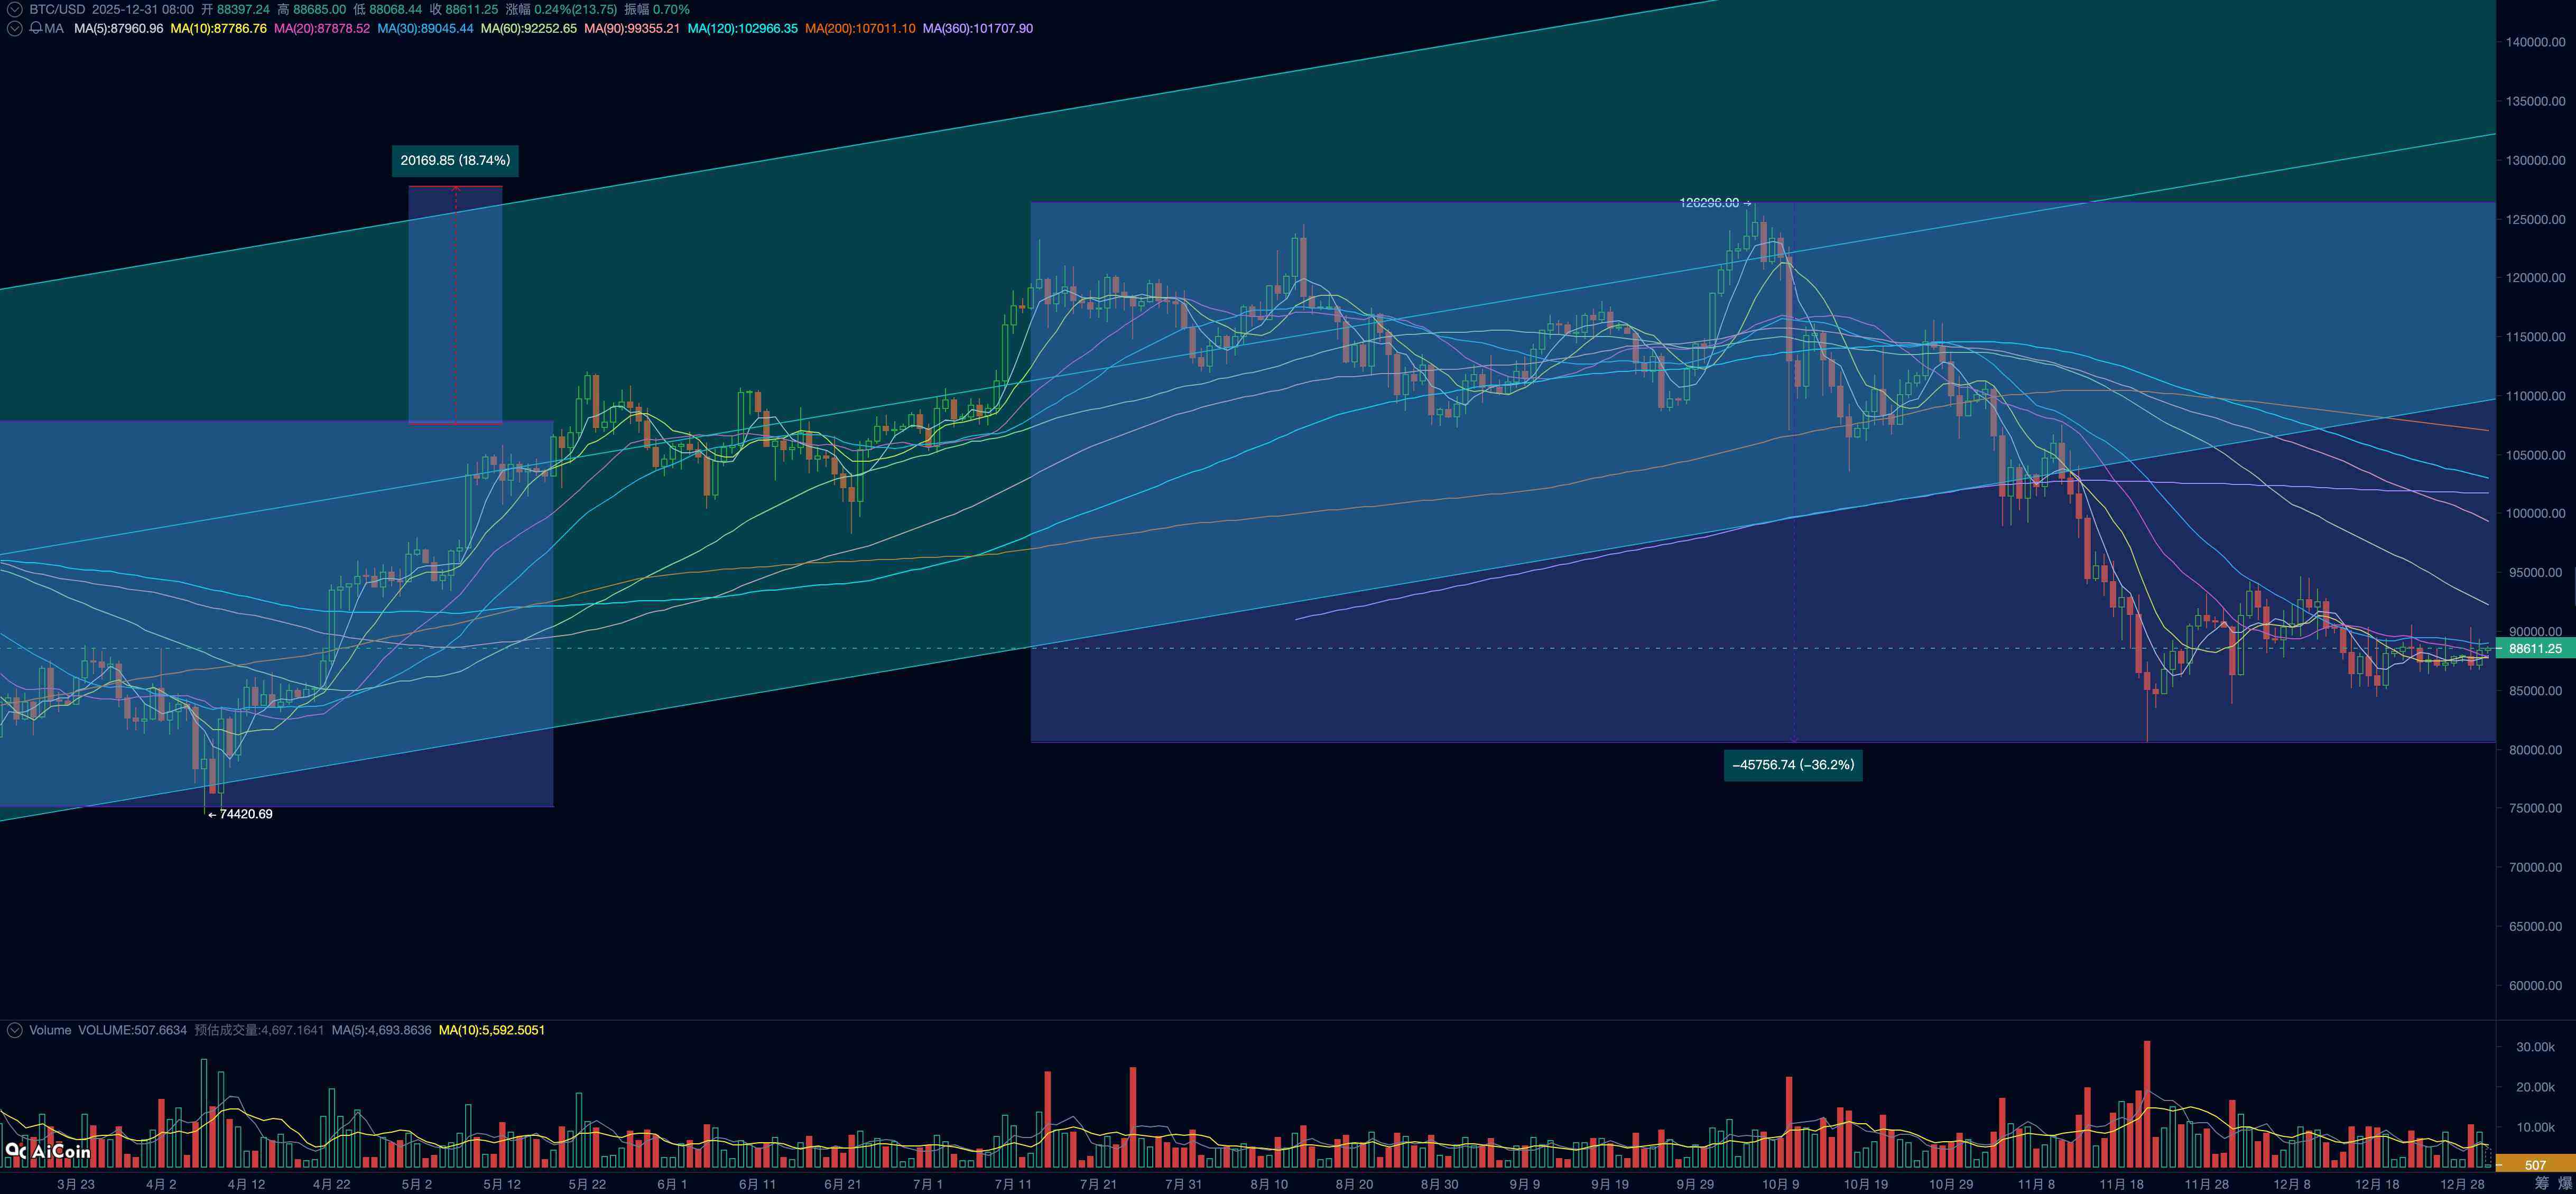
BTC Price Daily Chart
Market expectations for a December rate cut have experienced a rollercoaster ride since November, severely impacting BTC's upward momentum. Ultimately, the FOMC meeting on December 10th cut rates by 25 basis points to 3.50%~3.75% as scheduled. The Fed's statement emphasized: in the "dual mandate risk trade-off," downside risks on the employment side have increased, while inflation "remains slightly elevated"; subsequent decisions on the "extent and timing of further adjustments" will depend on data, outlook, and risk balance. This means the Fed currently leans slightly towards the employment side of its dual mandate. The dot plot indicates one 25-basis-point cut in 2026, but market pricing anticipates two cuts totaling 50 basis points.
On December 16th, the US Labor Department released October and November non-farm payroll data. October NFP fell by 105,000, while November NFP rebounded from the low, increasing by 64,000, but remained weak. The November unemployment rate rose to 4.6%, the highest since 2022. This data supports market expectations for Fed rate cuts in 2026.
Furthermore, on December 18th, the Bureau of Labor Statistics released November CPI data showing a year-on-year increase of 2.7%, significantly below the expected 3.1%. Core CPI grew 2.6% year-on-year, also well below the expected 3.0%. Due to government shutdown and insufficient data collection issues, this data may have statistical distortions, and its repeatability requires verification from subsequent data. Fed "third-in-command" John Williams also emphasized this point in public remarks. This means a January rate cut remains a low-probability event.
The market has largely priced in a pause on rate cuts for January. This makes it difficult to be optimistic about mid-term market liquidity.
Entering December, the Fed stopped "quantitative tightening" (QT), completing a soft landing from "active reduction" to "moderate balance." To address mid-to-late December tax periods and seasonal funding needs, the Fed began purchasing short-term Treasuries through "Reserve Management Purchases (RMP)." This is equivalent to injecting tens of billions of dollars in liquidity into the market. However, the Fed cautiously stated this is merely a technical operation, not a shift in monetary policy.
Synthesizing the above information, we believe the market has preliminarily priced in a post-pandemic US economic "soft landing" or "no landing." Inflation is likely to decline slowly but will struggle to return to the 2% target in the short term. The economic growth spurred by AI investment and adoption has been largely priced in (S&P 500 P/E ratio is at a historical high) and is now being scrutinized for profit returns. Unemployment may remain elevated due to changes in the labor market.
Further observation shows that with bond purchases and the decline in the Treasury's TGA account, the Fed's short-term net liquidity injection has passed its inflection point, which is the fundamental reason US stock indices can return to historical highs.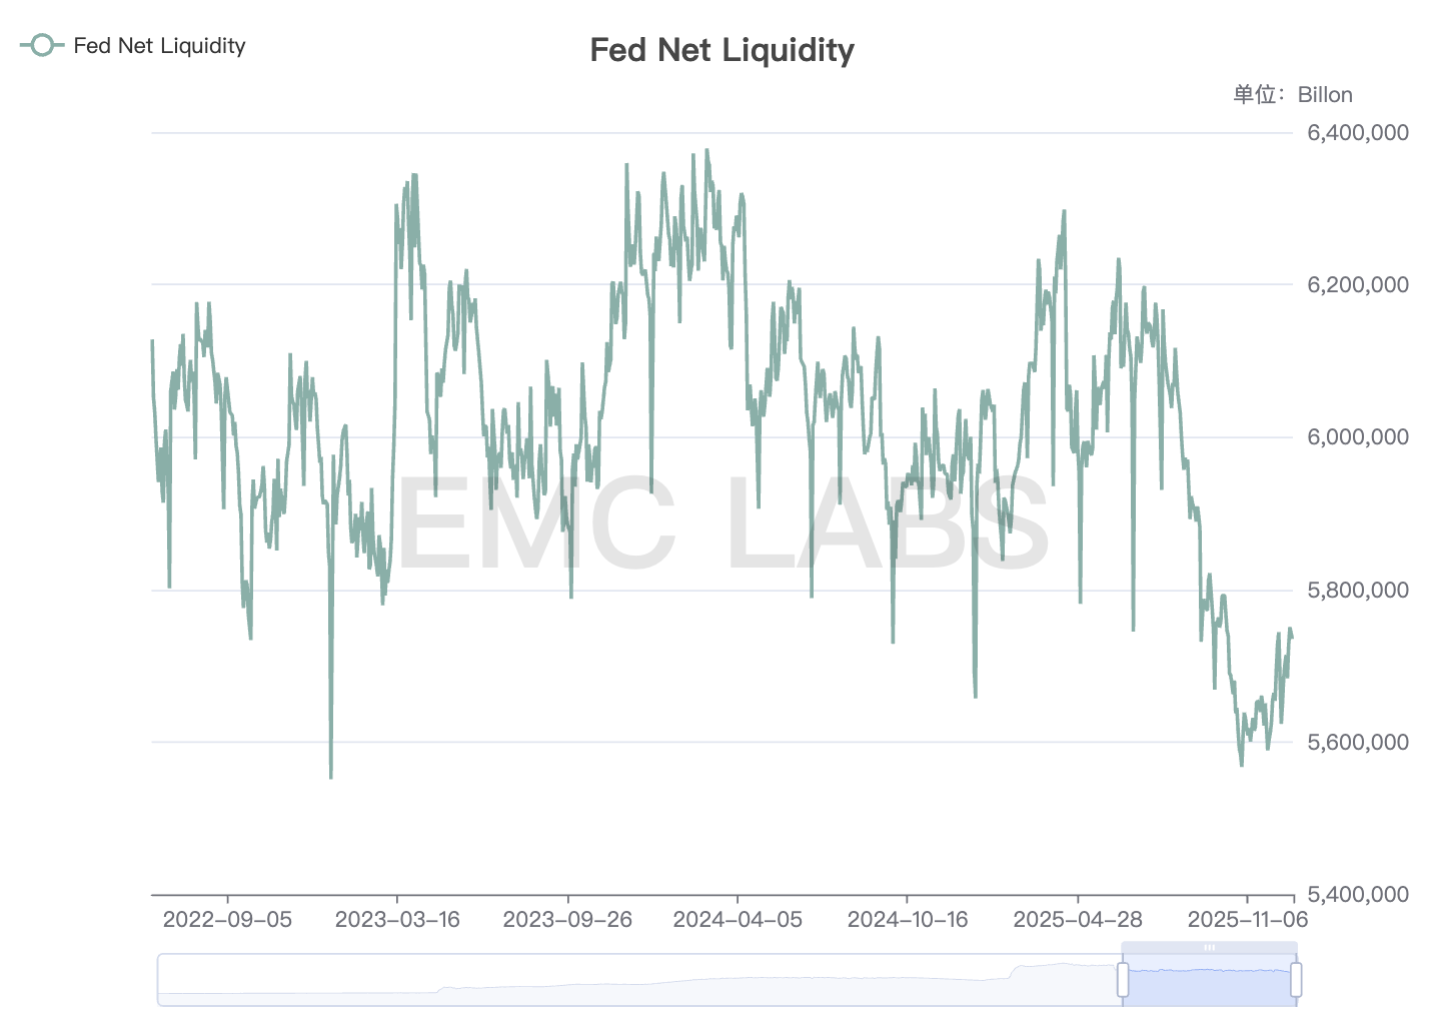
Fed Net Liquidity Supply
However, overall liquidity remains at lows seen since 2022, not yet truly returning to a relatively abundant stage. Additionally, the Fed's stance suggests its dual mandate of controlling inflation and maintaining employment makes it difficult to return to a state of liquidity abundance.
As of month-end, the anchor for global assets, the 10-year US Treasury yield, remains high at 4.12%, with real interest rates also elevated. This continues to pressure the valuation of high-duration and high-beta assets, including BTC, making mid-term optimism difficult.
Crypto Market Liquidity: A Transient and Fragile Balance
Looking further into crypto market liquidity, fund flows showed an inflow pattern in the first half of the month and outflow in the second half. The main decisive factors were the Fed rate cut in the first half and the Bank of Japan rate hike in the second half. Stablecoin and BTC ETF channel funds largely moved in sync.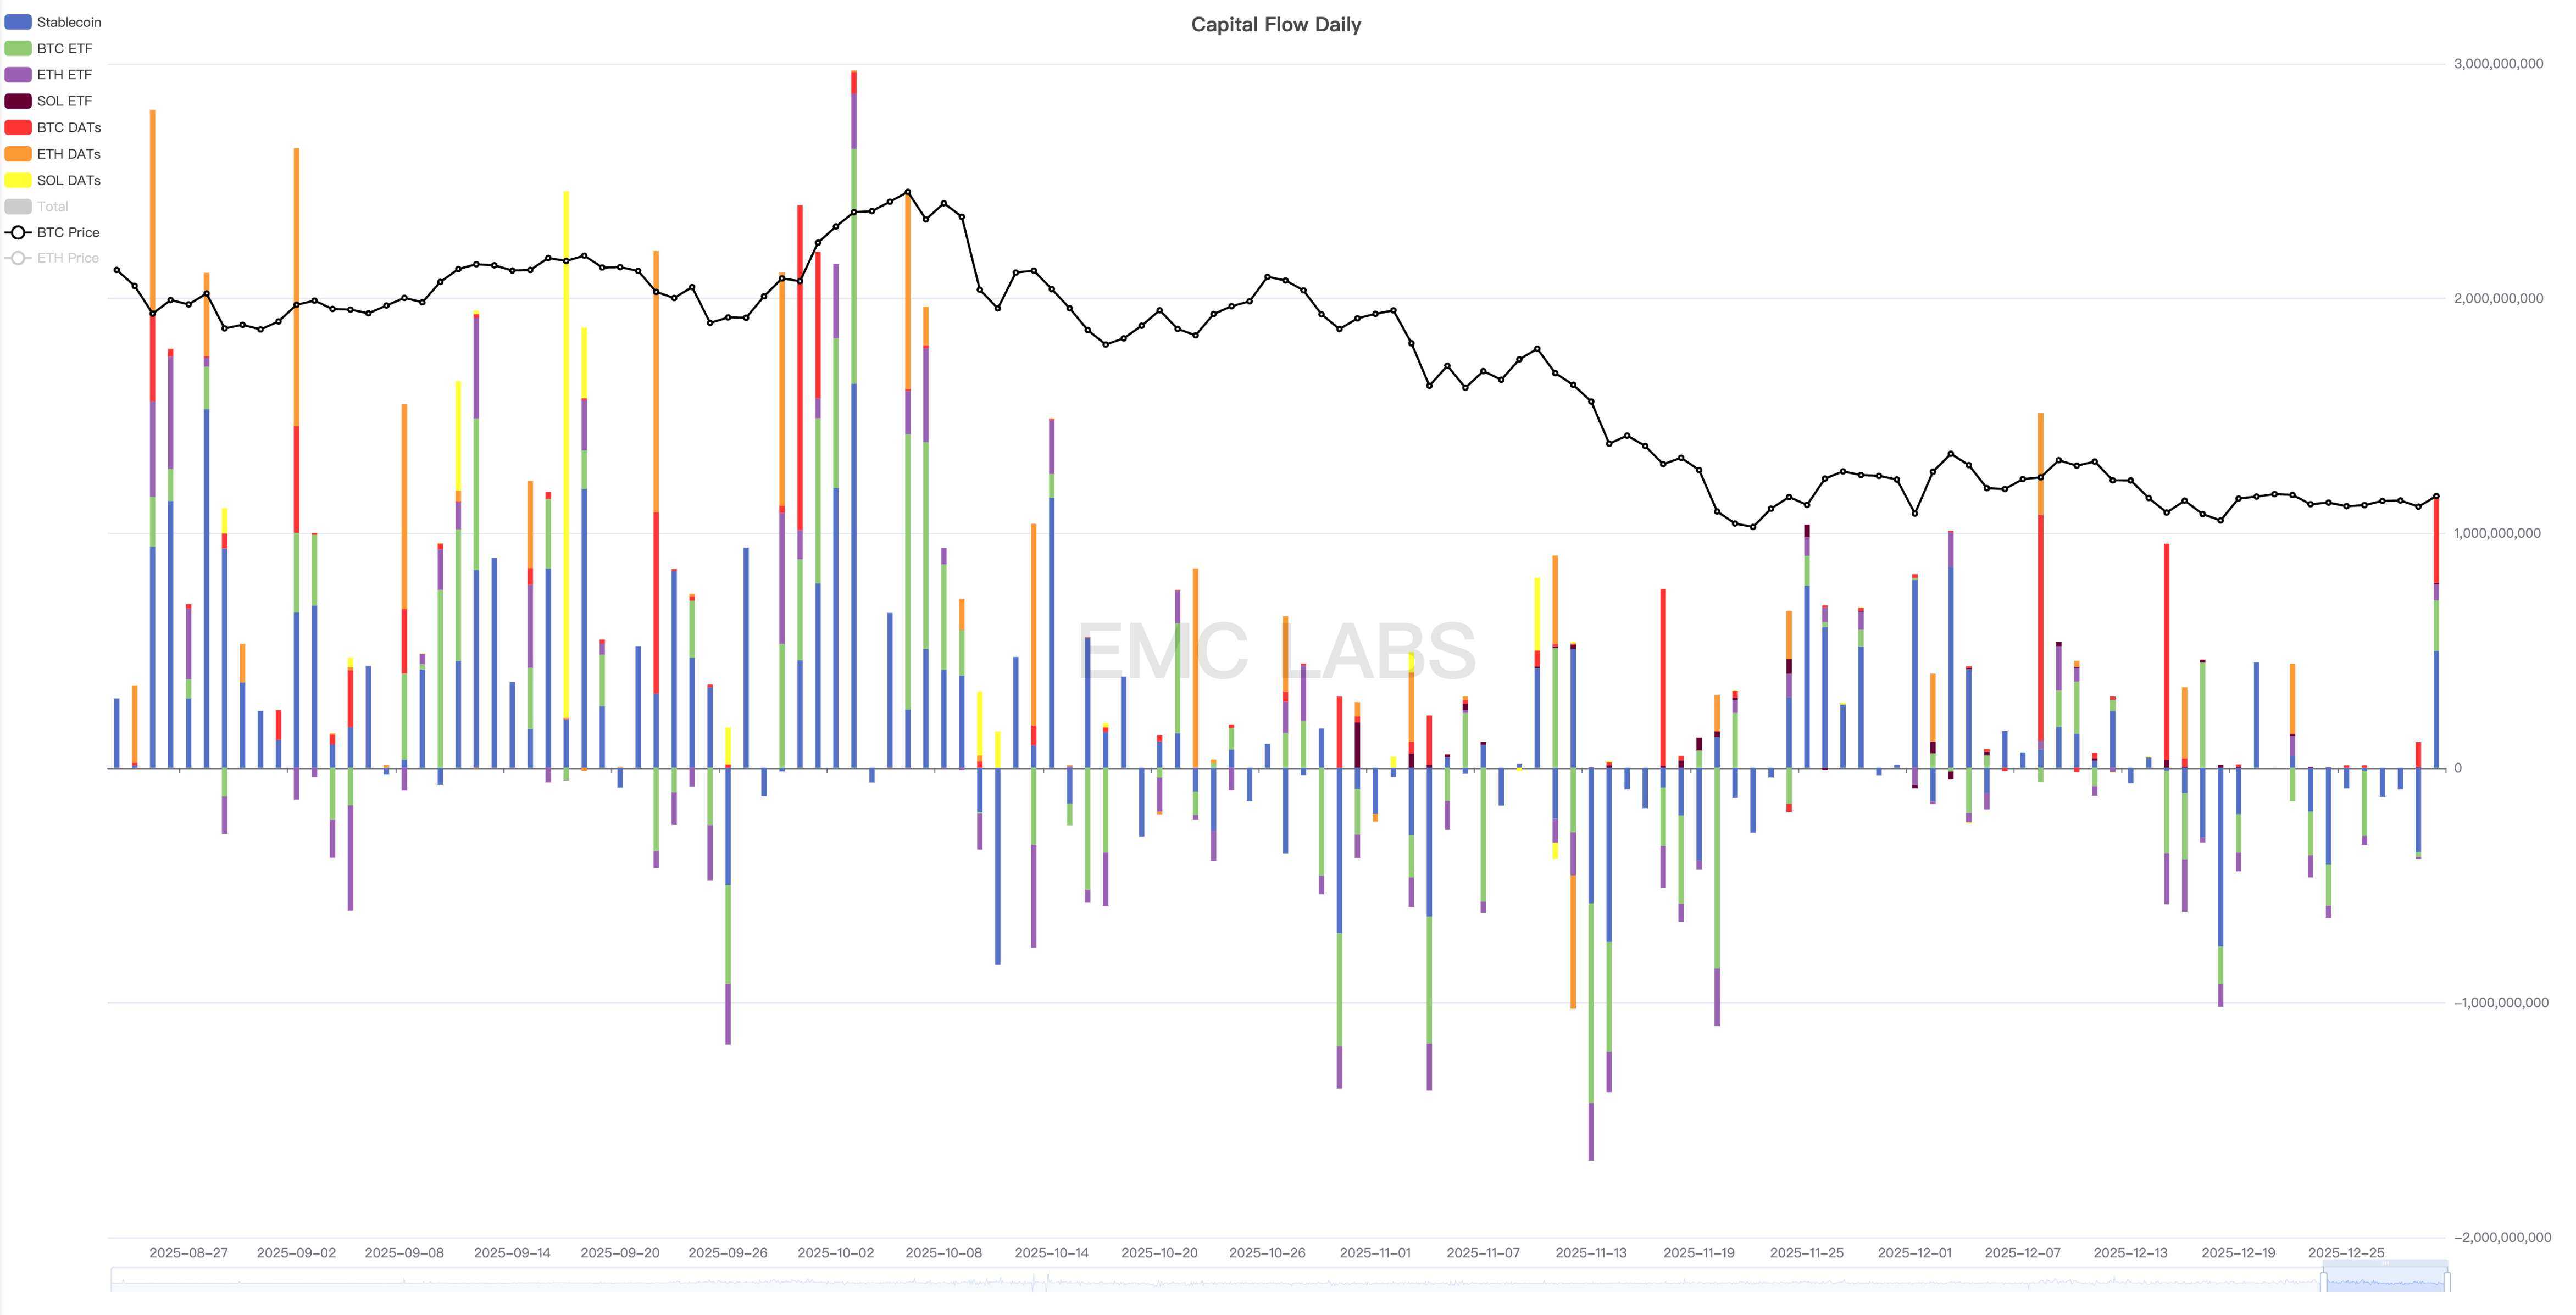
Crypto Market Fund Inflow/Outflow Statistics (Daily)
Based on our tracked 7-day selling average, the selling peak this month occurred on December 15th, between the Fed rate cut (December 10th) and the Bank of Japan rate cut (December 19th). The month's highest price of $94,640 appeared on December 9th, the eve of the Fed rate cut.
The November market crash began due to liquidity tightness but was amplified by historical cyclical selling. Currently, BTC price has broken below technical support, leading to strong selling pressure on any rebound. This indicates the market is still in a clearing process.
Total selling volume this month reached 718,000 coins, lower than the previous two months but still at a relatively high level. The optimistic side is that the selling pressure has been largely absorbed by the market. Exchanges saw a net outflow of approximately 30,000 coins this month, maintaining a continuous outflow trend for four consecutive months.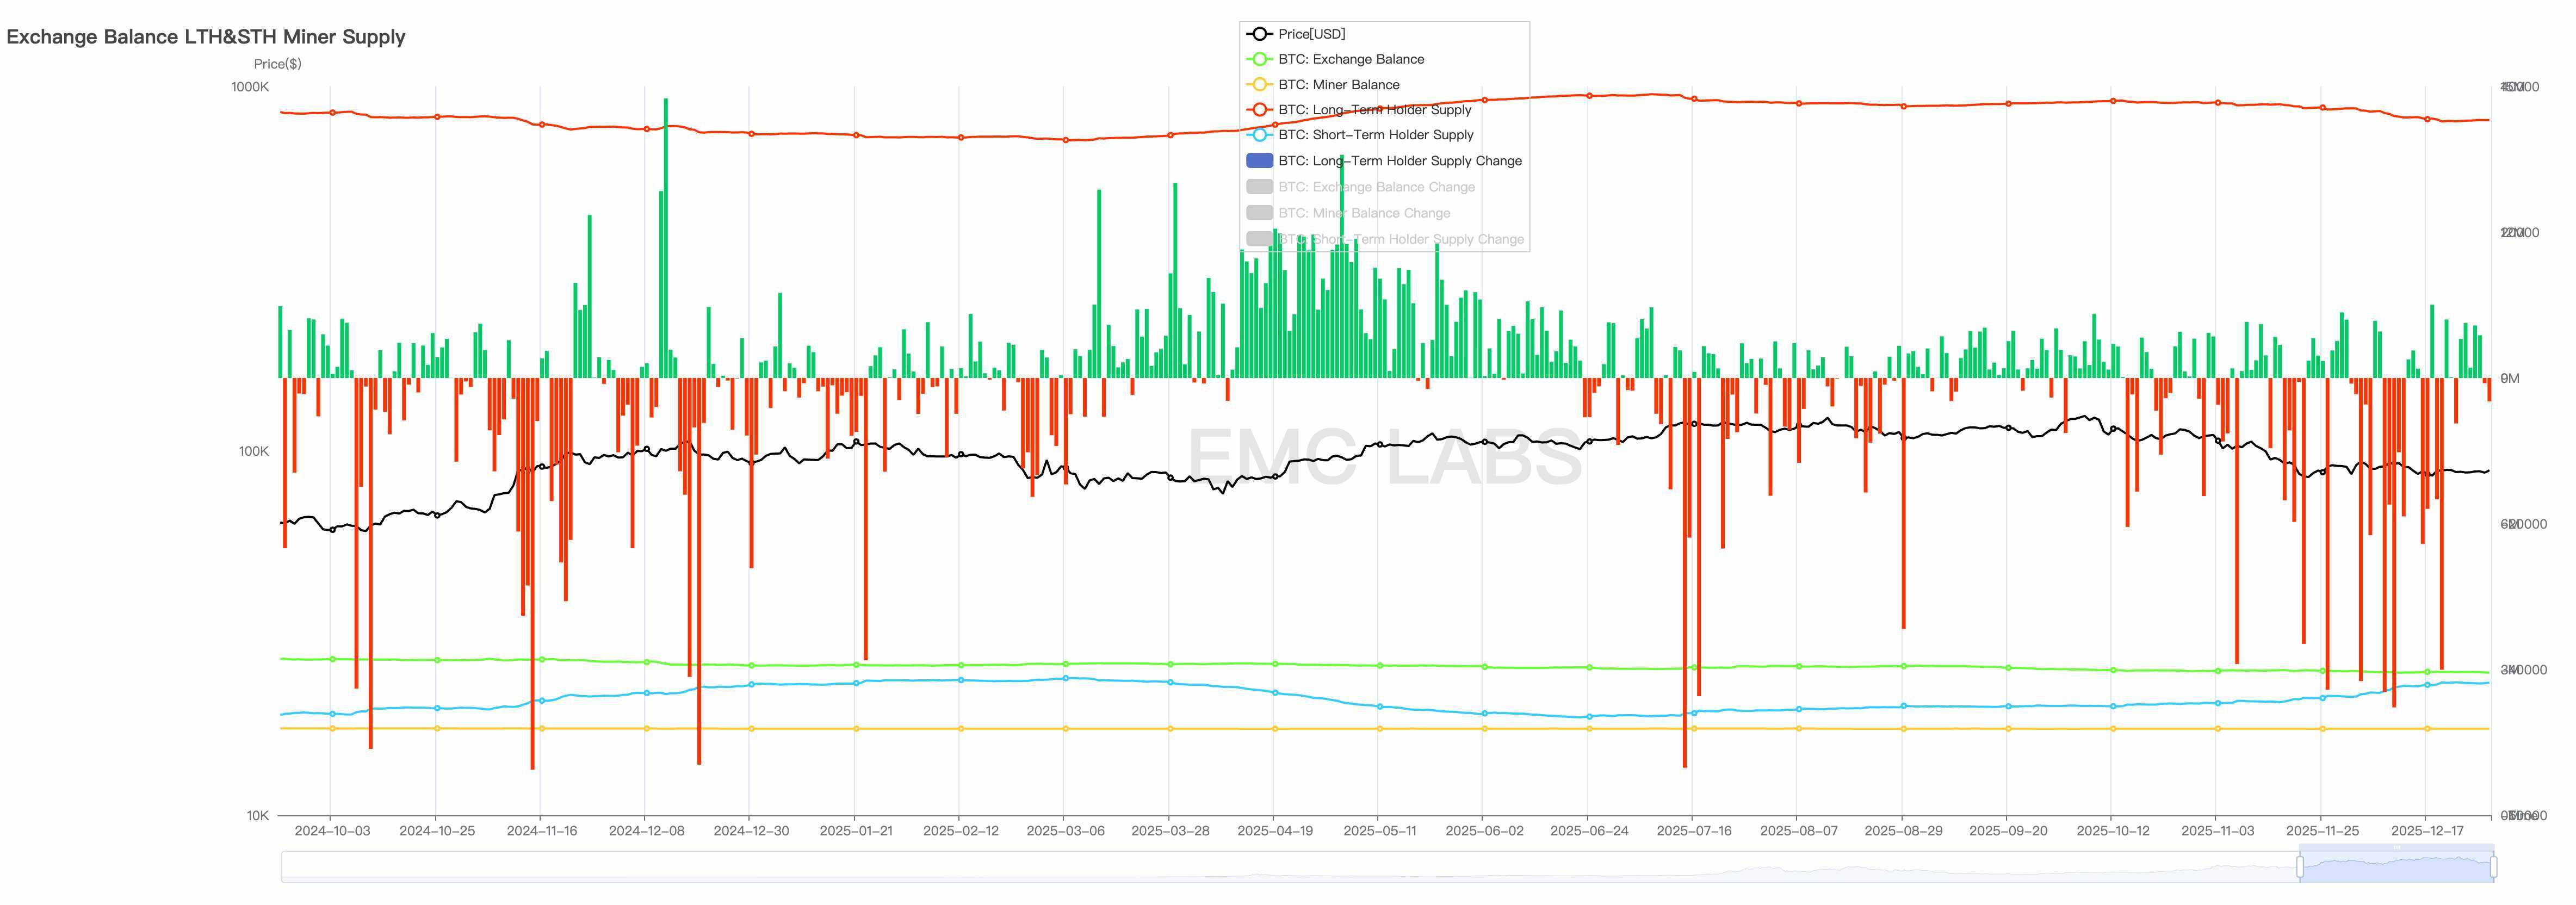
BTC Long-Term Holder Holdings and Change Statistics (Daily)
Long-term holders, BTC ETF investors, and US retail market users remain the primary selling groups. Coinbase quotes continue to be lower than Binance.
Specifically regarding the composition of selling, the sharp decline over the past two months caused a reversal between profit-taking and loss-selling. On October 10th, the profit-to-loss selling ratio was 21.82. By the 29th, this figure had dropped to 0.81, meaning overall selling has shifted from profit-taking to loss-taking.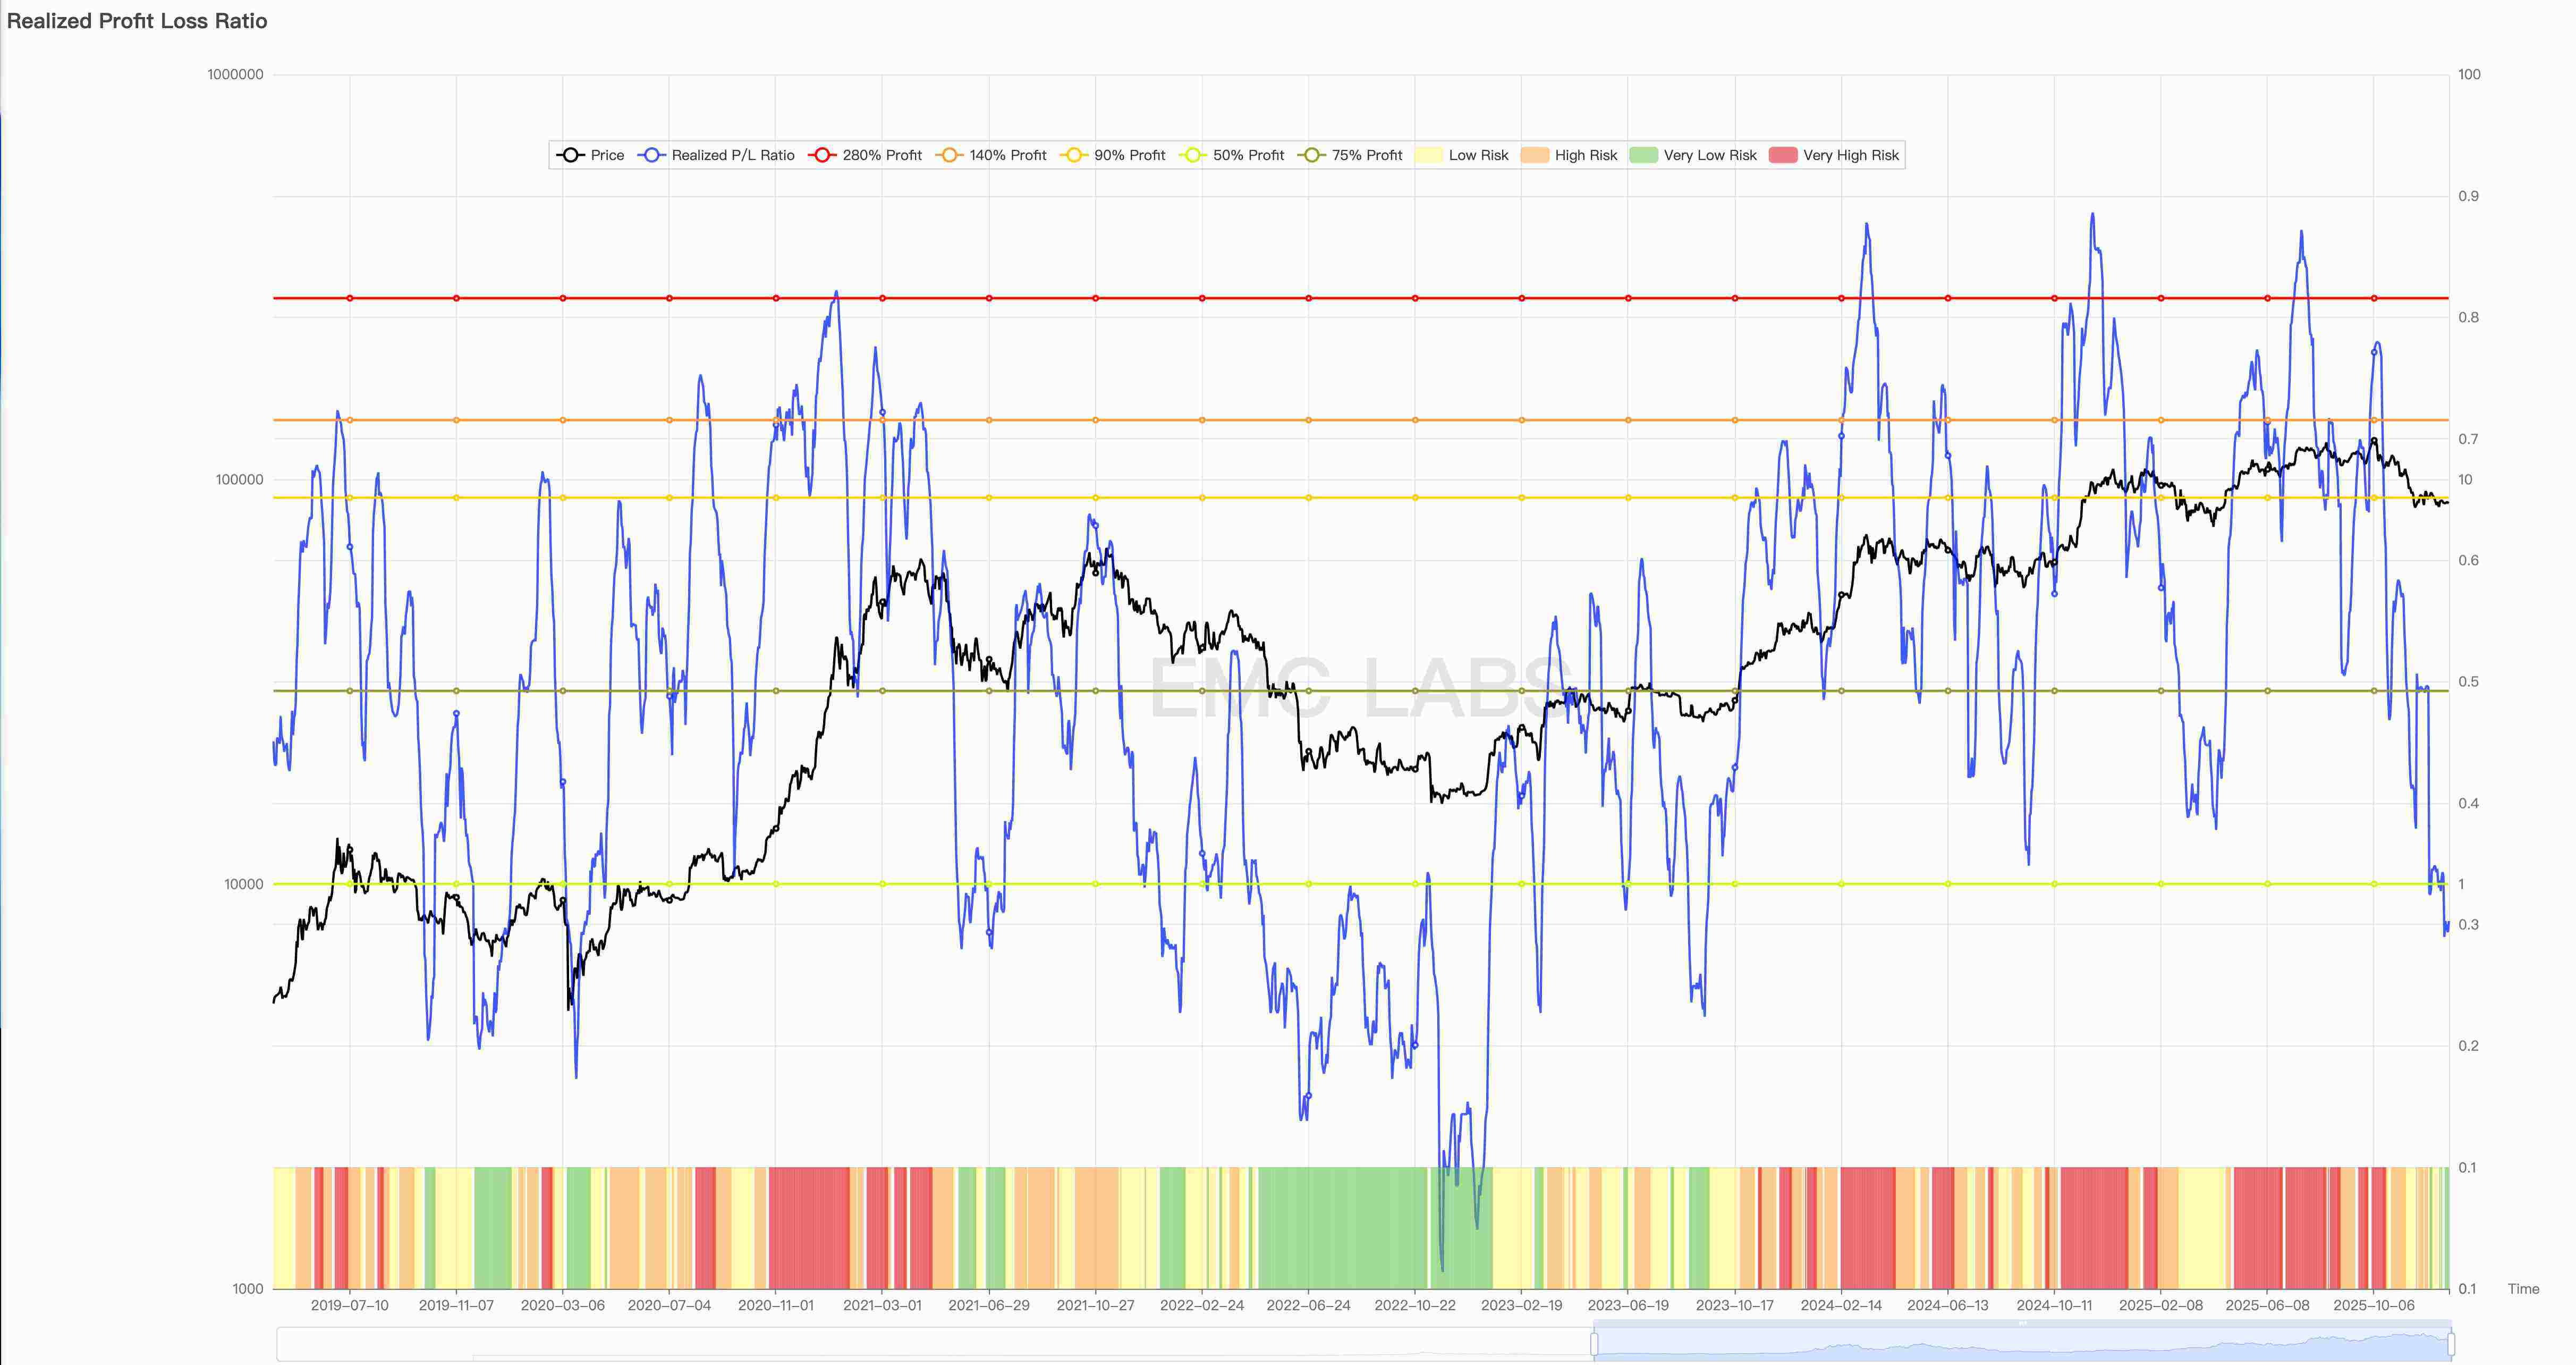
Realized Profit/Loss Ratio
By month-end, long-term holder selling began to decrease or even turned into accumulation. More selling triggered by fluctuations in US stocks was primarily contributed by short-term holders, corresponding to larger loss values.
The full-chain loss situation also breached thresholds, with on-chain market cap experiencing its first outflow since 2023. The 30-day change in realized market cap has turned negative, and the cumulative realized market cap shows signs of peaking. This means net losses have accumulated on-chain since December, corresponding to stop-loss selling on exchanges. Notably, this is the first time the on-chain realized market cap has declined since the start of this bull cycle.
Net Change in Realized Market Cap (30-day)
In past cycles, sustained declines in on-chain realized market cap often signaled a cyclical "deep bear market" with continuous price drops. Such declines not only further damage investor confidence but, if they trigger a collapse of internal market fragility leading to a chain-reaction stampede, can cause a deep bear market, as seen in the previous two cyclical deep bear markets.
"Cold Bear": Could It Become the New Form of the "New Cycle"?
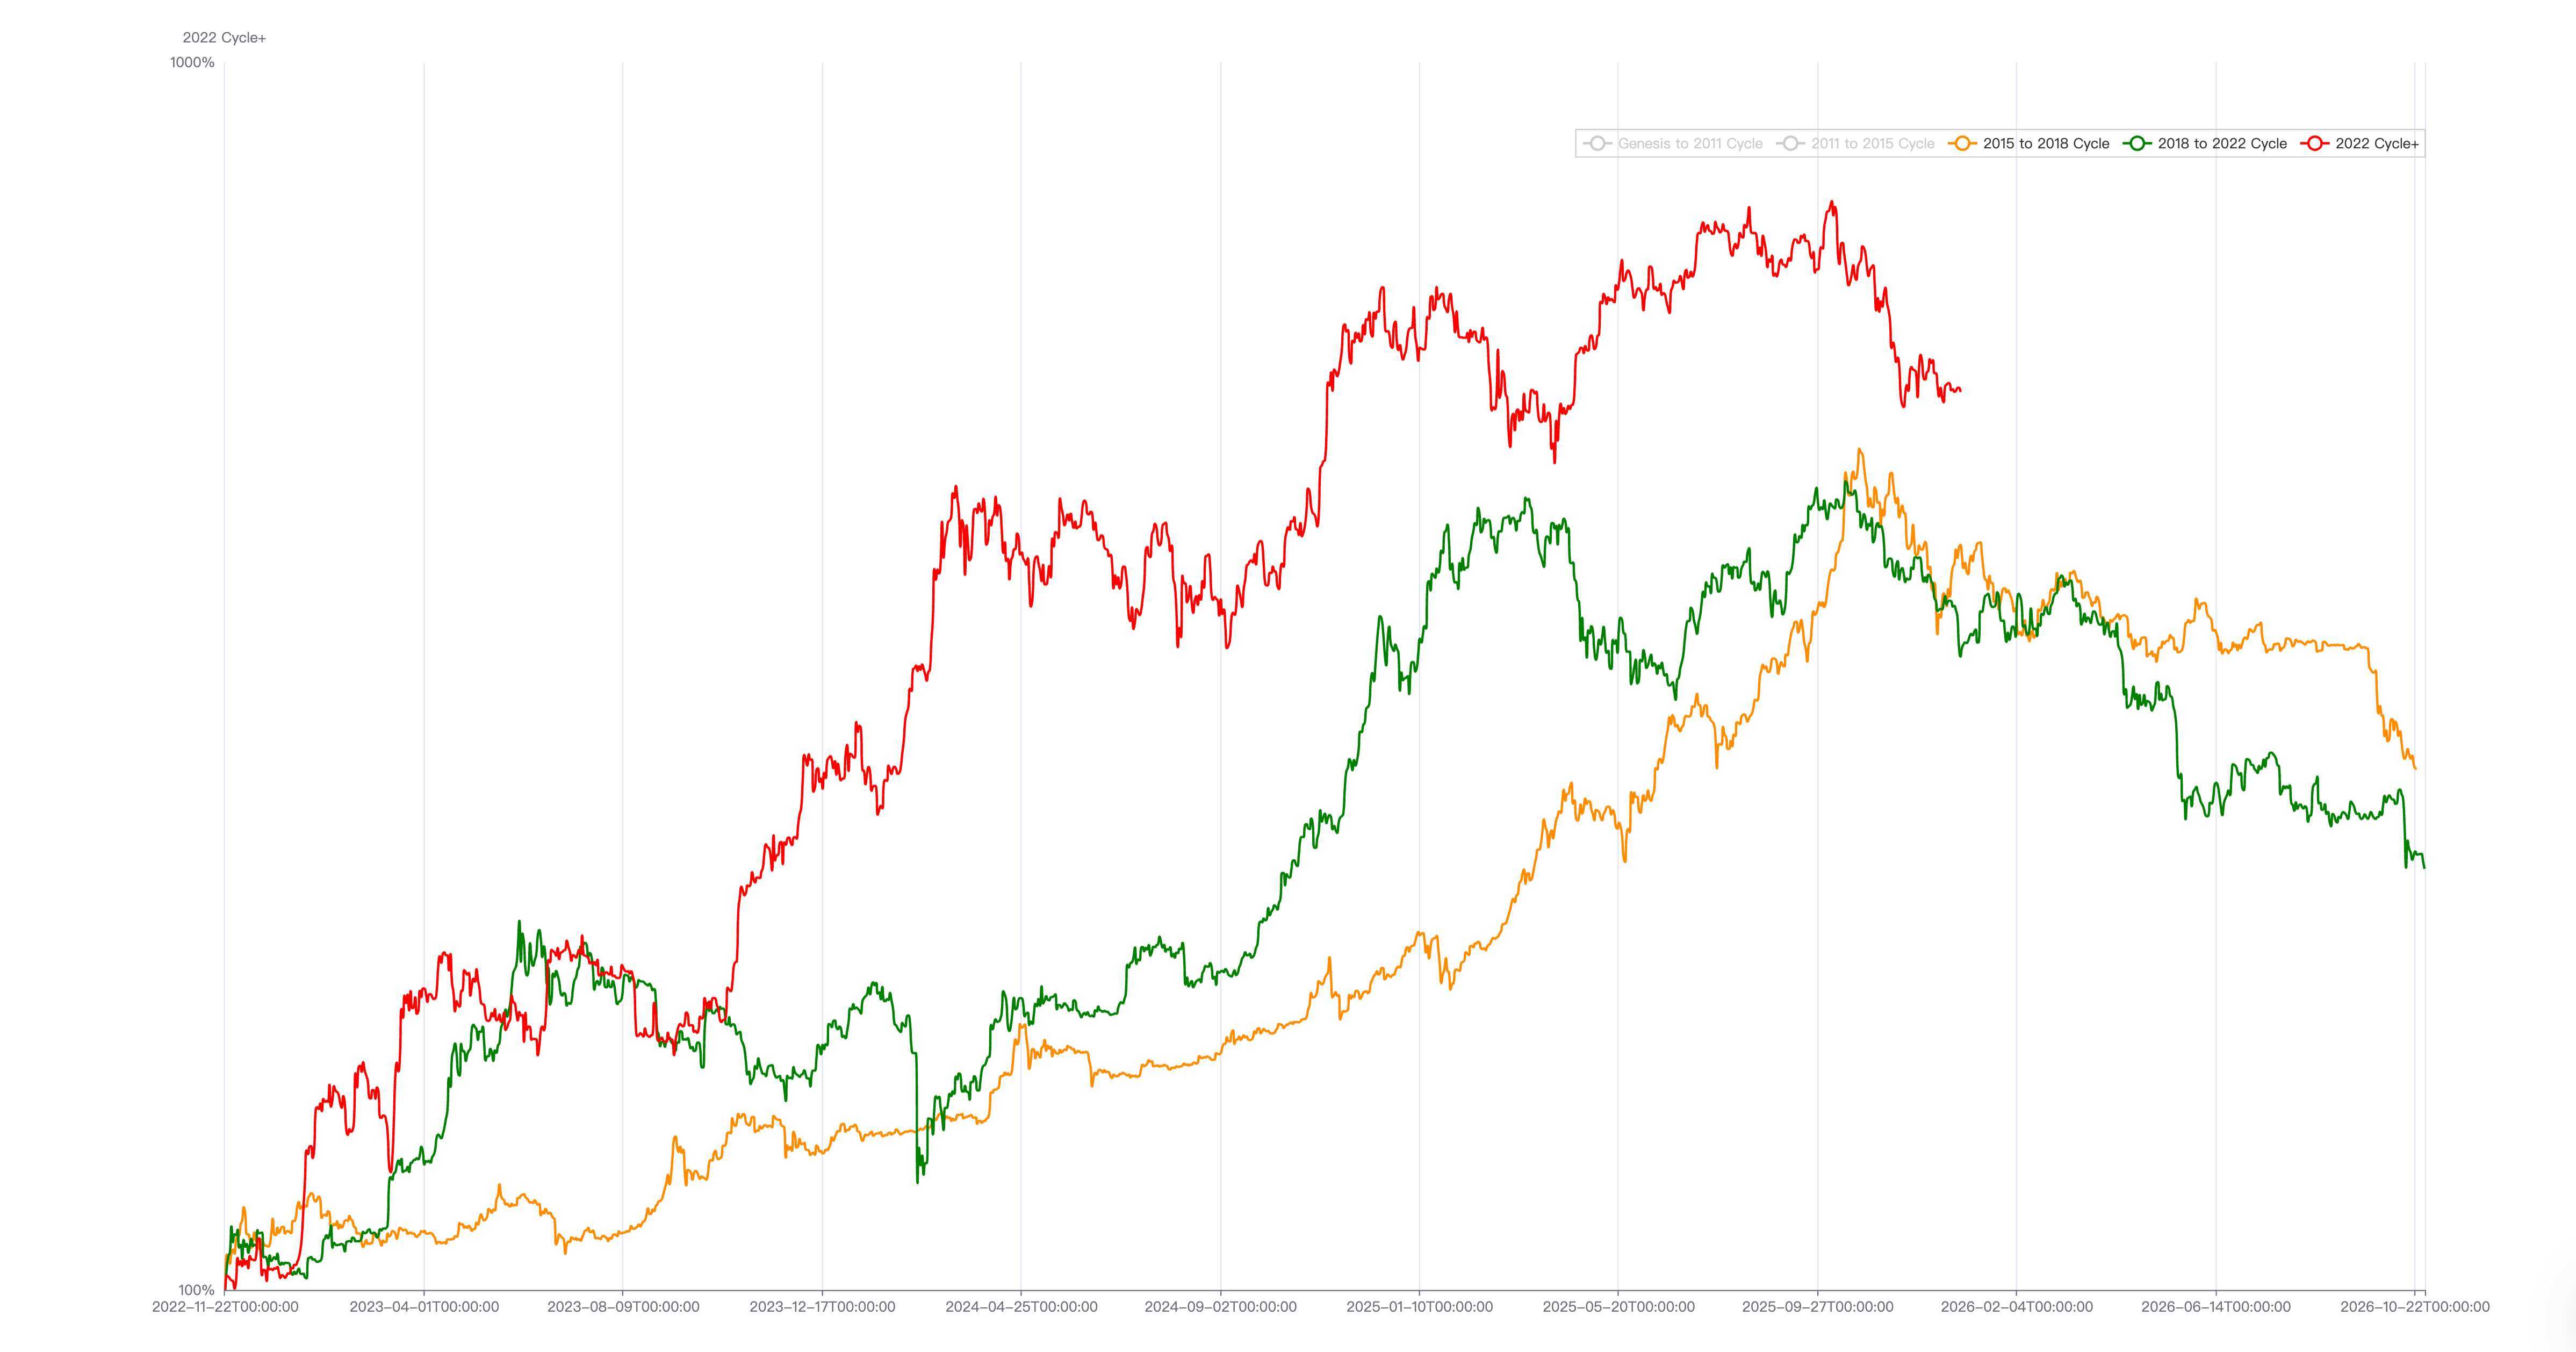
2015~2018 Cycle vs 2018~2022 Cycle vs 2022~ Cycle
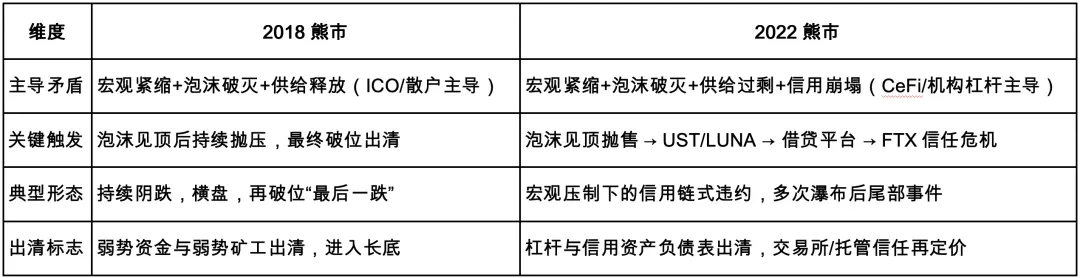
The deep bear markets following the 2018 and 2022 "halving bull markets" (lasting up to 12 months with declines exceeding 70%) were essentially driven by a dual force of "macro financial tightening" and "industry bubble clearing."
During the 2018 bear market, macro financial tightening included the Fed's QT totaling $700.48 billion starting October 2017, and 5 rate hikes totaling 100 basis points in 2018. The 2022 macro financial tightening included Fed QT totaling $363.9 billion (ending by late 2025, total $2.2 trillion), and 7 rate hikes totaling 425 basis points.
In the "EMC Labs BTC Cycle Multi-Factor Analysis Model," macro finance and internal market dynamics form the foundational logic. From the perspective of new asset formation and diffusion, BTC is currently in a historical large-scale transfer process driven by consensus diffusion (from early holders to mature holders). Upon completion, BTC will become a mainstream asset, with pricing power taken over by Wall Street capital.
Based on this definition and framework, we assess the current market situation—
Macro Liquidity. BTC is first and foremost a leading indicator of global macro liquidity. The essence of the past two cyclical deep bear markets was the price rebalancing of high-beta assets through transfers caused by Fed QT and rate hikes. Currently, the Fed only stopped QT in December 2025 and is still in a rate-cutting cycle, not yet constituting conditions for prolonged macro financial tightening pressure.
Internal Market Dynamics, including long/short-term holder transfers, excessive token supply, consensus crises (e.g., BCH hard fork), leverage, and fragility clearing. Among these, the most important aspect is the long/short-term holder token exchange, essentially long-term holders distributing tokens taking advantage of consensus diffusion, ETF, and DAT fund inflows for allocation. Since 2023, three waves have occurred, corresponding to periods around BTC ETF approval, the "crypto-friendly" speculative frenzy driven by Trump's campaign, and the cyclical top-selling driven by historical patterns.
BTC Long-Term Holder Token Accumulation and Distribution Statistics
Each wave of long-term holder distribution, due to its massive scale (hundreds of thousands of coins), drains newly incoming liquidity in a short time, causing阶段性疲软 in BTC price. The first two distributions in this cycle caused 33% and 30% declines, with consolidation periods of 6~10 months. The third wave, currently ongoing,除了长手周期逃顶外,还叠加了美联储缩表末期和政府停摆造成的短期流动性紧张,导致最大跌幅达到 36%,大于此前两次。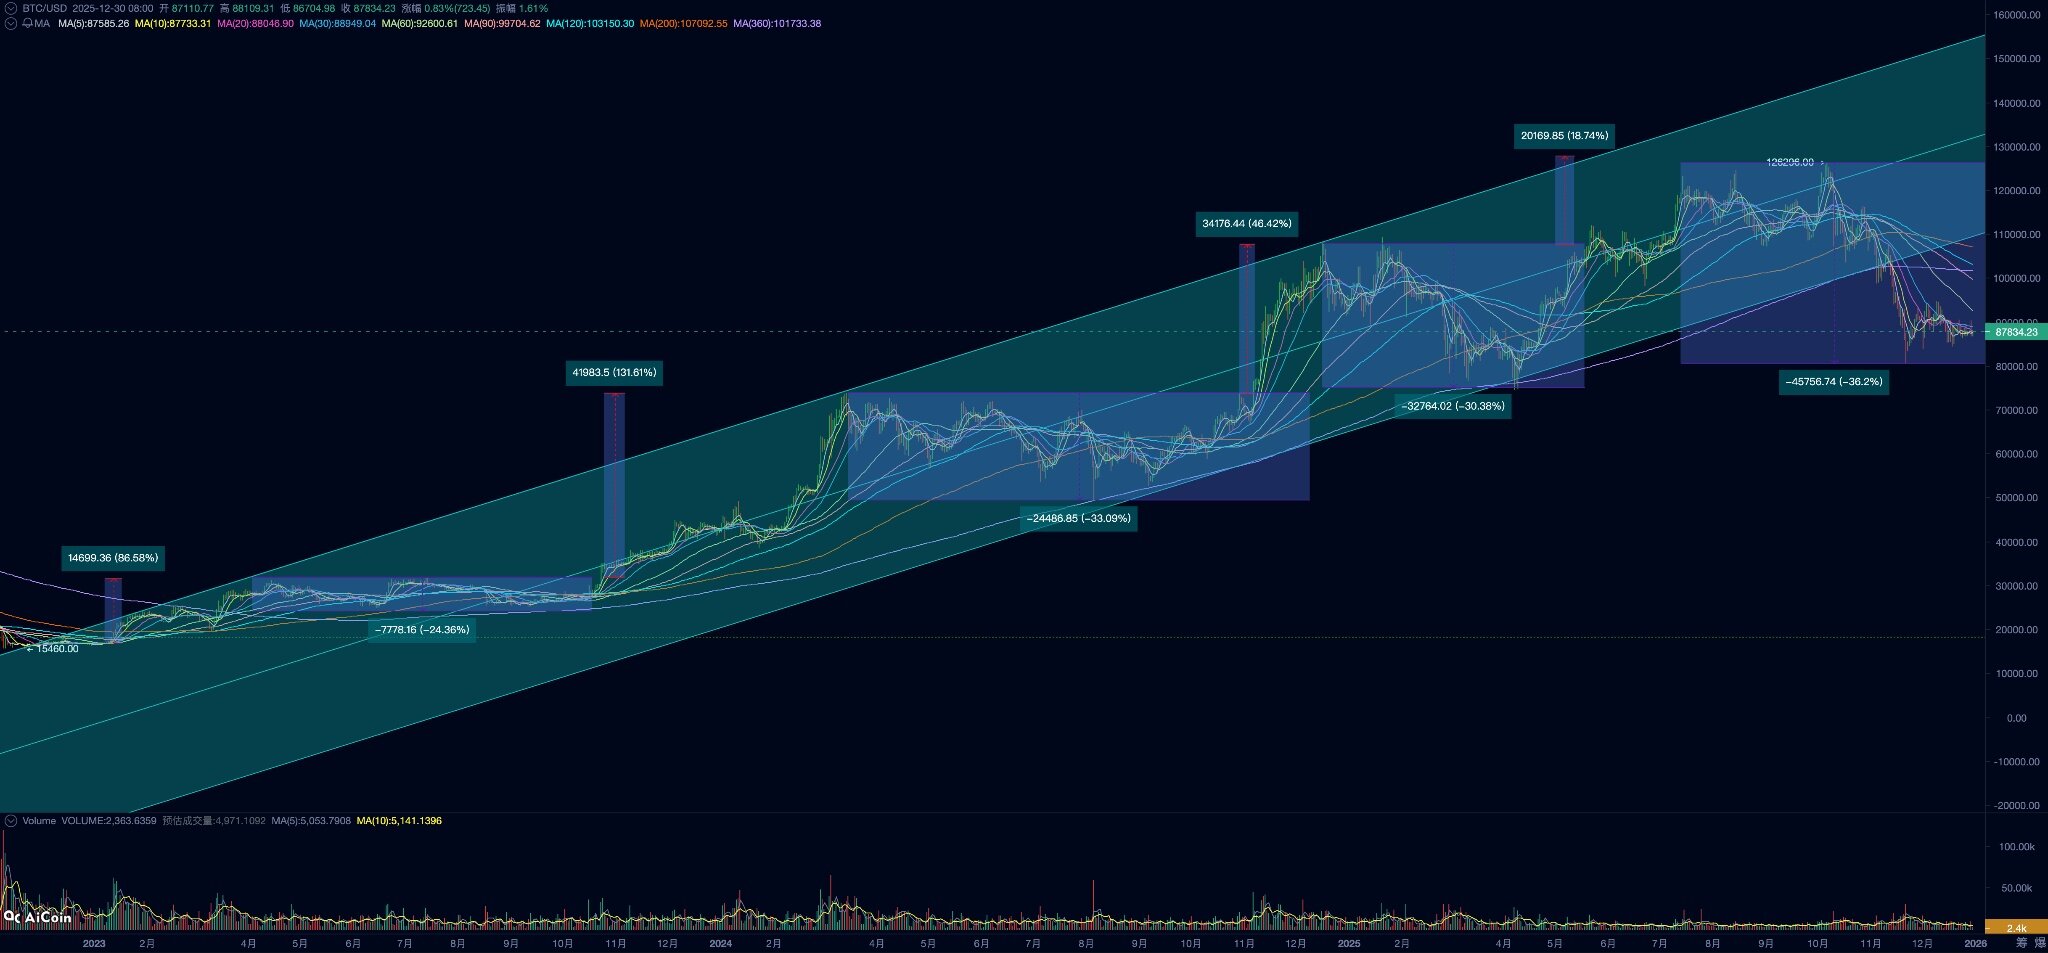
Long-Term Holder Selling and Corresponding Three Declines in This BTC Bull Cycle
How should we view this decline lasting over 6 months with an amplitude exceeding 30%?
Within the framework of the 4-year halving bull cycle, during the upward phase, we view it as a "mid-term adjustment" within the bull market process. The phase lasting 12 months with a decline exceeding 70% after the halving bull market is termed a "deep bear market" by the market.
This was the previous definition and the connotation of the cyclical "ideological imprint."
If we view BTC's mainstream adoption, the large-scale token transfer, and Wall Street gradually gaining pricing power as a historical process constituting a "new cycle," beyond the "deep bear market" perspective, we can use a new concept, "Cold Bear" (a bear market triggered by阶段性情绪冷却), to analyze the market.
During the process of mainstream asset allocation, BTC will gradually follow US stocks into a long-term bull market. Consensus diffusion-driven配置 by traditional funds (DATs, ETFs, family offices OTC, etc.) will trigger脉冲式上涨, while持续抛售 by traditional long-term holders forming 6~10 month declines can be seen as the "new cycle"形态 during the historical large-scale transfer stage driven by consensus diffusion. The "new cycle" includes "rising phases" where consensus diffusion-driven配置 fund inflows create buying power greater than long-term holder selling pressure, and "declining phases" where阶段性资金冷却 leads to selling pressure exceeding buying power, forcing price corrections.
Using this new hypothetical framework, since the BTC ETF行情 in the second half of 2023, BTC has already experienced 3 "new cycles," comprising three complete sets of rises and declines.
To judge whether the market is in a "new cycle" or an "old cycle," we use long-term holder behavior as a leading indicator.
If it's an "old cycle," long-term holders will持续派发筹码 over monthly periods,交易所筹码堆积推动价格持续下行, triggering internal market fragility崩溃,进而不断压塌筑底平台, with multiple large declines completing the large-scale token transfer before reaching the bear market bottom, lasting up to 12 months with declines exceeding 70%. This is the运动过程 of a "deep bear market."
The current持续减持 by long-term holders aligns with this characteristic, including持续流出 from BTC ETFs, but the selling pressure has been fully absorbed. Currently,交易所存量 BTC is still持续下降, which contradicts the "old cycle." Furthermore, for a "deep bear market," besides持续抛售 by long-term holders, internal fragility崩溃 needs to be triggered.
If it's a "new cycle," then long-term holders and ETF channel funds will resume accumulation after阶段性减持, with renewed accumulation减缓抛压甚至吸收抛压, establishing阶段性再平衡. If long-term holders resume accumulation,叠加 ETF channel fund回流, buying power大于卖力, prices can rise again or even reach new highs.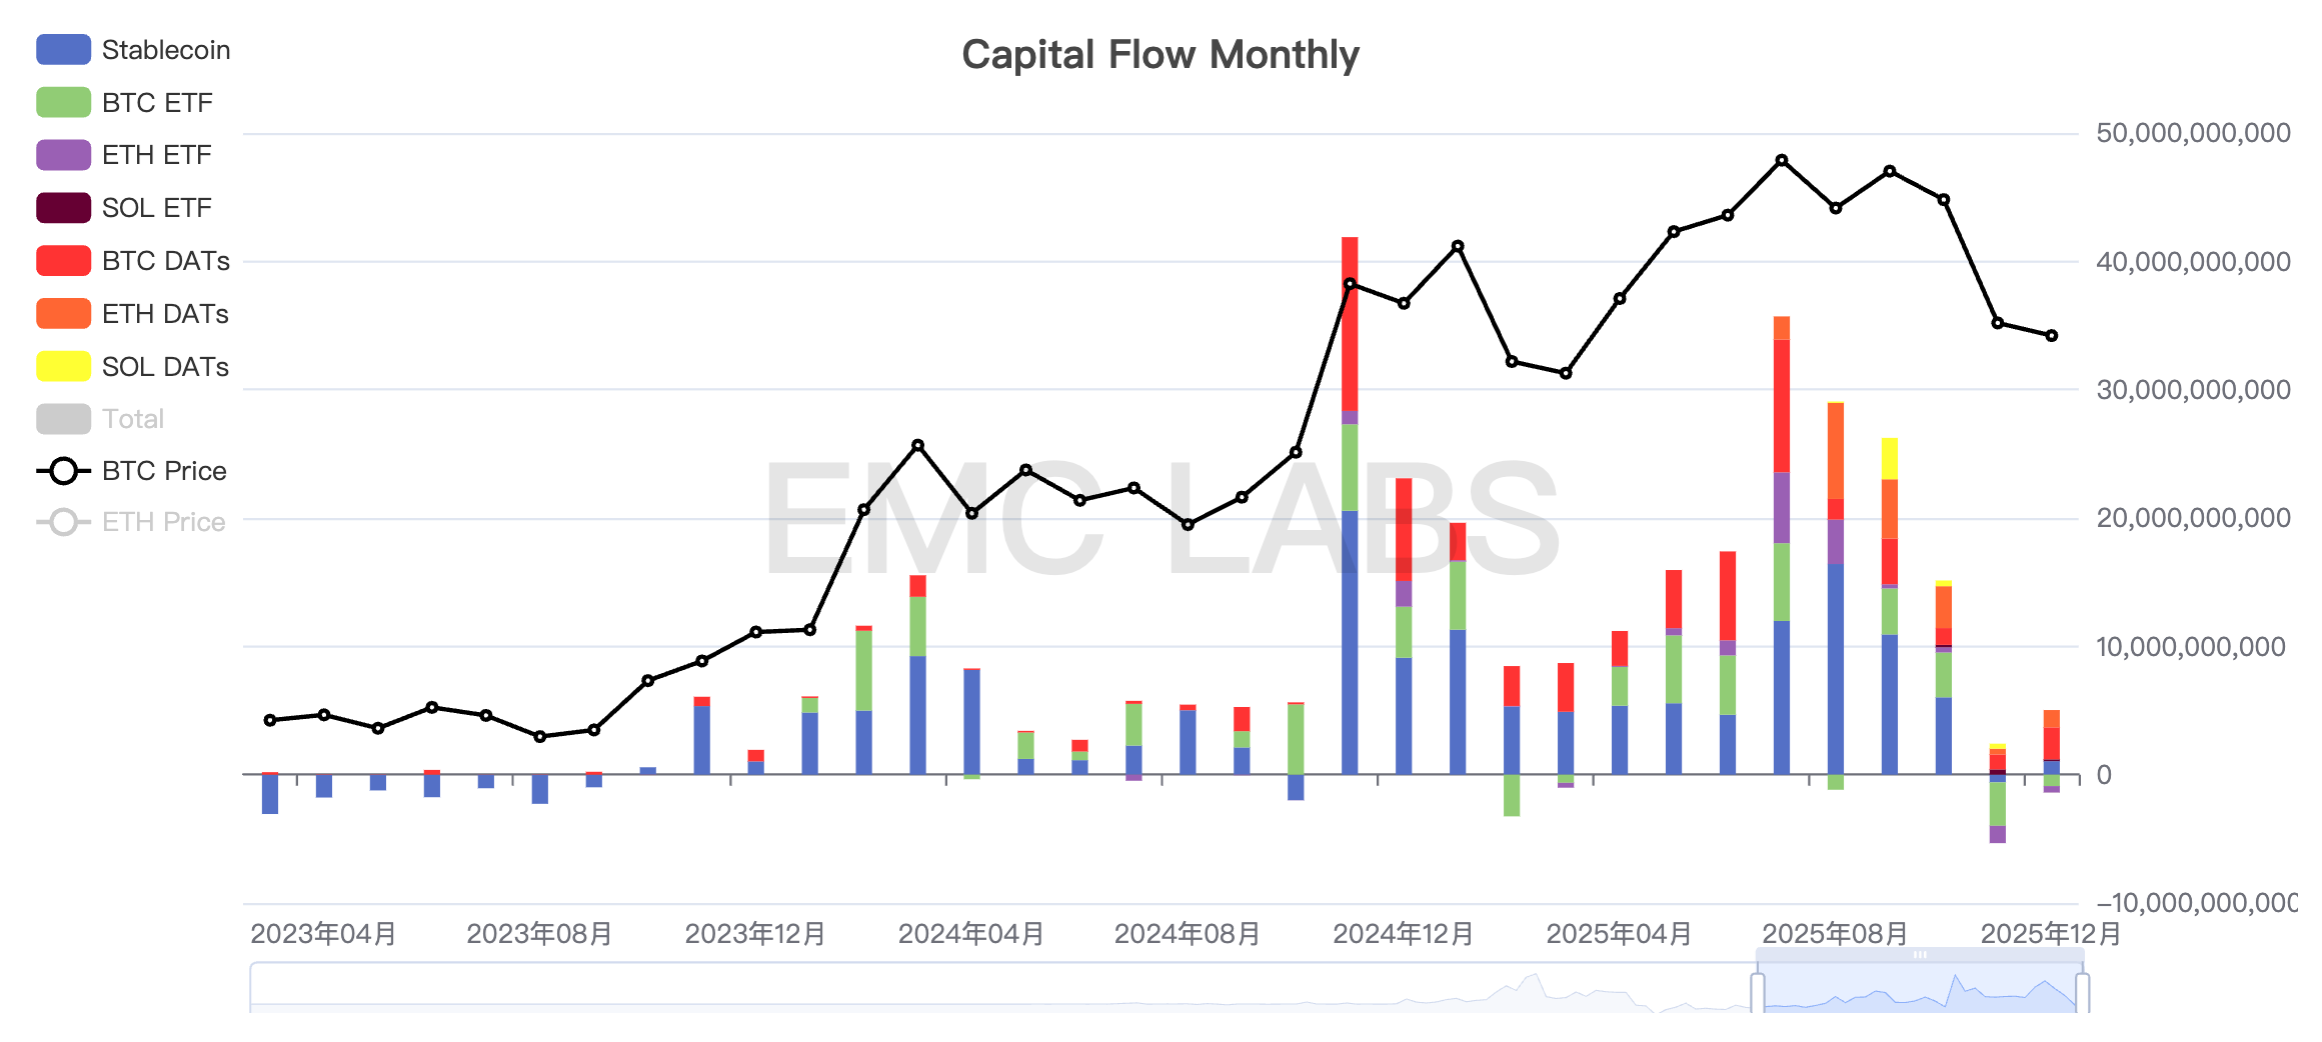
Monthly Statistics of Crypto Market Fund Inflows/Outflows


