
What exactly did the shrewd money that aggressively bought AAVE at low prices see?
- 核心观点:AAVE正从借贷协议进化为基础流动性层。
- 关键要素:
- 收入模型进入成熟区间,熊市收入底显著抬升。
- 稳定币GHO增长稳健,打开纵向整合增长曲线。
- 代币回购计划持续执行,产生可量化通缩效应。
- 市场影响:增强AAVE作为基础设施资产的长期配置价值。
- 时效性标注:长期影响。
Original article | Odaily Planet Daily ( @OdailyChina )
Author | Dingdang ( @XiaMiPP )

The revolving loan whale that was forcibly liquidated for approximately $101 per AAVE during the black swan event of October 11th did not exit the market. On the contrary, since November 24th, this address has continued to increase its AAVE holdings through revolving loans. As of now, its total holdings have risen to 333,000 AAVE, equivalent to approximately $62.59 million at the current price, with a total holding cost of approximately $167.
Around the same time, the well-known crypto investment firm Multicoin Capital also began to continuously build up its AAVE holdings: starting from October 17, it gradually increased its holdings through the Galaxy Digital OTC channel, and currently holds approximately 338,000 AAVE, with a market value of approximately $65.3 million.
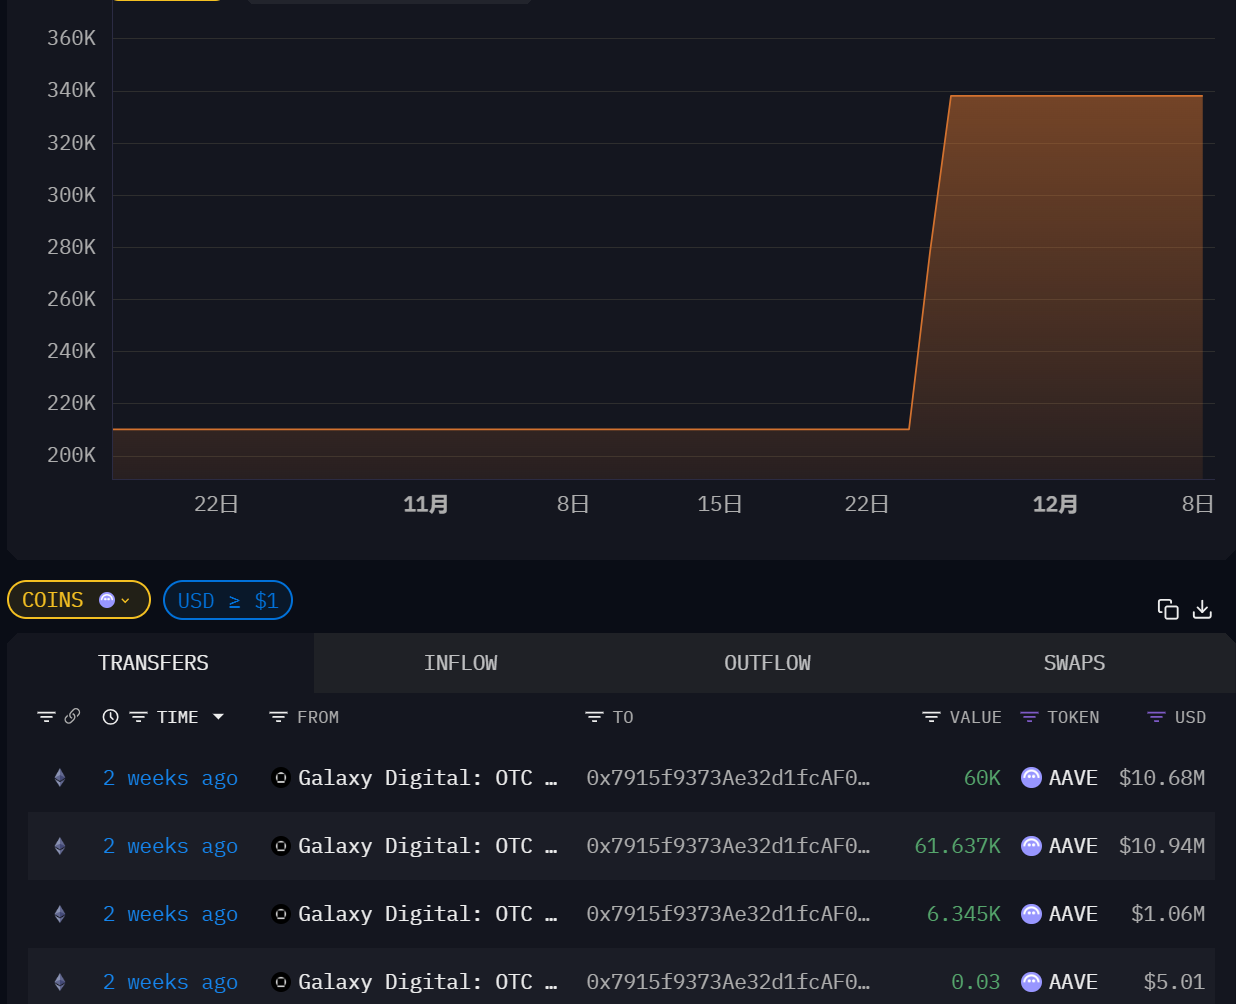
These transactions all occurred within the past month and a half. Can we interpret these obvious signs of increased capital inflows as "smart money" building a structural base position around AAVE? And is AAVE worth investing in?
Aave Protocol: Quasi-Infrastructure for On-Chain Lending
If on-chain lending is considered the closest DeFi sector to "native finance," then Aave has almost become the recognized standard in this field. Every metric—TVL, revenue, market share, and lending—confirms Aave's success.
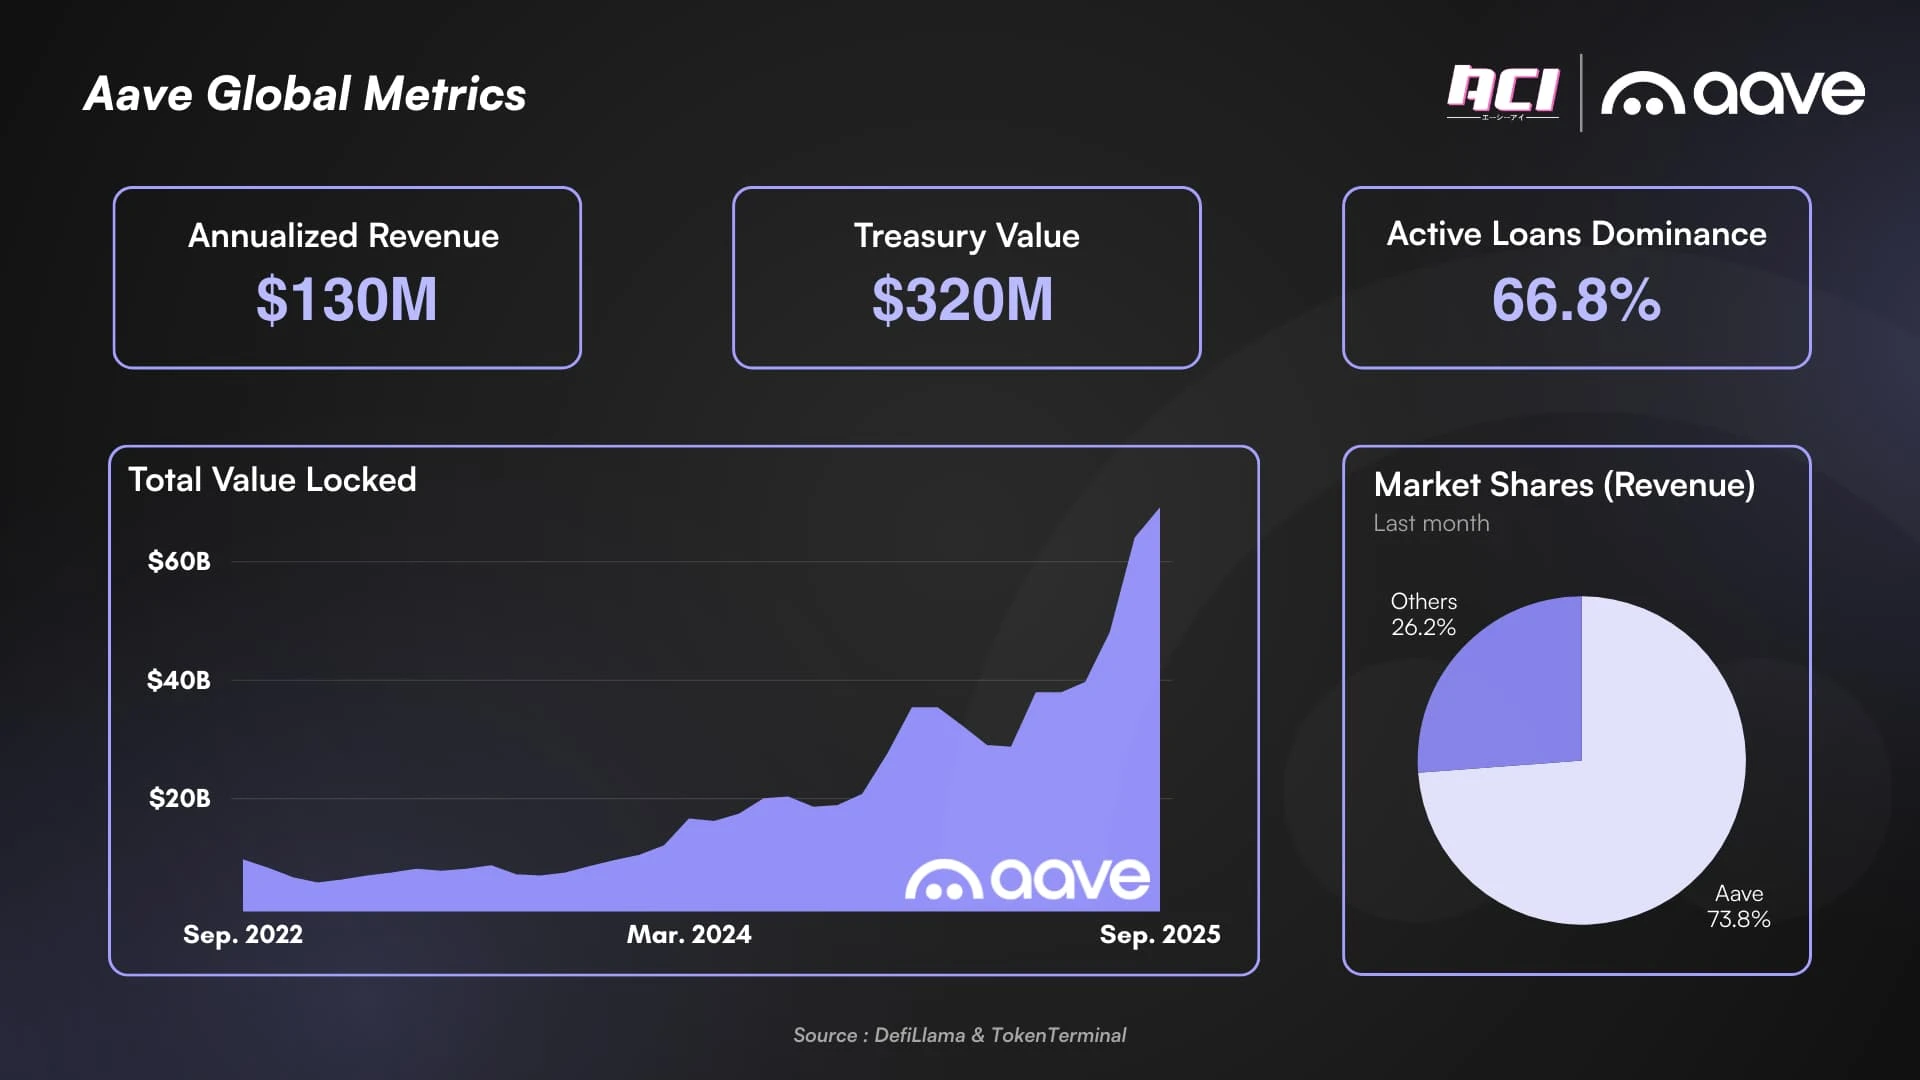
Especially in terms of revenue. As the most crucial metric for measuring the value of a DeFi protocol, Aave holds an absolute dominant position in the lending market. Approximately 79% of the lending market's revenue comes from the Ethereum mainnet, and of that, 87% belongs to Aave itself.
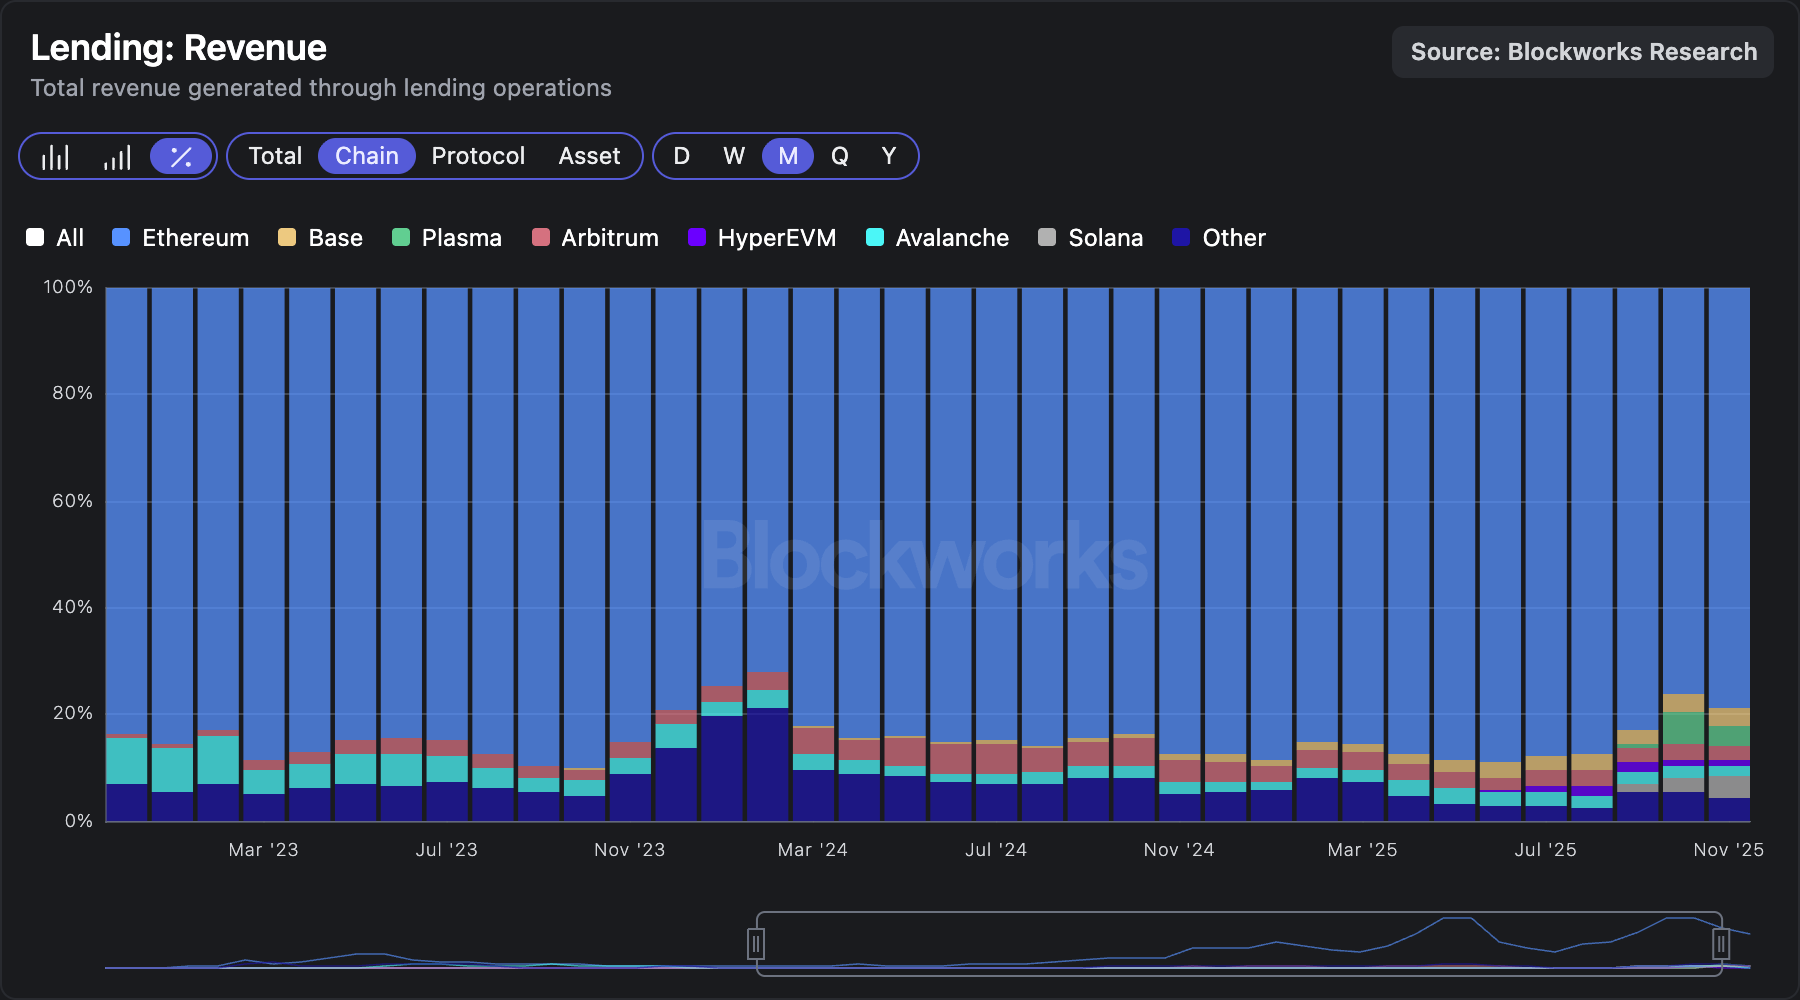
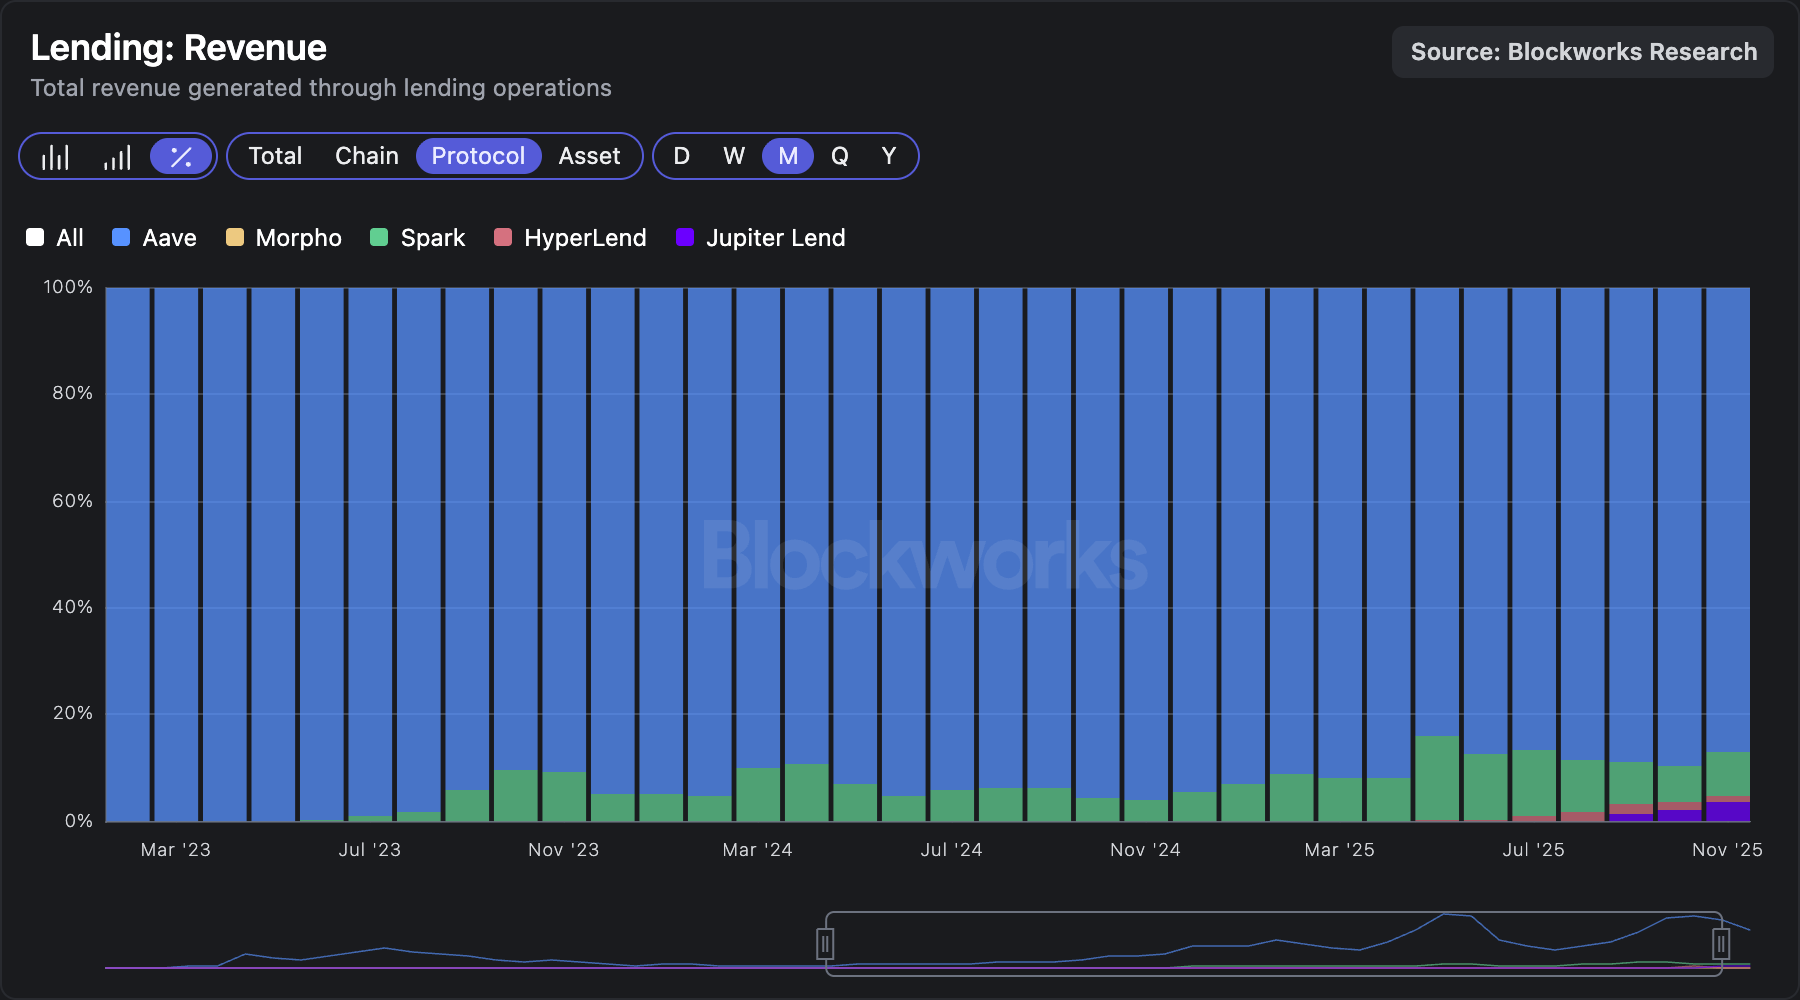
Data from Blockworks
This structure means that Aave is not just a "top-tier project," but rather closer to a foundational protocol that the market implicitly considers the default liquidity layer. However, the question remains: can this advantage translate into a more predictable cash flow logic, thereby supporting AAVE's investment value?
To avoid being misled by market noise, crypto user @intern_cc systematically deconstructed Aave's long-term financial structure, starting from the "profitability of the protocol itself" to assess whether its current growth is structural growth or simply a cyclical rebound.
The core analytical framework includes: 1) a revenue forecasting model, built on historical rolling multiples and specifically corrected for diminishing marginal returns in mature markets; 2) product integration capabilities, assessing the stability of GHO and its role in vertically integrated protocol revenue; and 3) capital efficiency indicators, reviewing the execution effect of the token buyback program and comparing it with the annual targets.
Odaily Planet Daily has compiled the key data as follows:
Income structure: Cyclicality remains strong, but the "bottom" is rising.
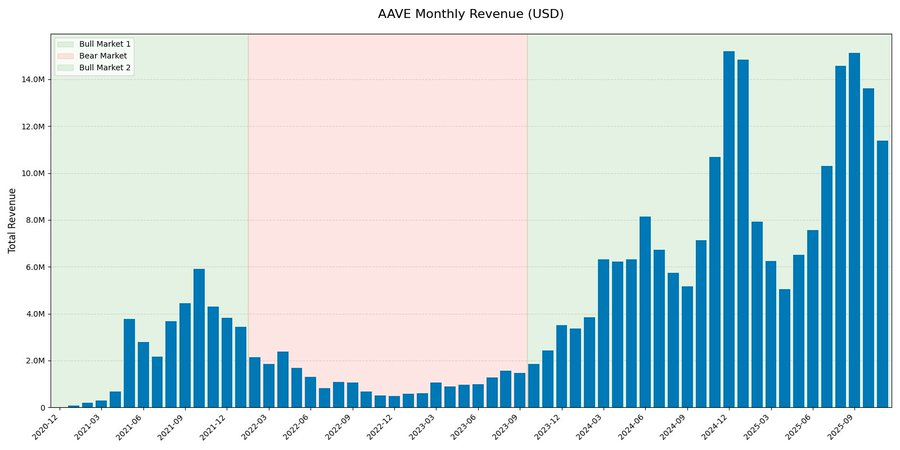
Looking back at Aave's monthly revenue data, it shows a strong cyclical pattern. But what's more noteworthy is that a clear structural shift has already occurred.
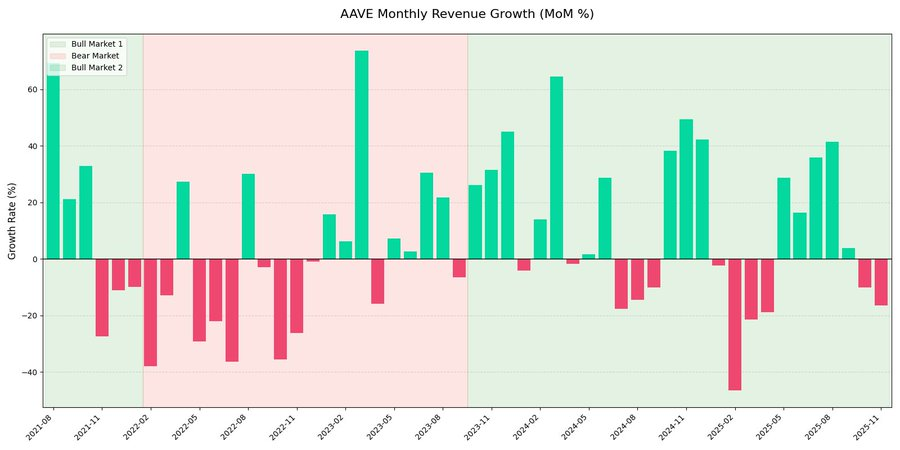
In the current cycle (“second bull market”), Aave’s monthly revenue has seen explosive growth, peaking at nearly $ 15 million , more than double its 2021 high. Despite the significant growth, the quarter-over-quarter revenue chart clearly shows that revenue remains highly volatile, primarily driven by market activity rather than exhibiting a linear, steady expansion.
The data also shows that contractual revenue exhibits a clear reflexivity across different market cycles.
The author also points out that even blue-chip DeFi protocols like Aave will find it difficult to completely eliminate cyclical fluctuations during future bear markets. Newer protocols such as Ethena and Pendle may face more severe survival challenges in future bear markets, but will experience significant prosperity during bull market cycles. The only blue-chip DeFi protocol that has seen a relatively mild decline in trading volume and revenue during bear markets is actually Uniswap.
GHO: Aave's Key Variable in Moving From "Horizontal Expansion" to "Vertical Integration"
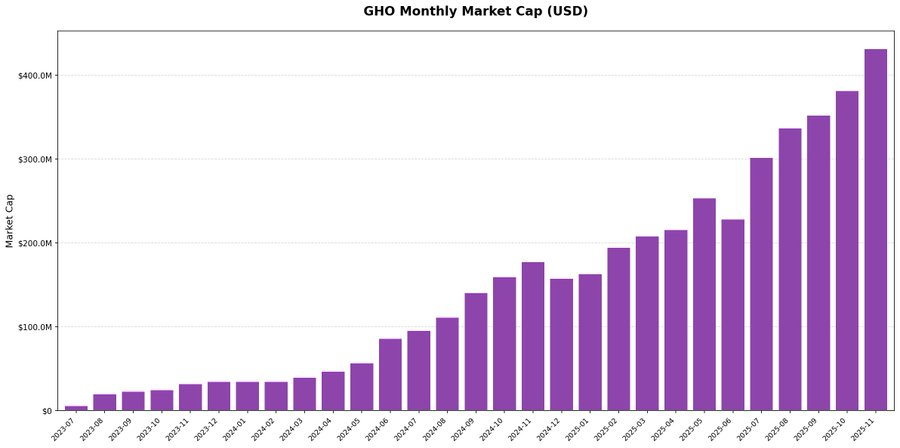
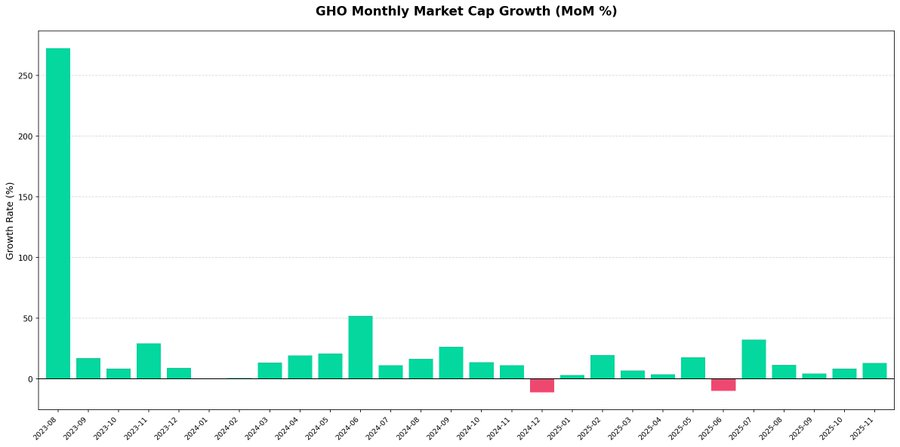
Since its launch in the third quarter of 2023, GHO has maintained a steady upward trend, and its market value has exceeded $400 million by the end of 2025.
The month-on-month data shows extremely low volatility and almost no obvious signs of capital outflow, indicating that demand is sustainable rather than being driven by short-term speculative rotation of funds.
This trajectory validates the effectiveness of Aave's strategy of promoting vertical integration. The growth of GHO is natural growth , and there was no abnormal surge in TVL.
A horizontal comparison between GHO and crvUSD reveals that CDP-type stablecoins from blue-chip DeFi protocols exhibit a clear structural demand base . 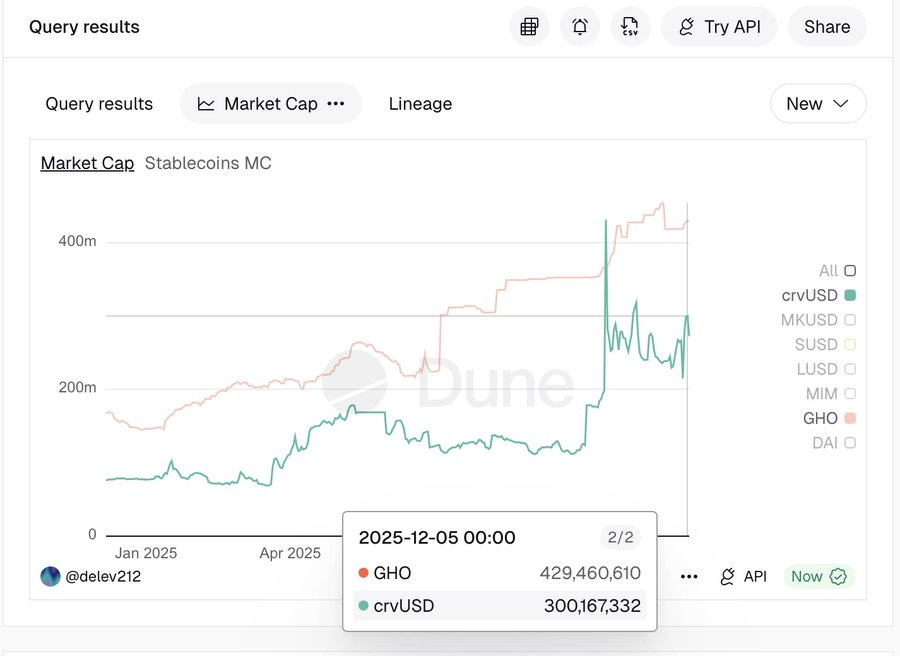
Revenue forecasting model: Aave is entering the "mature agreement phase".
The author uses a rolling window model to model the historical cycles, arguing that instead of subjectively assuming future growth rates, it is better to accurately measure the actual revenue performance of agreements in each 12-month period of the historical market cycle, and to break it down into bear market contraction phases and bull market expansion phases.
Regarding scenario setting, three scenarios were selected based on the distribution of historical samples:
- Conservative scenario (25th quantile)
- Baseline scenario (median)
- Optimistic scenario
It is worth noting that the optimistic scenario does not use the common upper quartile (75th quartile), but is deliberately limited to the 60th quartile range to filter out extreme outliers. The core purpose of this design is to reflect the law of diminishing marginal returns , ensuring that the model reflects the growth trajectory of the protocol after it enters the mature stage, rather than early explosive abnormal returns.
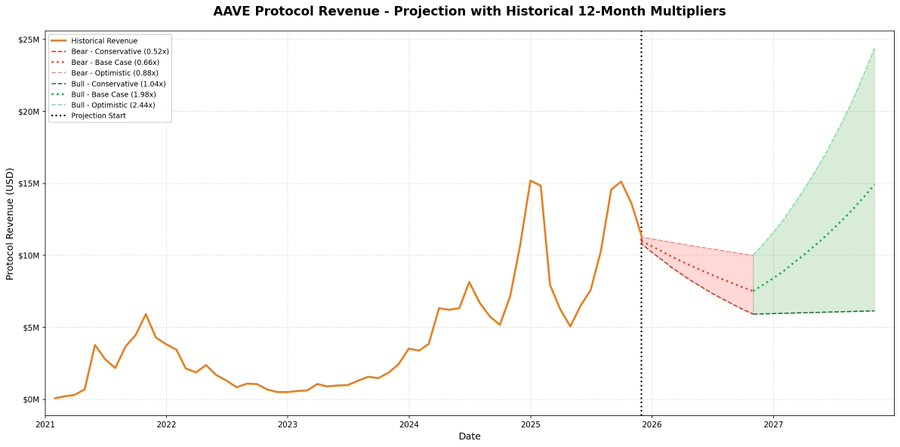
The model results show that Aave is significantly more mature than during its first bear market cycle. Future earnings may still decline, but the pullback will be significantly milder.
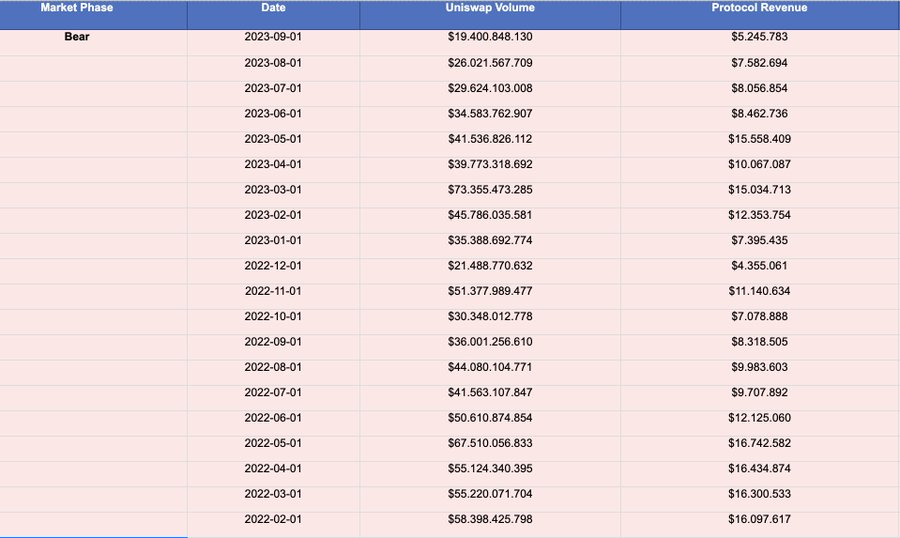
Of particular note is that even under a bear market scenario (multiples of 0.52x–0.88x), the projected bottom for revenue is approximately $6 million per month, still higher than the historical peak during the 2021 bull market.
AAVE Buyback: The Real Implementation of Deflation Mechanisms
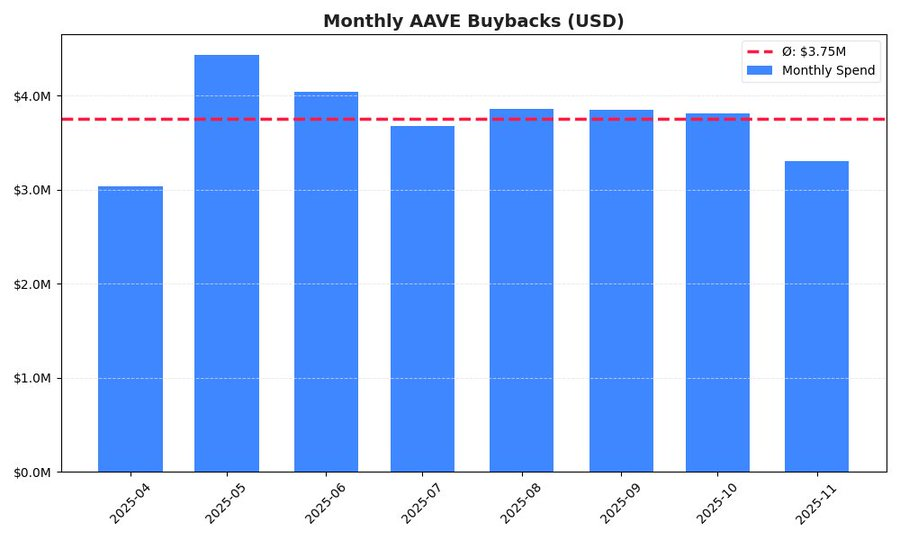
The monthly repurchase fluctuation chart shows that the agreement adopted a relatively disciplined and non-speculative execution strategy. Although there were slight fluctuations (such as a temporary peak in May), the overall pace was relatively stable.
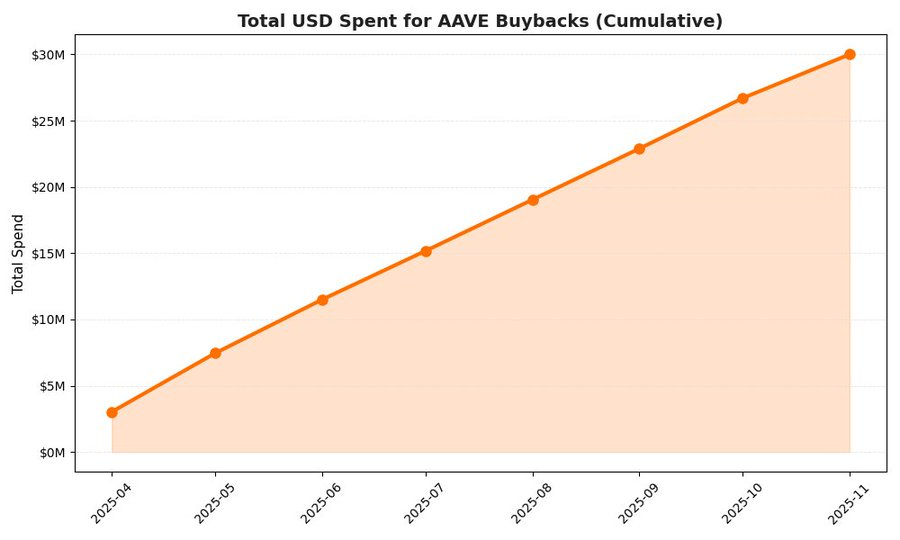
Cumulative data shows that Aave has invested approximately $30 million in the first eight months after the buyback program began. To achieve the official annual target of $50 million, the corresponding monthly pace should be approximately $4.17 million. Currently, the actual monthly pace is approximately $3.75 million. Based on the current rate, the annualized buyback amount is approximately $45 million, representing a deviation of about 10% from the target.
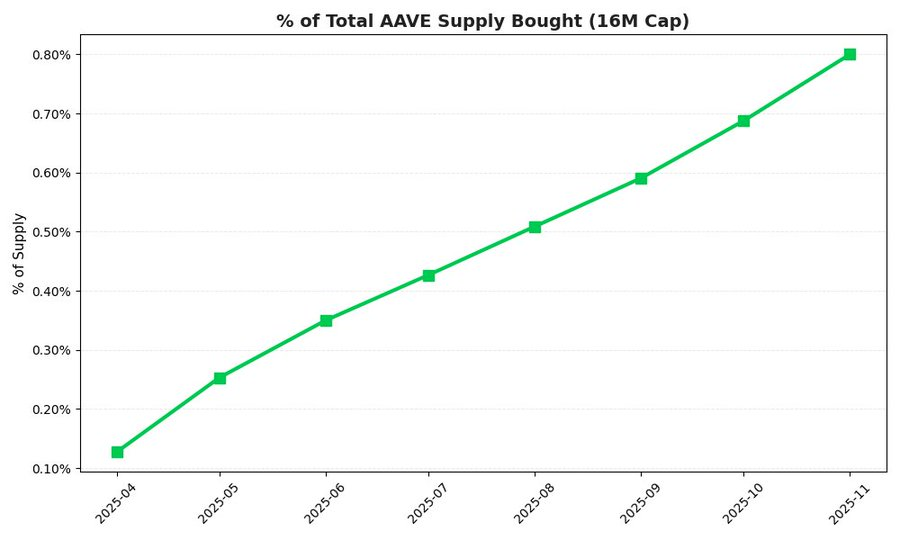
The buyback mechanism has already exerted quantifiable deflationary pressure on the token supply: in just 8 months, the protocol has bought back approximately 0.80% of the total supply (16 million AAVE).
Conclusion
From an agreement perspective, Aave is evolving from a single lending agreement into a basic liquidity layer: the income model is gradually maturing, GHO is opening up a second growth curve of vertical integration, and the repurchase mechanism is beginning to form a real and quantifiable deflationary constraint on the supply side. These changes will not be fully priced in within a single bull and bear cycle, but they are quietly changing AAVE's long-term risk-return structure.
Short-term price fluctuations are inevitable, but if we consider a longer-term, infrastructure-oriented asset allocation strategy, AAVE can still be a high-quality choice.


