
Bitcoin Data Analysis: Correction or New Bear Market?
- 核心观点:比特币短期趋势转弱,进入修正阶段。
- 关键要素:
- 跌破10万美元关键心理关口。
- 短期持有者实现价格成阻力。
- 未出现恐慌性抛售的底部特征。
- 市场影响:短期需谨慎,等待更强复苏信号。
- 时效性标注:短期影响
Original author: Bitcoin Magazine Pro
Original translation: Blockchain in Plain Language

Bitcoin has begun to show clear signs of weakness, with its recent drop below six figures ($100,000) prompting a reassessment of its near-term outlook. With some key technical and on-chain levels breached, I've revised my base case scenario to a below-50% chance of a retest of new all-time highs in the coming weeks. This could change rapidly if key levels are restored, but until then, the market appears to have shifted from a trending uptrend into a correction phase.
"Buying the Dip"
Bitcoin has seen a significant pullback, but buying on dips isn't always the best approach unless it's within a confirmed bullish trend. In a bearish environment, even nascent pullbacks can cause prices to fall sharply. Short-term and impending retracements are typical in downtrends, so reacting to data rather than preemptively predicting the bottom becomes even more important.
Our chart analysis of the Short-Term Holder Realized Price from the previous cycle reveals this pattern of multiple pullbacks. It's also clear that this indicator acted as key resistance during this phase, and a sustained rebound only occurred after BTC recovered to the Short-Term Holder Realized Price level.
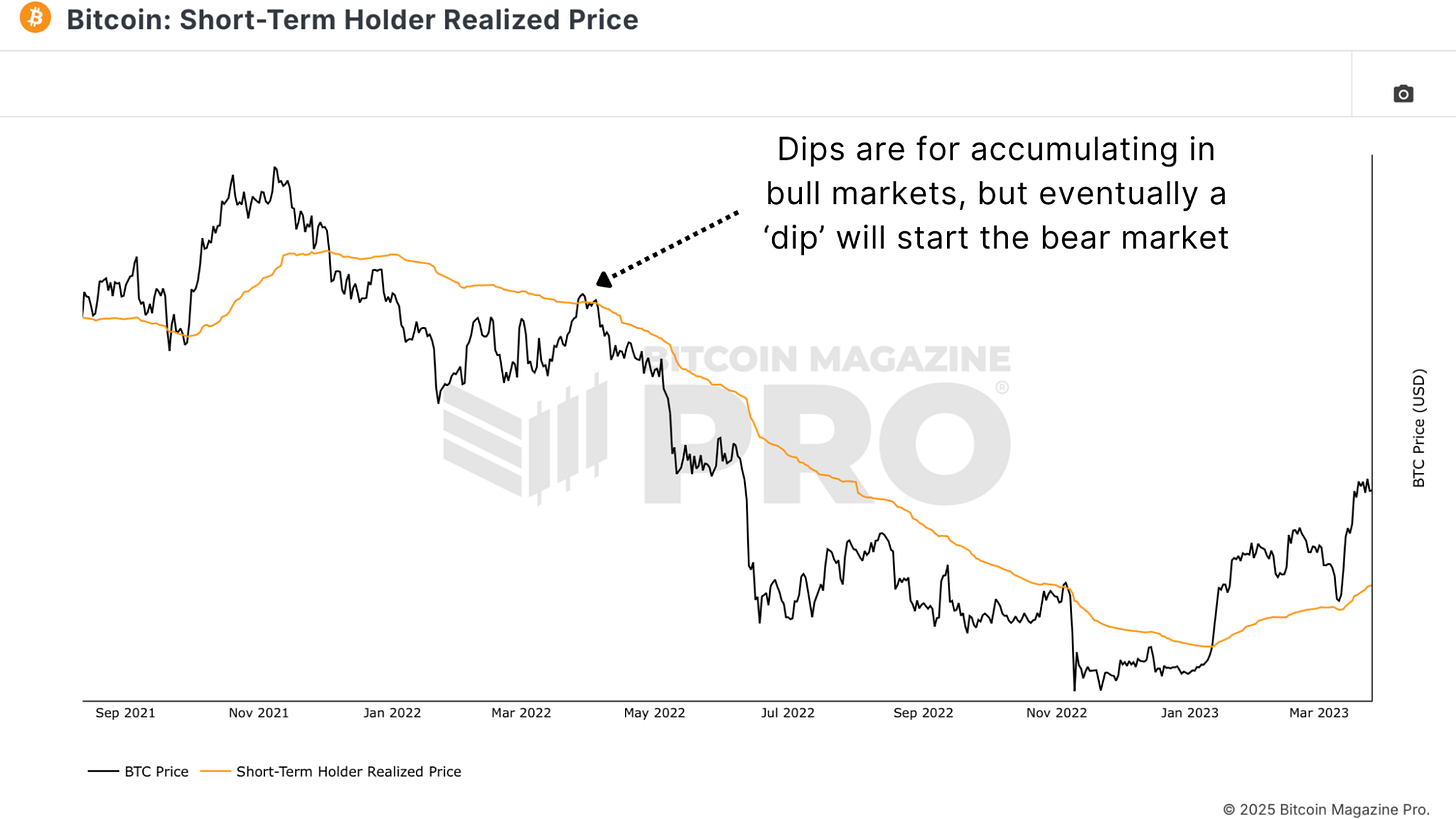 Figure 1: As observed in the previous cycle, there were multiple pullbacks before reaching the market bottom.
However, there's a caveat: if prices effectively reclaim key levels, the entire picture will change. That's why it might make sense to make small allocations during this pullback, while postponing further purchases until we see macro-level consistency at the levels, allowing for a more defensive approach.
Key observation level
The MVRV Z-Score and Bitcoin Realization Price (Bitcoin Realization Price) provide a clearer picture of where the broader market cost base lies. Currently, the network's realization cost base is clustered in the $50,000 range, but this figure is rising daily.
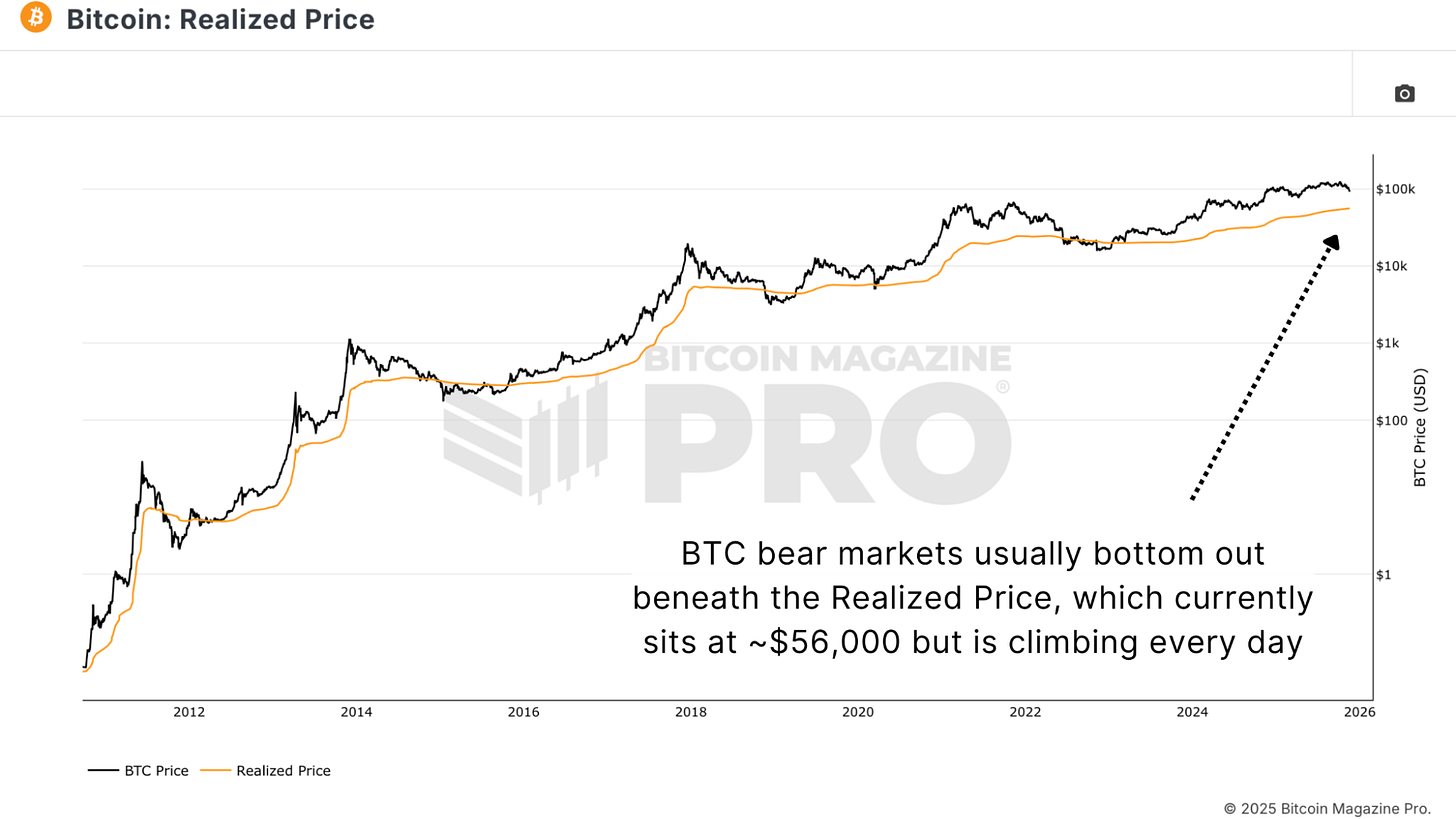 Figure 2: Historically, bear market bottoms typically occur when the price of BTC is below its actual price.
A similar situation exists with the 200-week moving average, as it is currently also in the $50,000 range. Historically, points where this indicator intersects with price have provided strong long-term accumulation opportunities.
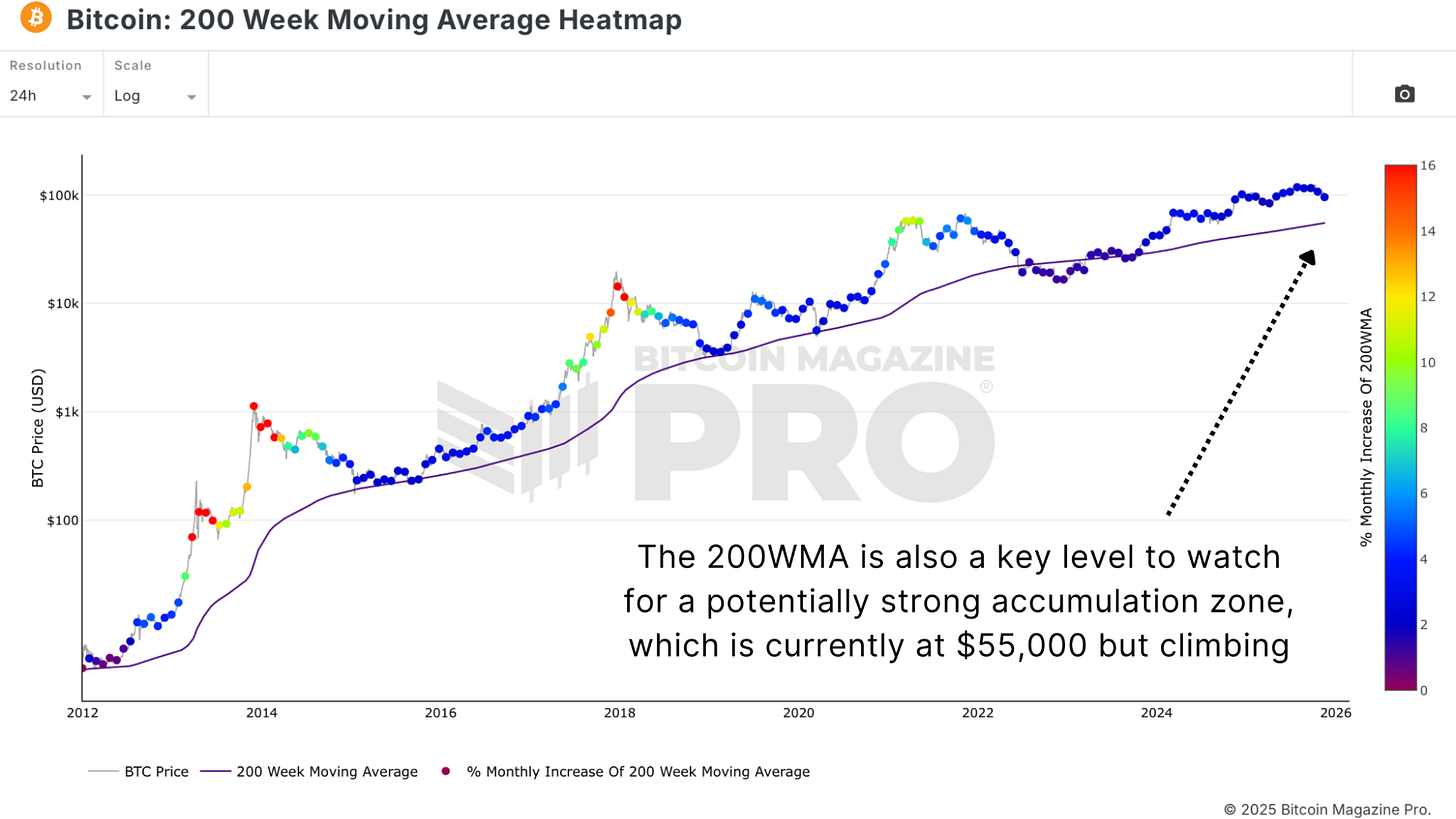 Figure 3: The 200WMA also suggests that $55k is an accumulation point, even though it is rising every day.
These are slowly rising every day, meaning a potential bottom could form at $60,000, $65,000, or higher, depending on how long Bitcoin's continued trend lasts. Importantly, value tends to level off when spot prices trade near the network's historical average cost, and key buy support levels provide consistency.
Supply and demand signals
The Value Days Destroyed (VDD) Multiple remains an important indicator for identifying stress points for long-term and experienced holders. A very low interpretation suggests that a large amount of stagnant currency has not been moved, which often coincides with market bottoms. However, short-term surges may indicate capitulation pressure, which often accompanies or precedes major market turning points.
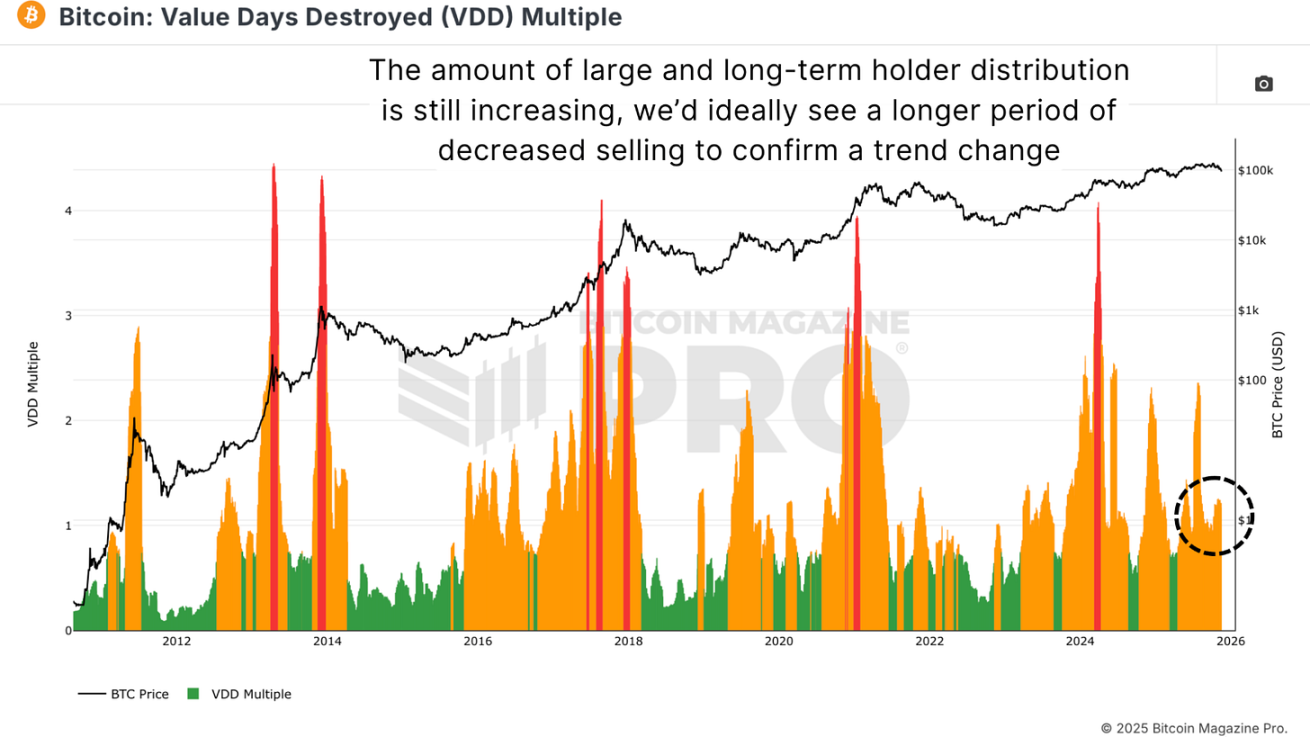
Figure 4: Current VDD multiplier readings indicate that larger and more experienced participants in the market remain very active.
Currently, this indicator continues to rise as prices fall, suggesting that many holders are exhausted from selling. This is not characteristic of a cycle bottom, which is typically characterized by forced selling that is extreme and compressed in the short term. At this stage, the market appears to be gradually releasing rather than becoming exhausted. Meanwhile, the long-term holder supply should ideally stabilize and begin to increase again before any significant bottom is confirmed, as bottoms form when the most patient participants begin to hold (accumulate) rather than exit.
Funding rates
Periods of extreme fear are often clearly manifested by large short positions, negative funding rates as indicated by Bitcoin Funding Rates, and huge realized losses. These conditions suggest that weak hands have entered the decline, and strong hands are absorbing the supply.
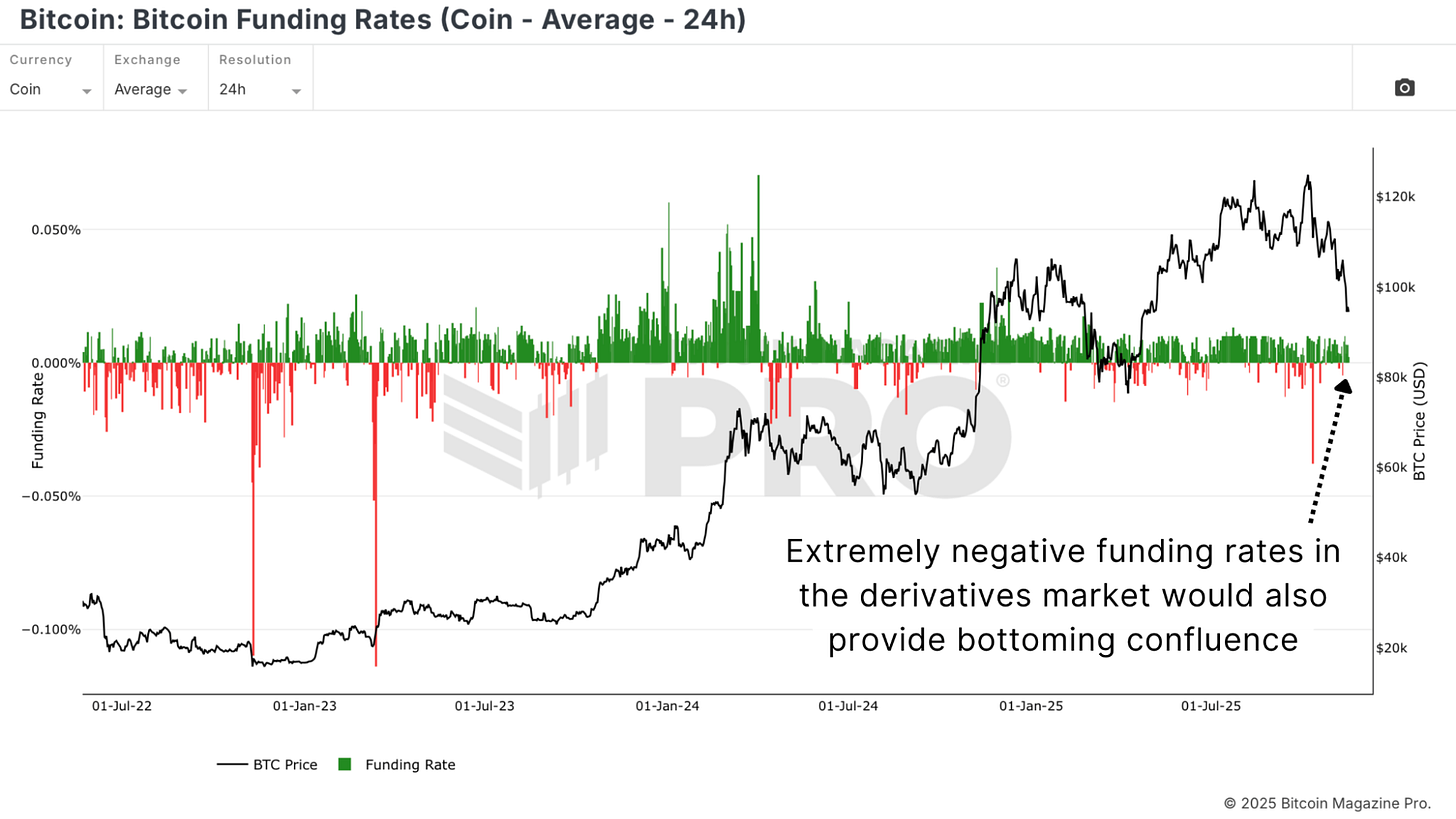 Figure 5: A significant market low is likely to occur when Bitcoin funding rates are severely negative, which is usually followed by a price rebound.
The market has not yet exhibited the hallmark panic selling and shorting typically associated with significant cyclical lows. Without pressure from the derivatives market and a rush to realize losses, it's difficult to say the market has fully cleared.
The level that must be recovered
Assuming the bearish scenario is wrong, this is certainly the preferred outcome. In this case, Bitcoin would need to begin recovering key structural levels, including the psychological level of $100,000, the short-term holders' realization price, and the 350-day moving average, as depicted on the Golden Ratio Multiplier chart.
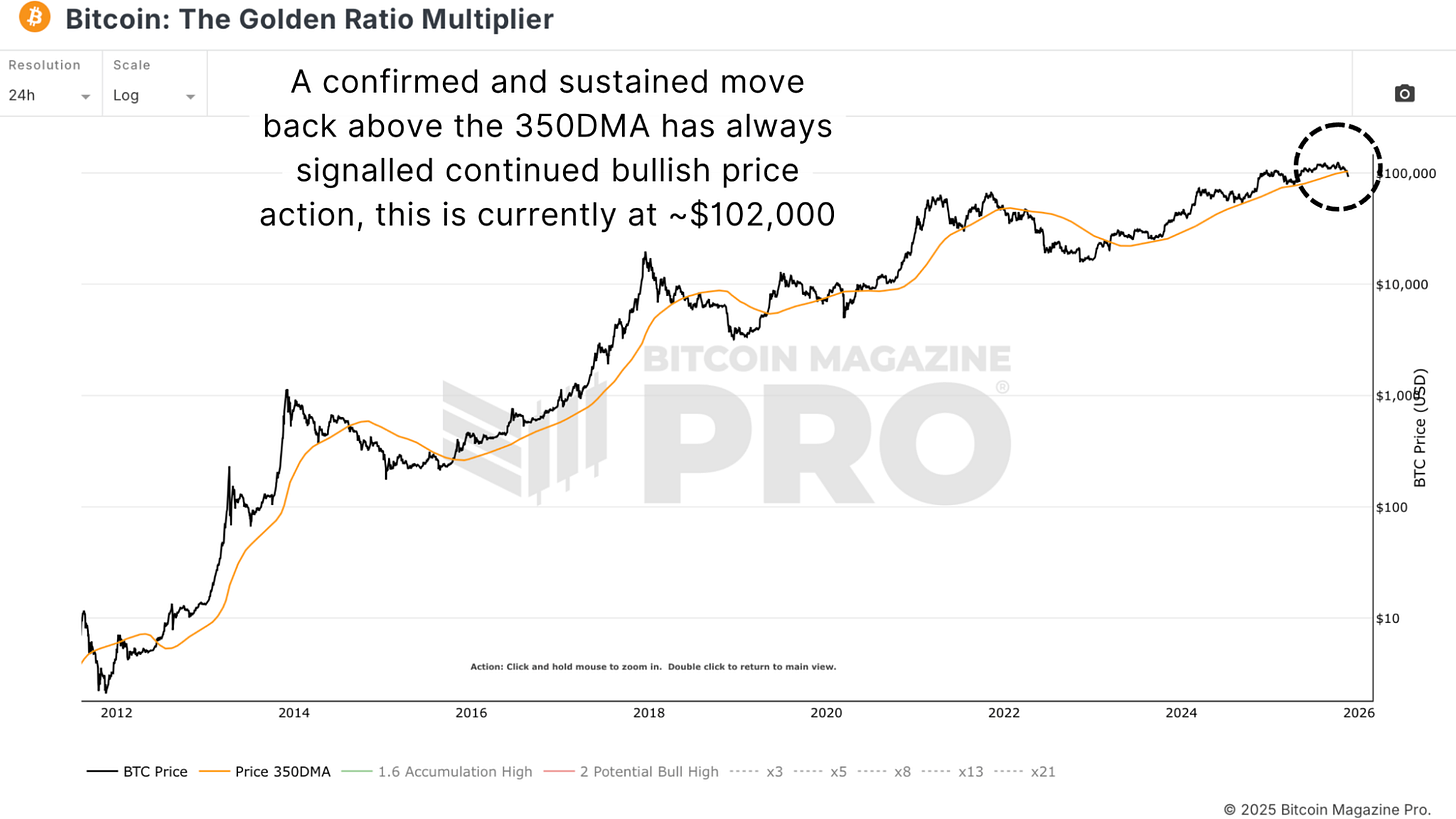 Figure 6: BTC must achieve a sustained recovery above the 350-day moving average to resume its bullish trend.
Sustained closing prices at these levels, coupled with the strength of global risk assets, would indicate a trend reversal. Until then, however, the data is currently leaning towards a conservative approach.
in conclusion
The outlook has become more defensive since breaking below several key levels. Bitcoin's long-term fundamentals are not structurally flawed, but the short-term market structure is not indicative of a healthy bullish trend.
Current recommended strategies include not buying on dips, waiting for consensus to emerge before large-scale position building, respecting macroeconomic conditions and trends, and only becoming aggressive when strength is proven. Most investors can never pinpoint the top or bottom of a target; targets are located near high-probability areas with sufficient confirmation of the market's excess reserves over several months.


