
Data Breakdown: The Battle to Defend $100,000 – Will Bitcoin Rebound or Dip?
- 核心观点:比特币市场结构转弱,处于脆弱平衡。
- 关键要素:
- 跌破11.25万成本基准,需求减弱。
- 长期持有者减持30万枚比特币。
- ETF持续流出,现货卖压明显。
- 市场影响:短期下行风险增加,需新资金推动反弹。
- 时效性标注:短期影响
Original title: "Defending $100,000: Will Bitcoin Rebound or Continue to Fall?"
Original authors: Chris Beamish, CryptoVizArt, Antoine Colpaert, Glassnode
Original translation by Luffy, Foresight News
summary
- Bitcoin has fallen below the short-term holders' cost benchmark (approximately $112,500), confirming weakening demand and officially ending the previous bull market phase. The price is currently consolidating around $100,000, down about 21% from its all-time high (ATH).
- Approximately 71% of the Bitcoin supply remains profitable, consistent with a mid-term correction. The 3.1% relative unrealized loss rate suggests a mild bear market phase rather than a deep capitulation.
- Since July, the supply of Bitcoin from long-term holders has decreased by 300,000 coins, and the selling continues even as prices fall—a pattern different from the "sell on rallies" seen earlier in this cycle.
- The US spot Bitcoin ETF has seen continuous outflows (daily outflows of $150 million to $700 million), and the cumulative volume difference (CVD) of spot trading on major exchanges indicates persistent selling pressure and weakening demand for independent trading.
- The directional premium in the perpetual contract market fell to $118 million per month from $338 million in April, indicating that traders are reducing their leveraged long positions.
- Strong demand and rising premiums for put options with a strike price of $100,000 indicate that traders are still hedging risk rather than buying on dips. Short-term implied volatility remains sensitive to price fluctuations, but has stabilized after surging in October.
- Overall, the market is in a fragile equilibrium: demand is weak, losses are manageable, and caution is prevalent. A sustained rebound would require renewed capital inflows and a recovery of the $112,000-$113,000 range.
On-chain insights
Following last week's report, Bitcoin fell below the psychological level of $100,000 after several unsuccessful attempts to recover to the cost basis of short-term holders. This break confirms weakening demand momentum and continued selling pressure from long-term investors, signaling that the market has clearly exited the bull market phase.
This article will assess the structural weakness in the market using on-chain price models and funding expenditure indicators, and then combine spot, perpetual contract, and options market data to determine market sentiment and risk positions for the coming week.
Test the support level below
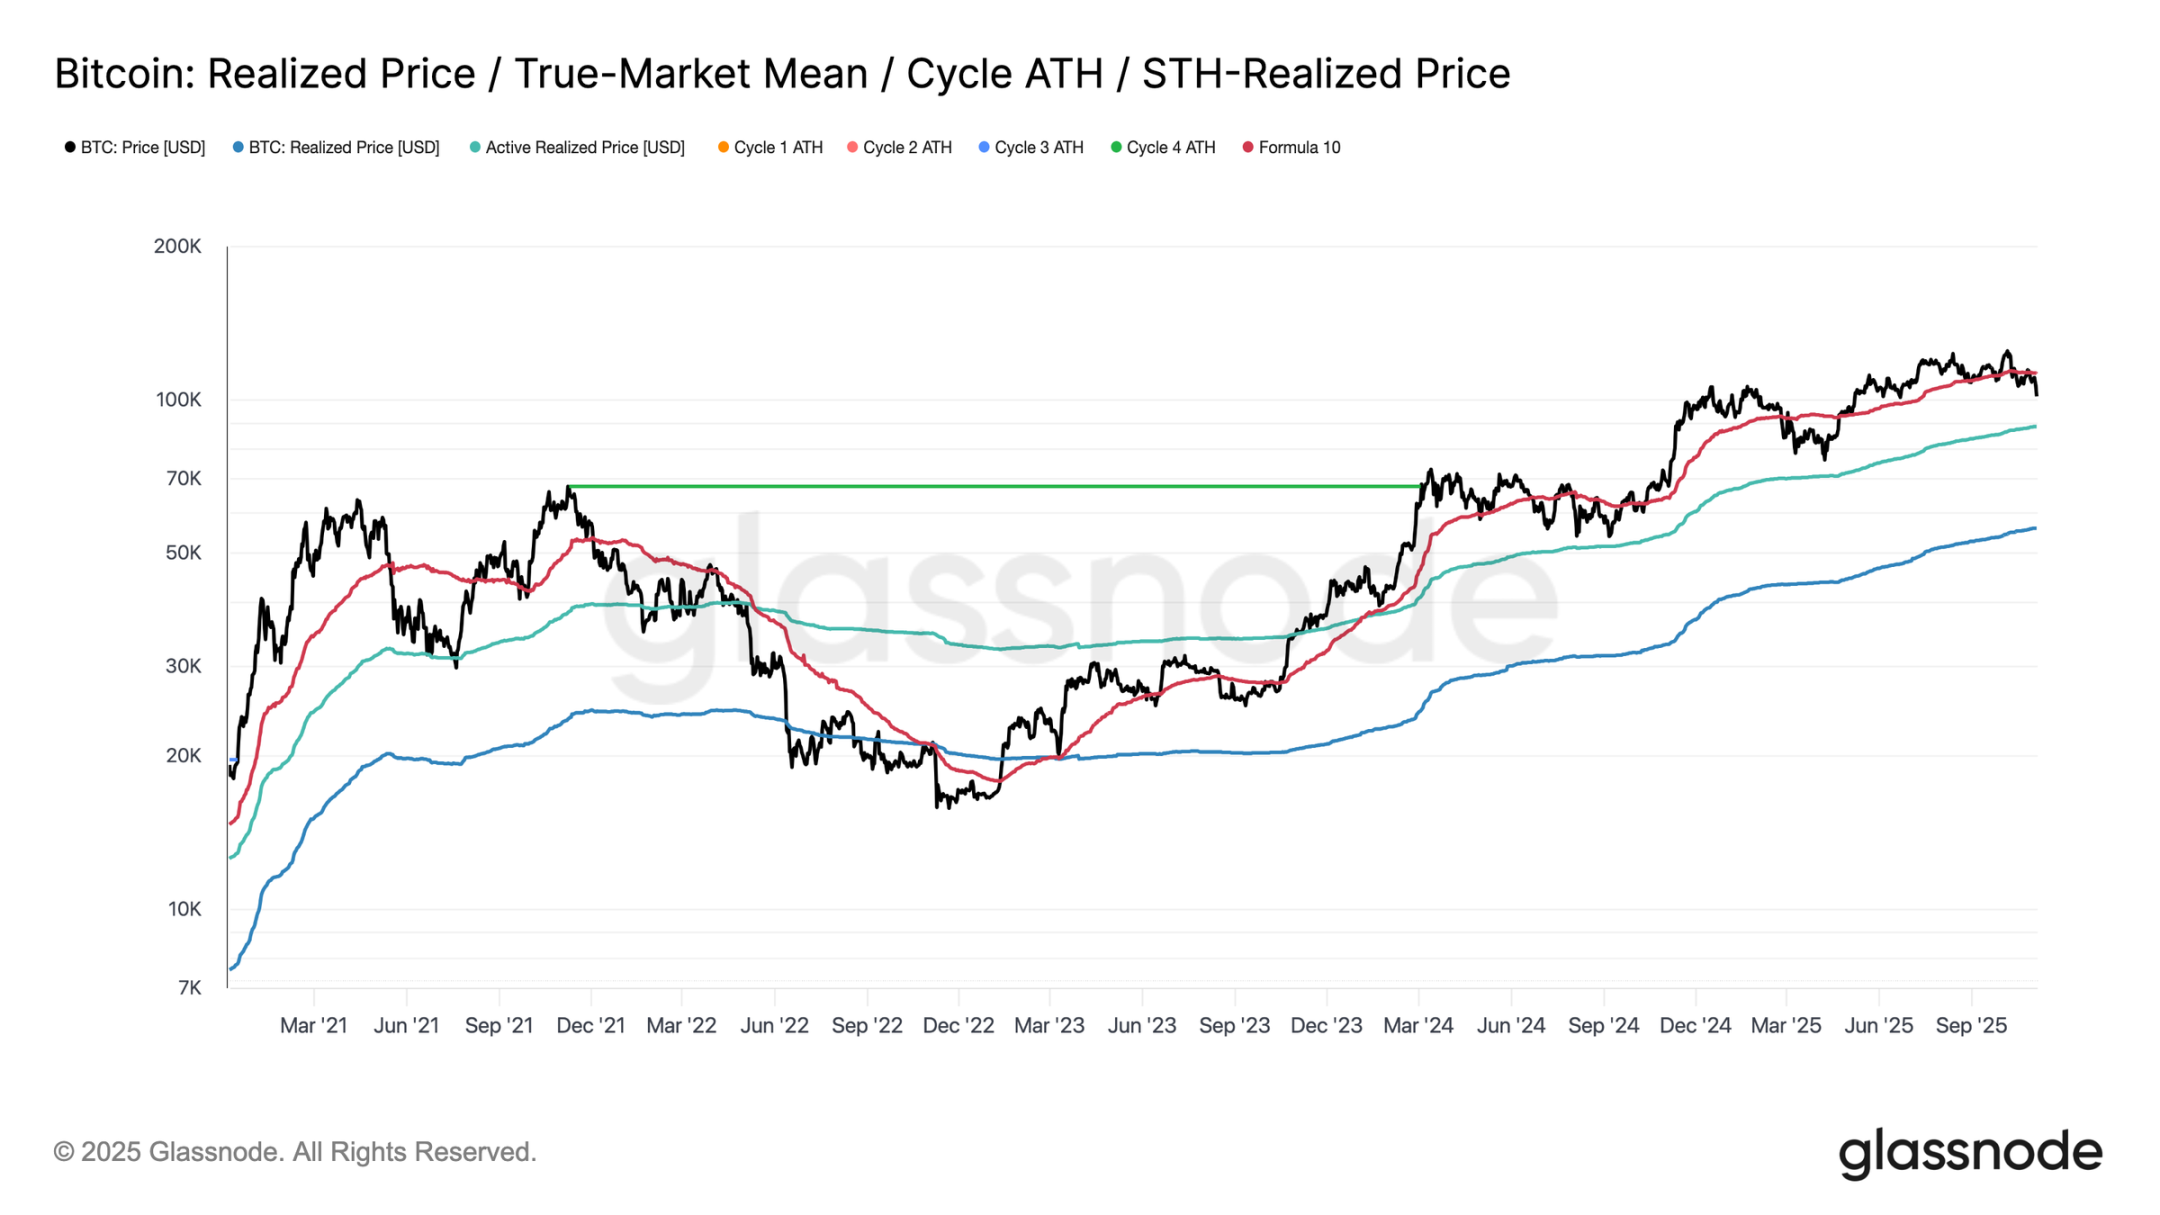
Since the market crash on October 10, Bitcoin has struggled to stay above the cost benchmark for short-term holders, eventually falling sharply to around $100,000, about 11% below the key threshold of $112,500.
Historically, when prices fall so significantly below this level, the likelihood of further declines to lower structural support levels increases—for example, the current active investor realization price of approximately $88,500. This metric dynamically tracks the cost benchmark of active circulating supply (excluding dormant tokens) and has often played a key reference role during long-term correction phases in past cycles.
Standing at the crossroads
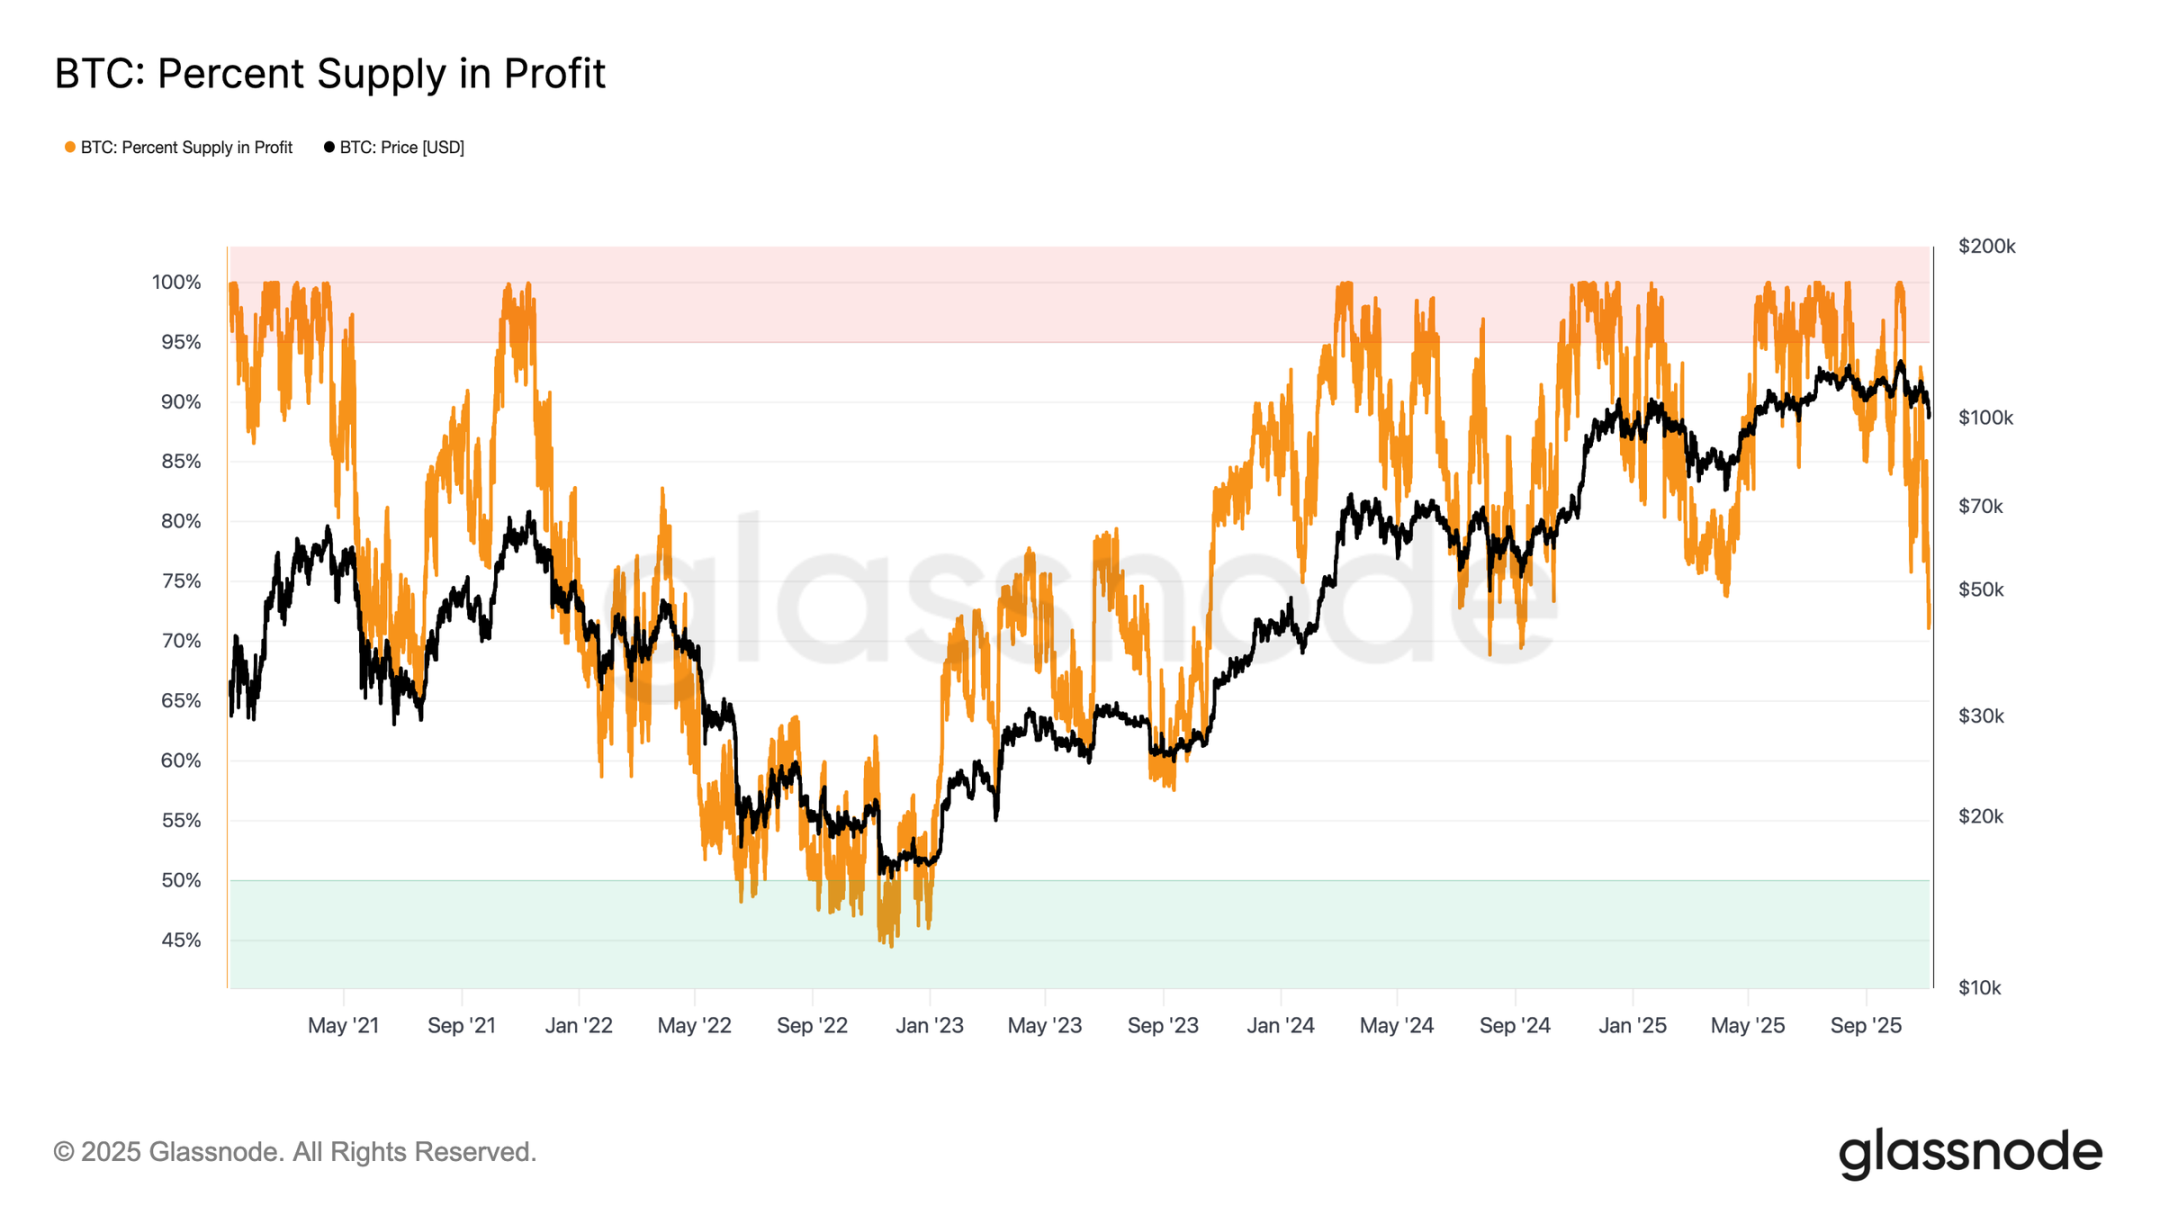
Further analysis reveals that the structure formed by this adjustment is similar to that of June 2024 and February 2025—both periods when Bitcoin was at a critical crossroads between "rebound" and "deep contraction." At the current price level of $100,000, approximately 71% of the supply remains profitable, placing the market at the lower end of the typical 70%-90% profitable supply equilibrium range during a mid-term slowdown.
This phase typically sees a brief rebound towards short-term holders' cost basis, but a sustained recovery usually requires prolonged consolidation and new demand inflows. Conversely, if further weakness leads to more holders incurring losses, the market may transition from the current mild decline to a deep bear market. Historically, this phase has been characterized by capitulation selling followed by a prolonged period of reaccumulation.
Losses are still manageable
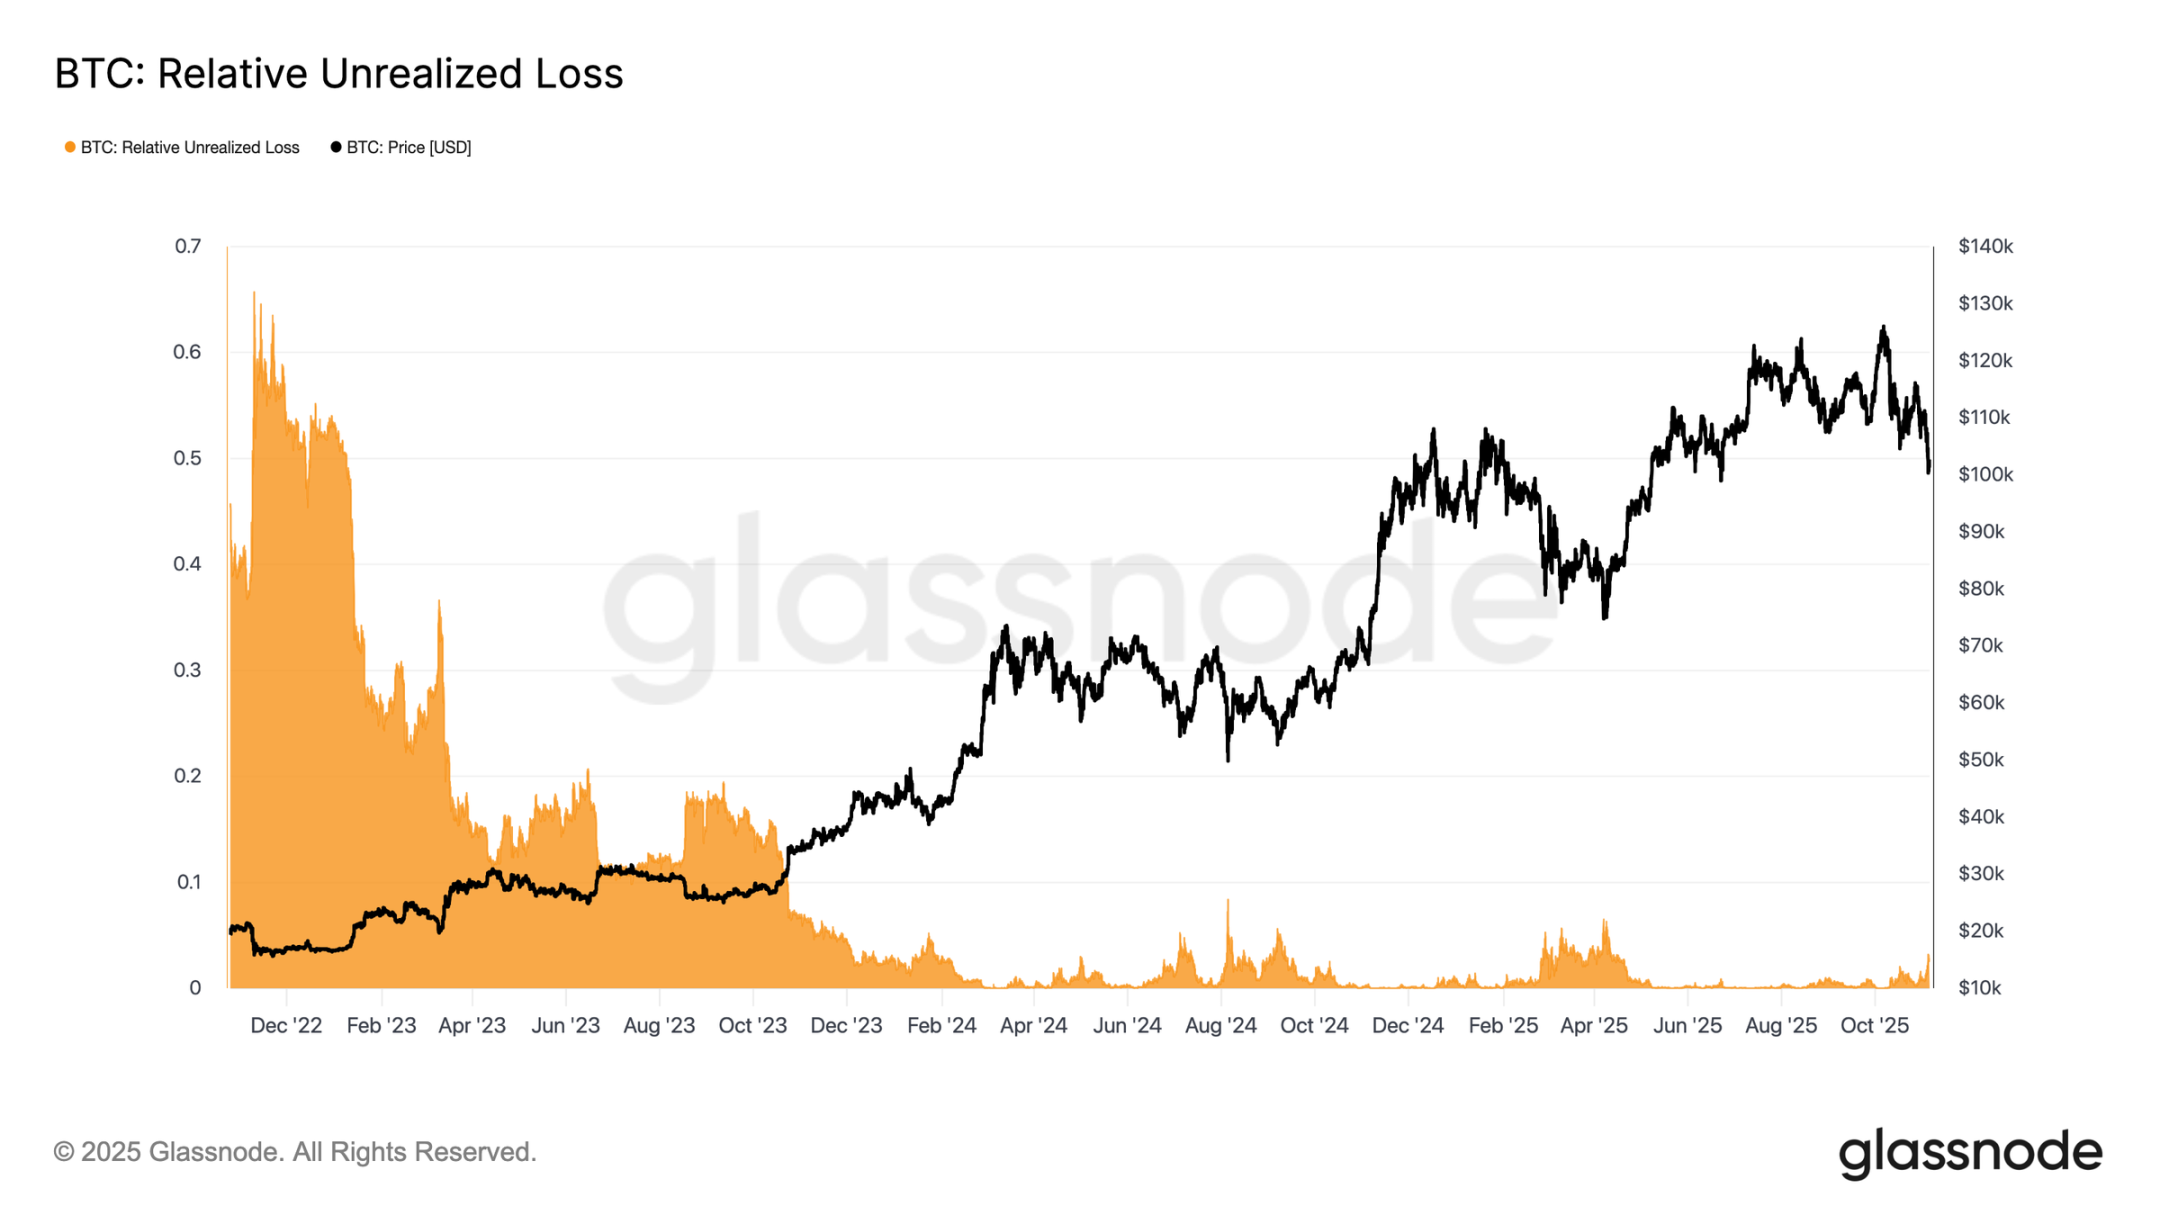
To further differentiate the nature of the current pullback, the relative unrealized loss ratio can be used as a reference—this metric measures the ratio of total unrealized losses in USD terms to market capitalization. Unlike the extreme loss levels during the 2022-2023 bear market, the current unrealized loss ratio of 3.1% indicates moderate market pressure, comparable to the mid-term corrections in the third and fourth quarters of 2024 and the second quarter of 2025, and all below the 5% threshold.
As long as the unrealized loss rate remains within this range, the market can be classified as a "mild bear market," characterized by orderly revaluation rather than panic selling. However, if the correction intensifies and causes the rate to exceed 10%, it could trigger widespread capitulation selling, signaling that the market has entered a more severe bear market phase.
Long-term holders continue to sell.
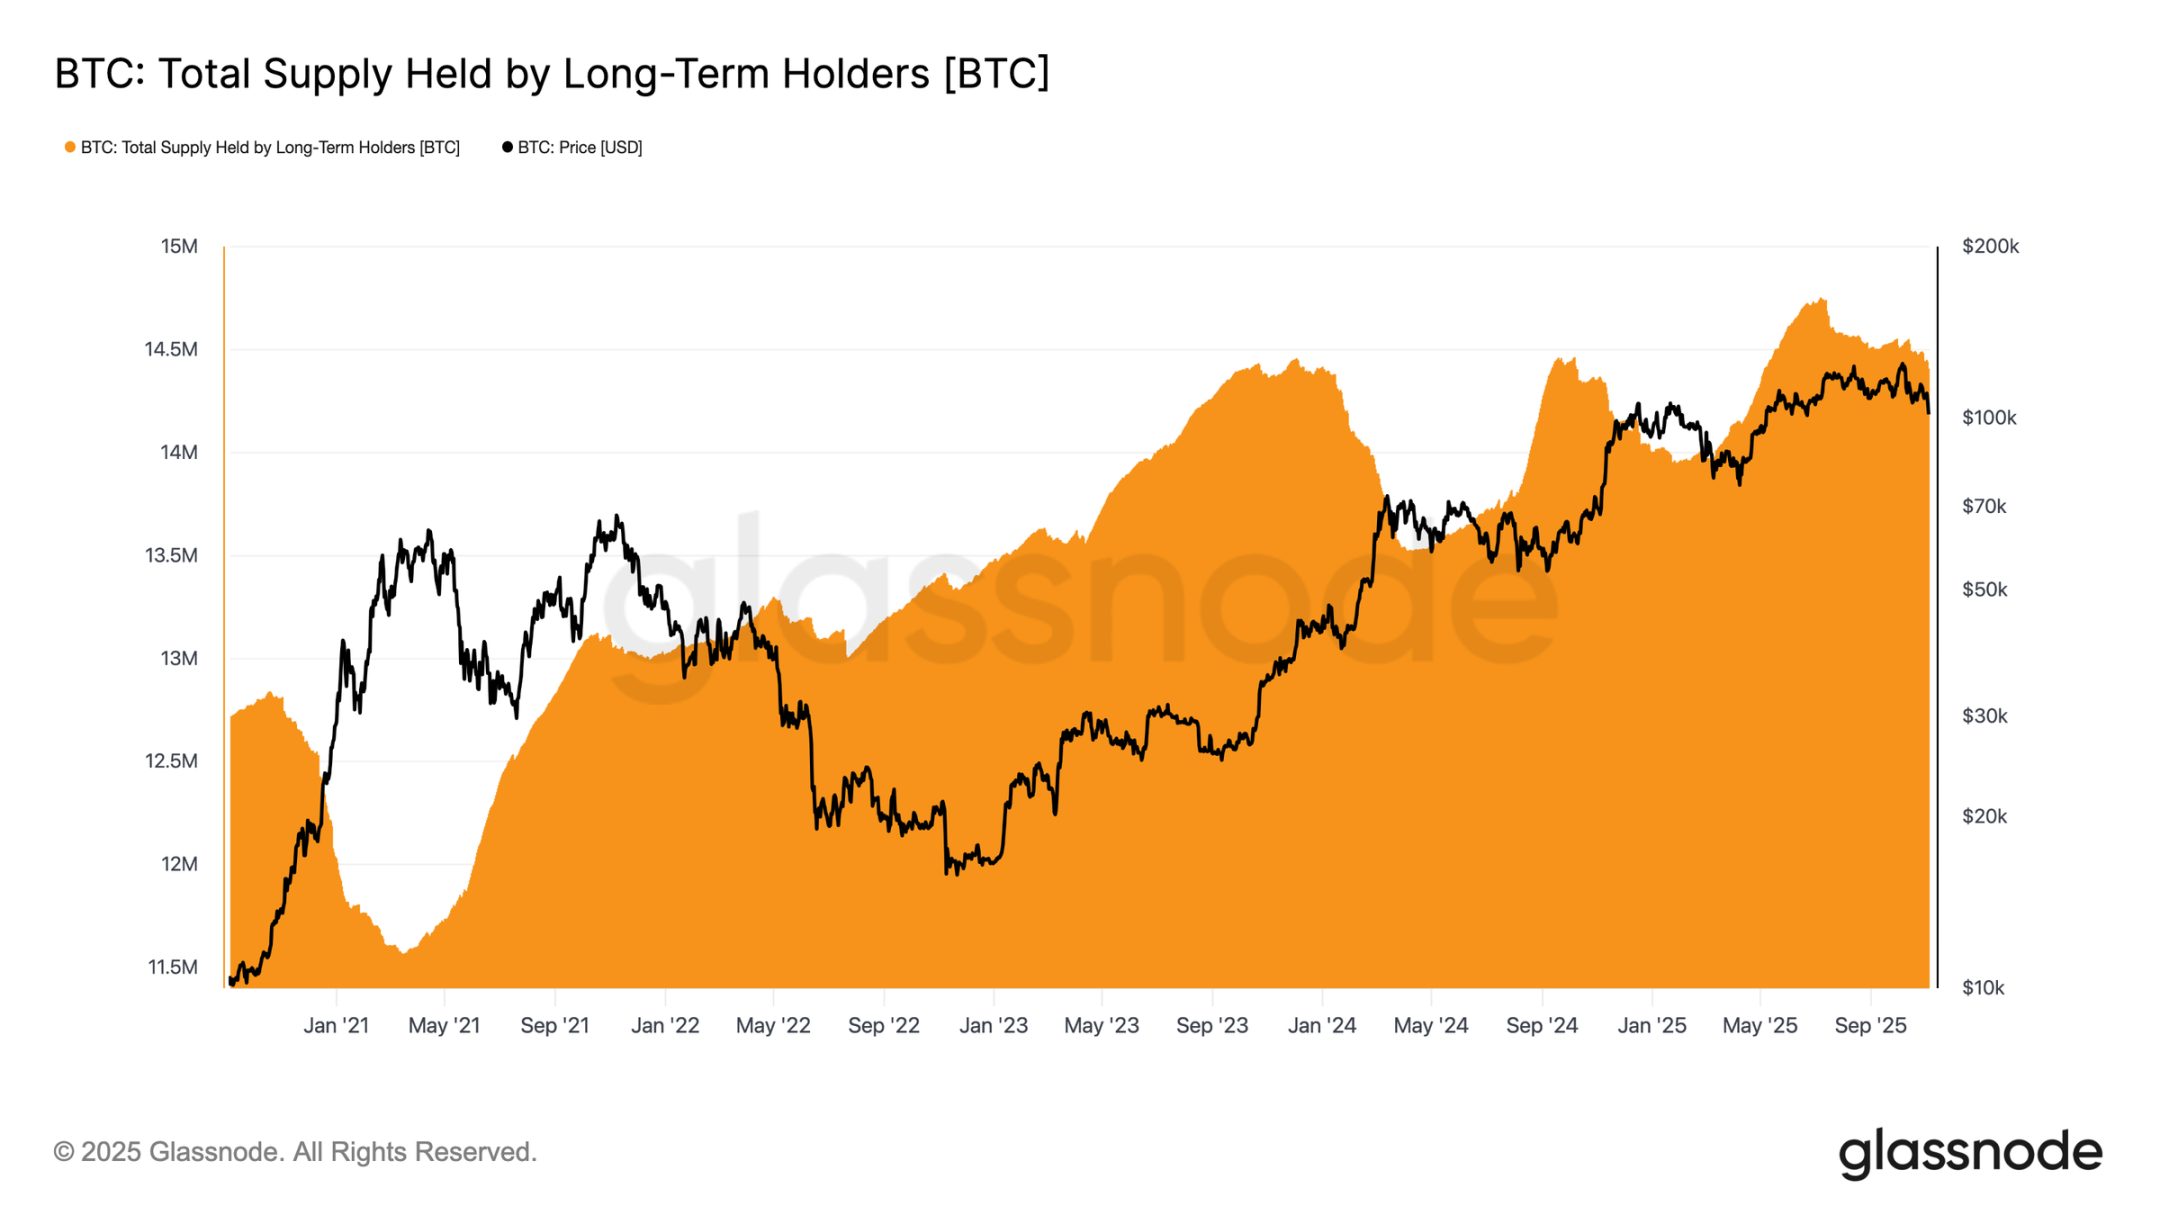
Despite relatively manageable losses and a mere 21% drop from its all-time high of $126,000, the market still faces mild but persistent selling pressure from long-term holders (LTH). This trend has been gradually emerging since July 2025, and even Bitcoin's new high in early October did not change this situation, surprising many investors.
During this period, long-term holders reduced their Bitcoin holdings by approximately 300,000 coins (from 14.7 million to 14.4 million). Unlike the selling wave earlier in this cycle, when long-term holders "sold on rallies," this time they chose to "sell on dips," reducing their holdings when prices consolidated and continued to decline. This shift in behavior suggests that experienced investors have become more weary and their confidence has waned.
Off-chain insights
Ammunition shortage: Demand from institutions cools down
Turning our attention to institutional demand: Over the past two weeks, inflows into US spot Bitcoin ETFs have slowed significantly, with a sustained net outflow of $150 million to $700 million per day. This contrasts sharply with the strong inflows from September to early October, which provided support for prices.
Recent trends indicate that institutional investors are becoming more cautious in their asset allocation, with profit-taking and a decline in the willingness to add new exposure dragging down overall buying pressure on ETFs. This cooling activity is closely related to overall price weakness, highlighting a decline in buyer confidence after months of accumulation.
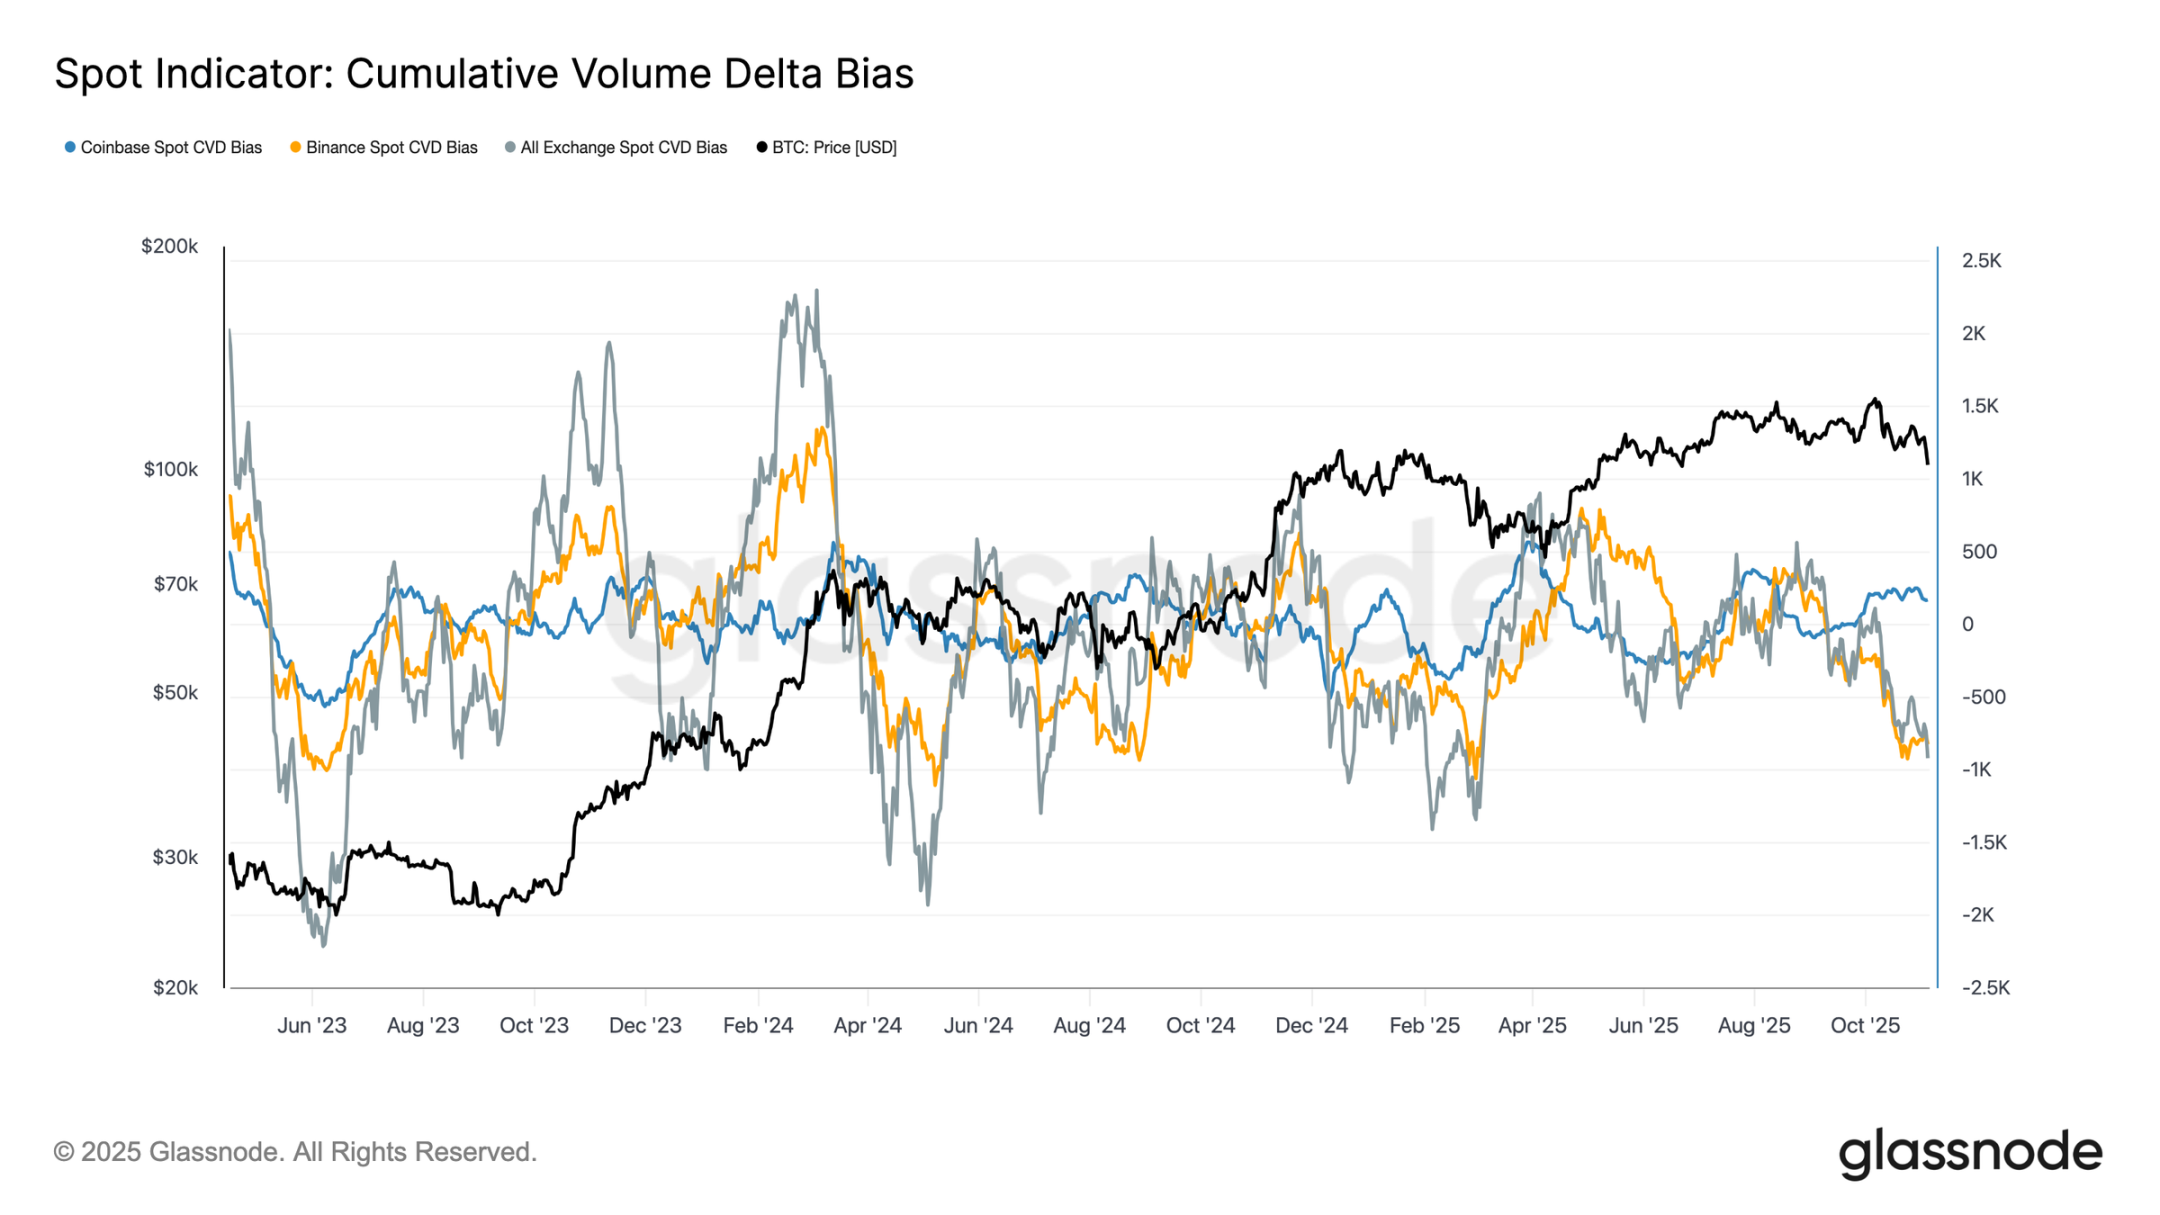
Clear bias: Weak spot demand
Over the past month, spot market activity has continued to weaken, with the cumulative volume difference (CVD) on major exchanges all trending downwards. Binance and the overall spot CVD have both turned negative, at -822 BTC and -917 BTC respectively, indicating continued selling pressure and limited buying activity. Coinbase is relatively neutral, with a CVD of +170 BTC, showing no obvious signs of buyer accumulation.
The deterioration in spot demand, coupled with a slowdown in ETF inflows, indicates declining confidence among individual investors. These signals collectively reinforce the cooling tone of the market: weak buying interest and rapid profit-taking amid a rebound.
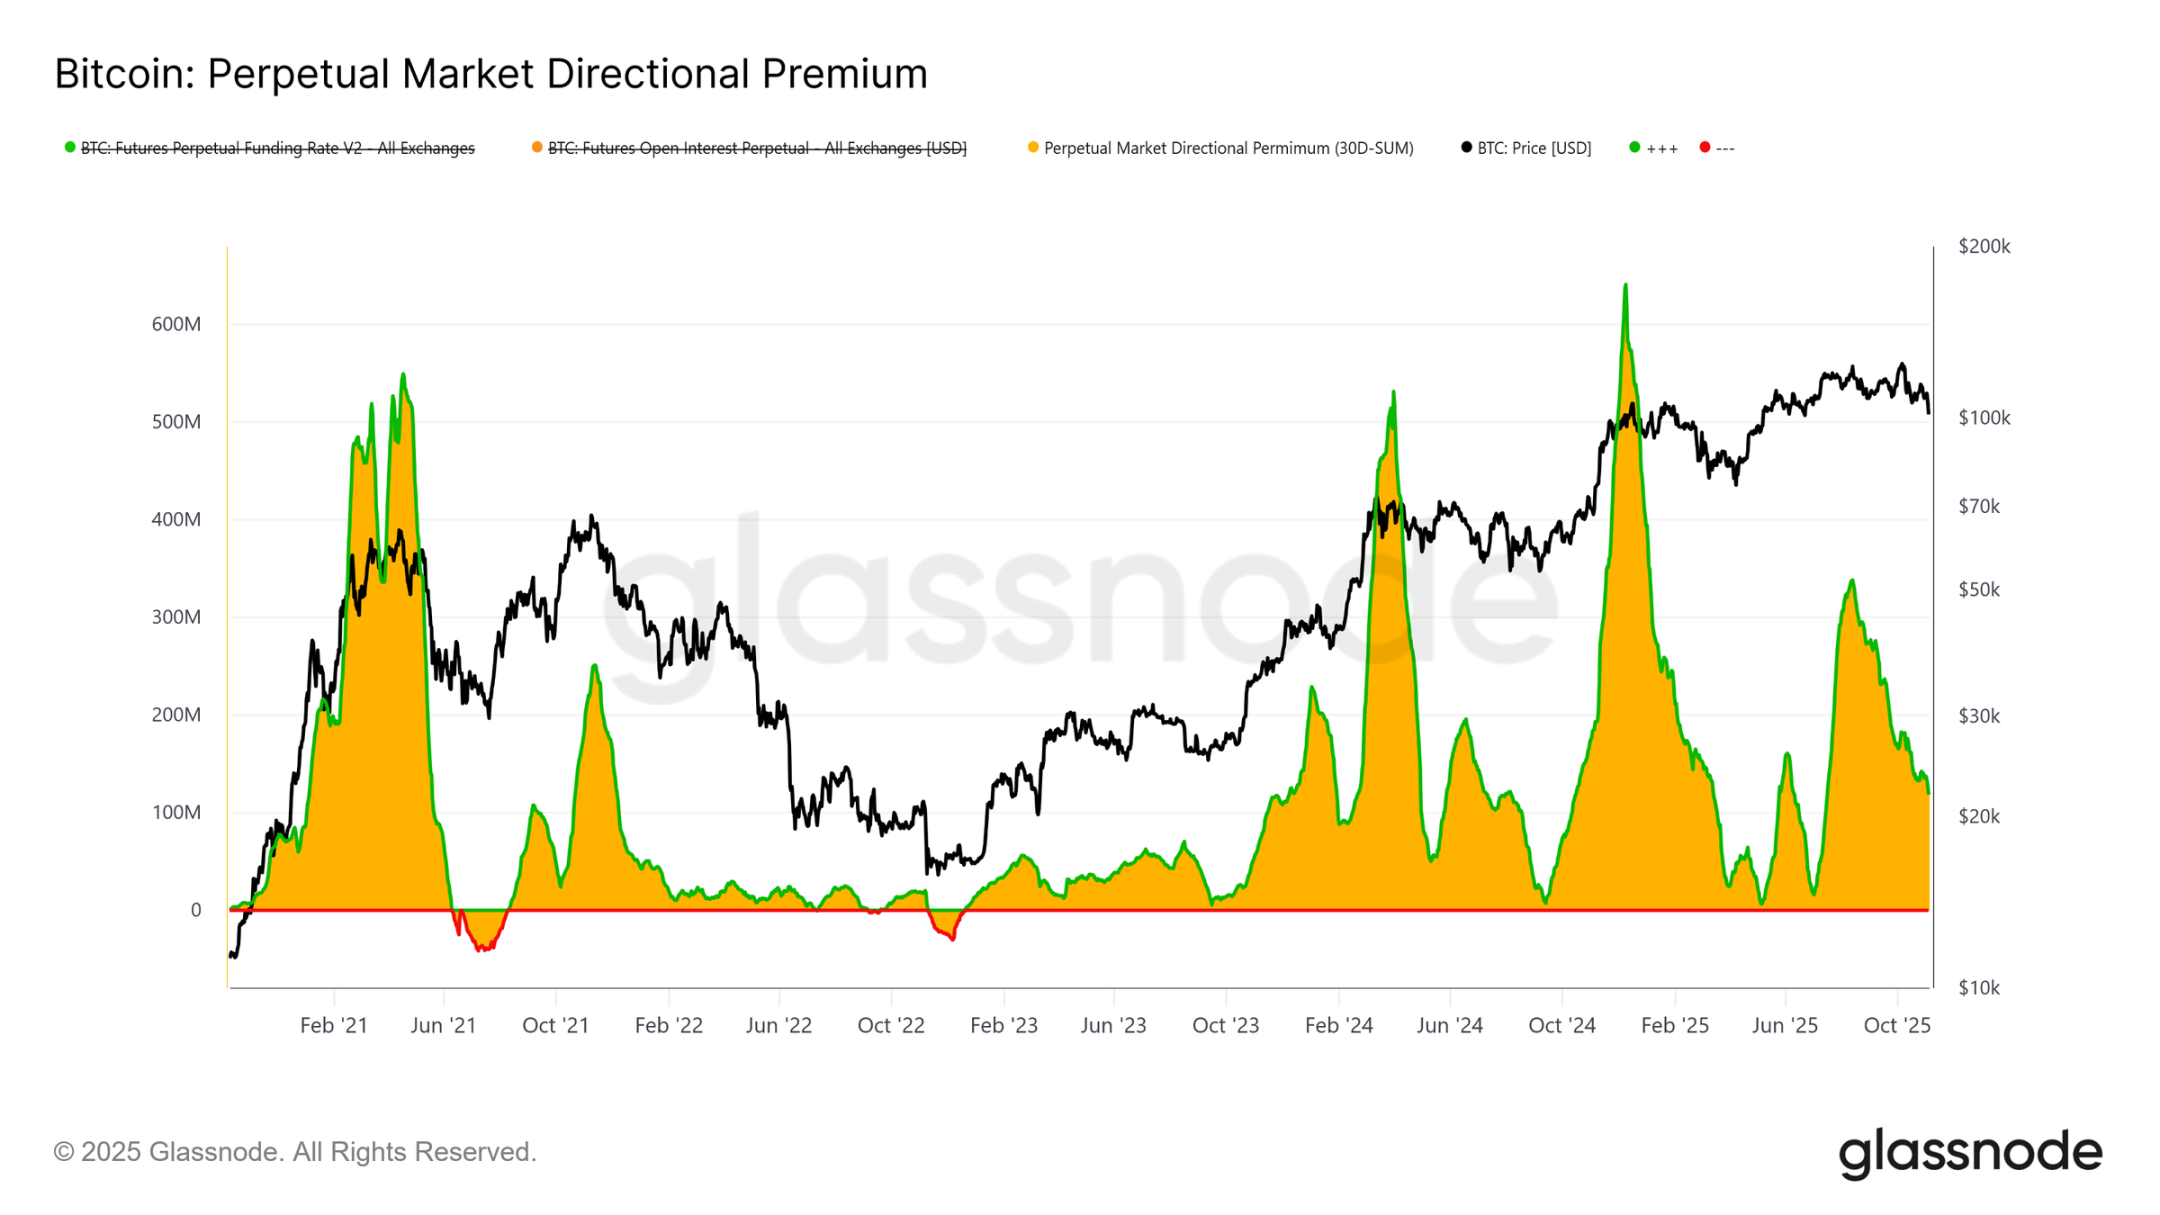
Declining Interest: Deleveraging in the Derivatives Market
In the derivatives market, the directional premium in perpetual contracts (i.e., the cost paid by long traders to maintain their positions) has fallen sharply from a peak of $338 million per month in April to approximately $118 million. This significant decline indicates widespread unwinding of speculative positions and a marked cooling of risk appetite.
Following a sustained period of high positive funding rates mid-year, the steady decline in this indicator suggests that traders are reducing directional leverage and favoring neutral rather than aggressive long exposures. This shift aligns with overall weakness in spot demand and ETF inflows, highlighting a transition in the perpetual contract market from an optimistic bias to a more cautious risk-averse stance.
Seeking protection: The options market is highly defensive.
As Bitcoin hovers near the psychological $100,000 mark, the options skew indicator unsurprisingly shows strong demand for put options. The data suggests that the options market is not betting on a reversal or "buying the dip," but rather paying high premiums to hedge against further downside risk. High put option prices at key support levels indicate that traders remain focused on risk protection rather than accumulating positions. In short, the market is hedging, not bottom-fishing.
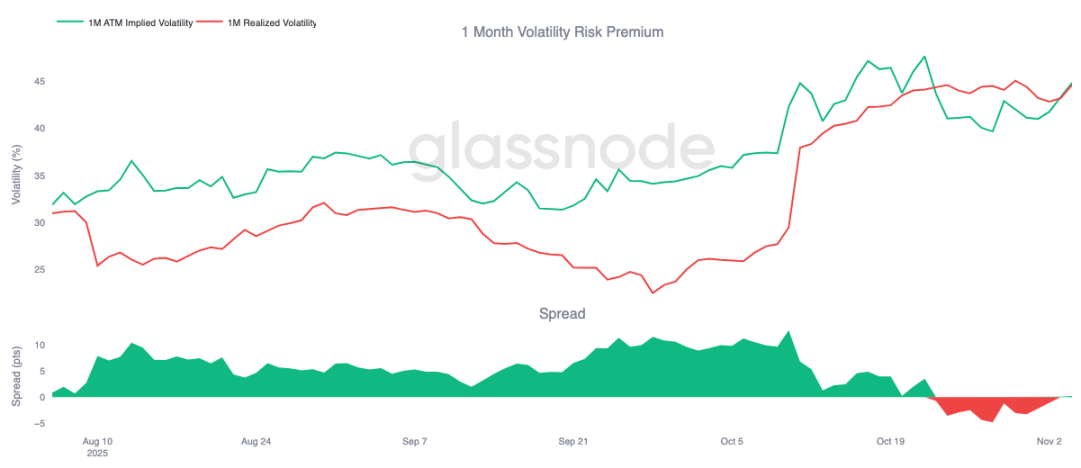
Risk premium rebounds
After ten consecutive days of negative values, the one-month volatility risk premium has turned slightly positive. As expected, this premium has reverted to the mean – implied volatility has been repriced higher after a difficult period for gamma sellers.
This shift reflects the market's continued dominance by cautious sentiment. Traders are willing to pay higher prices for protection, allowing market makers to intervene with opposing positions. Notably, when Bitcoin fell to $100,000, implied volatility rose in tandem with the re-establishment of defensive positions.
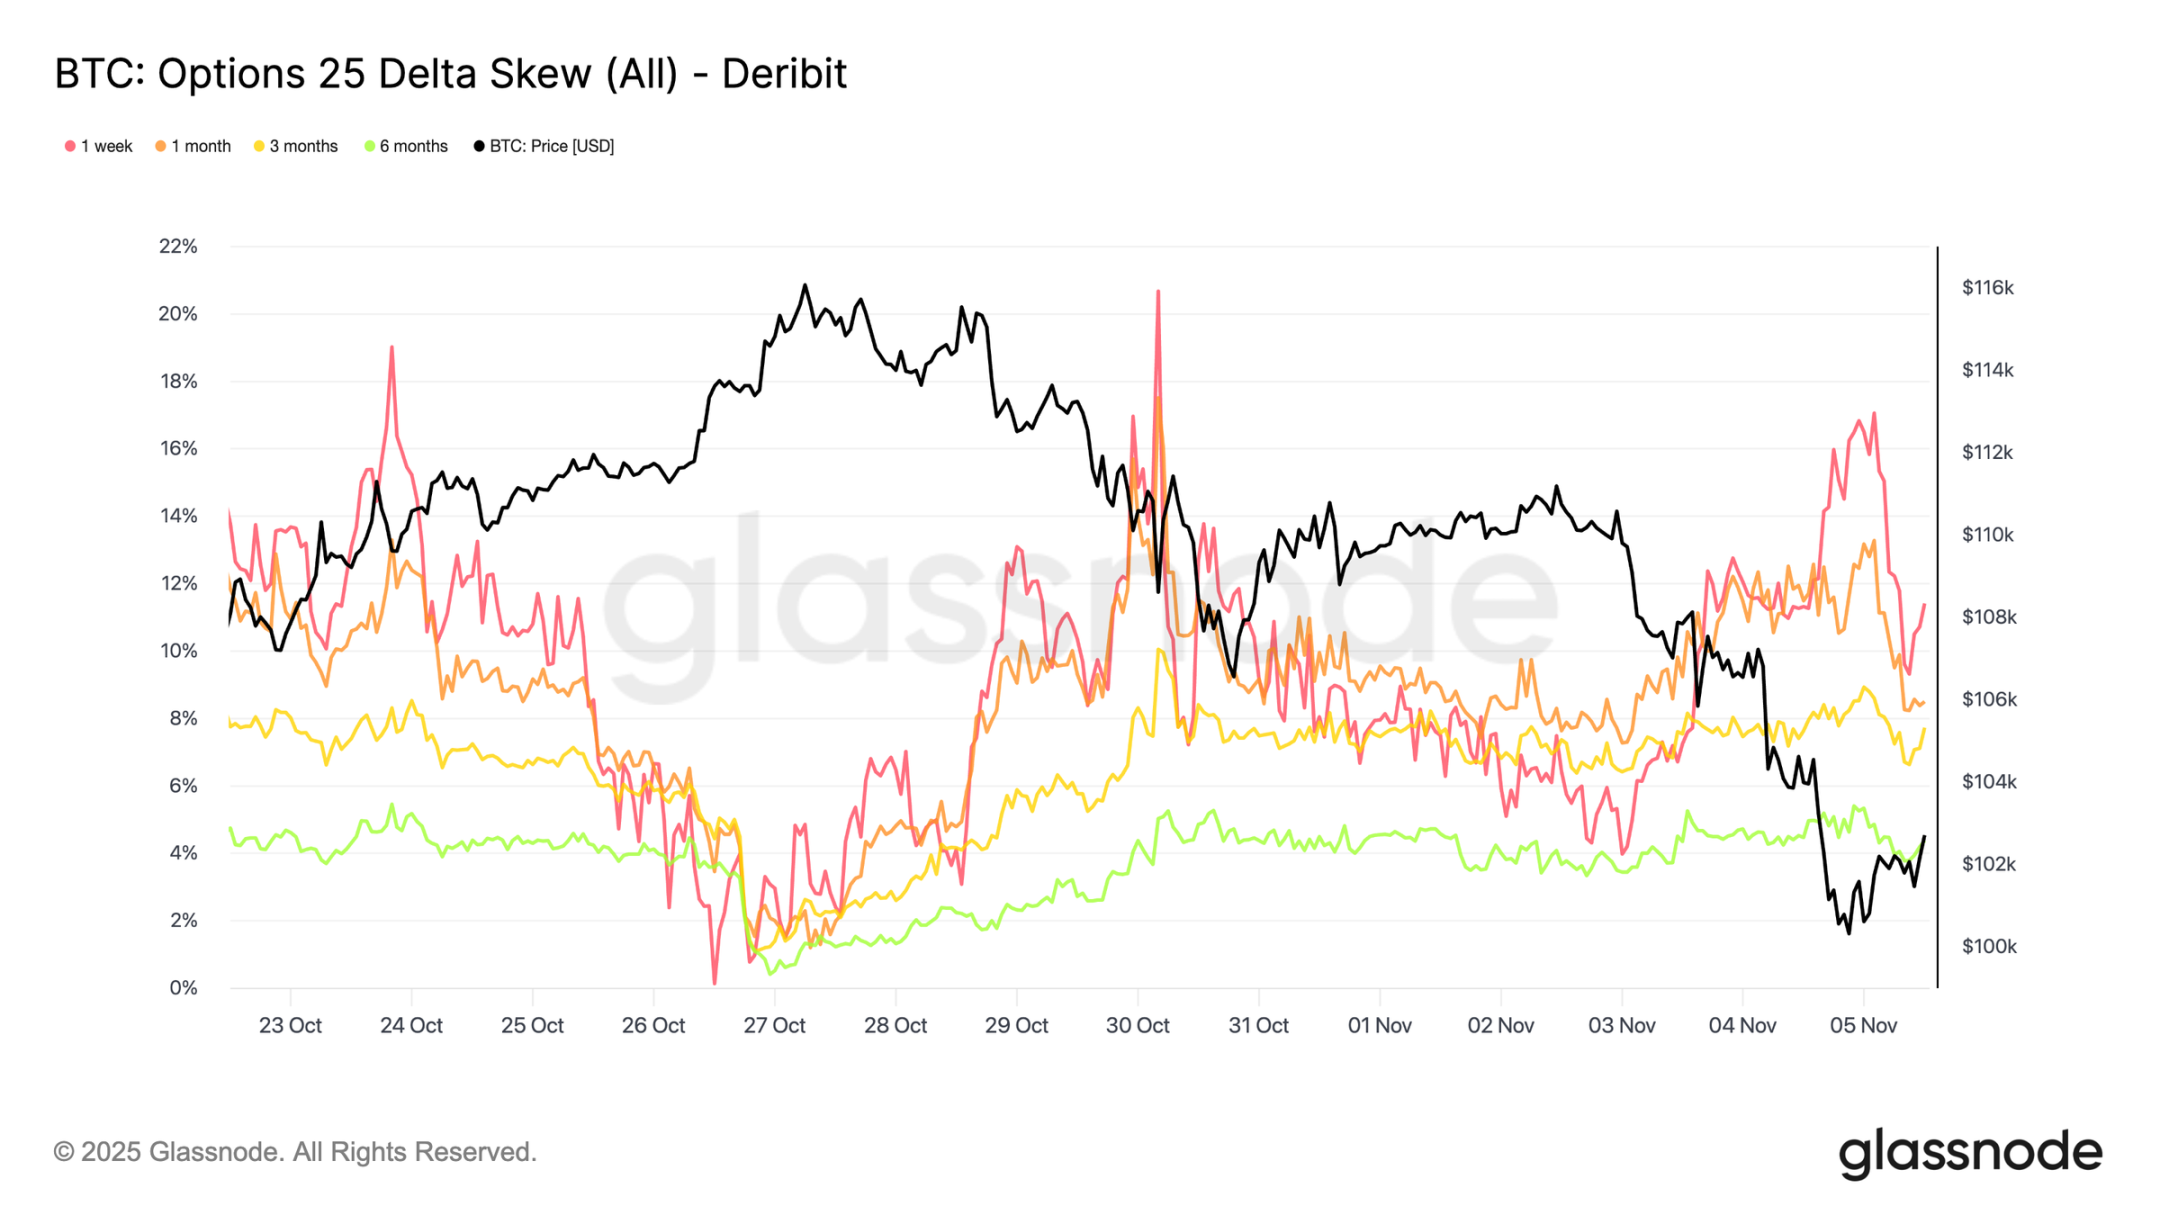
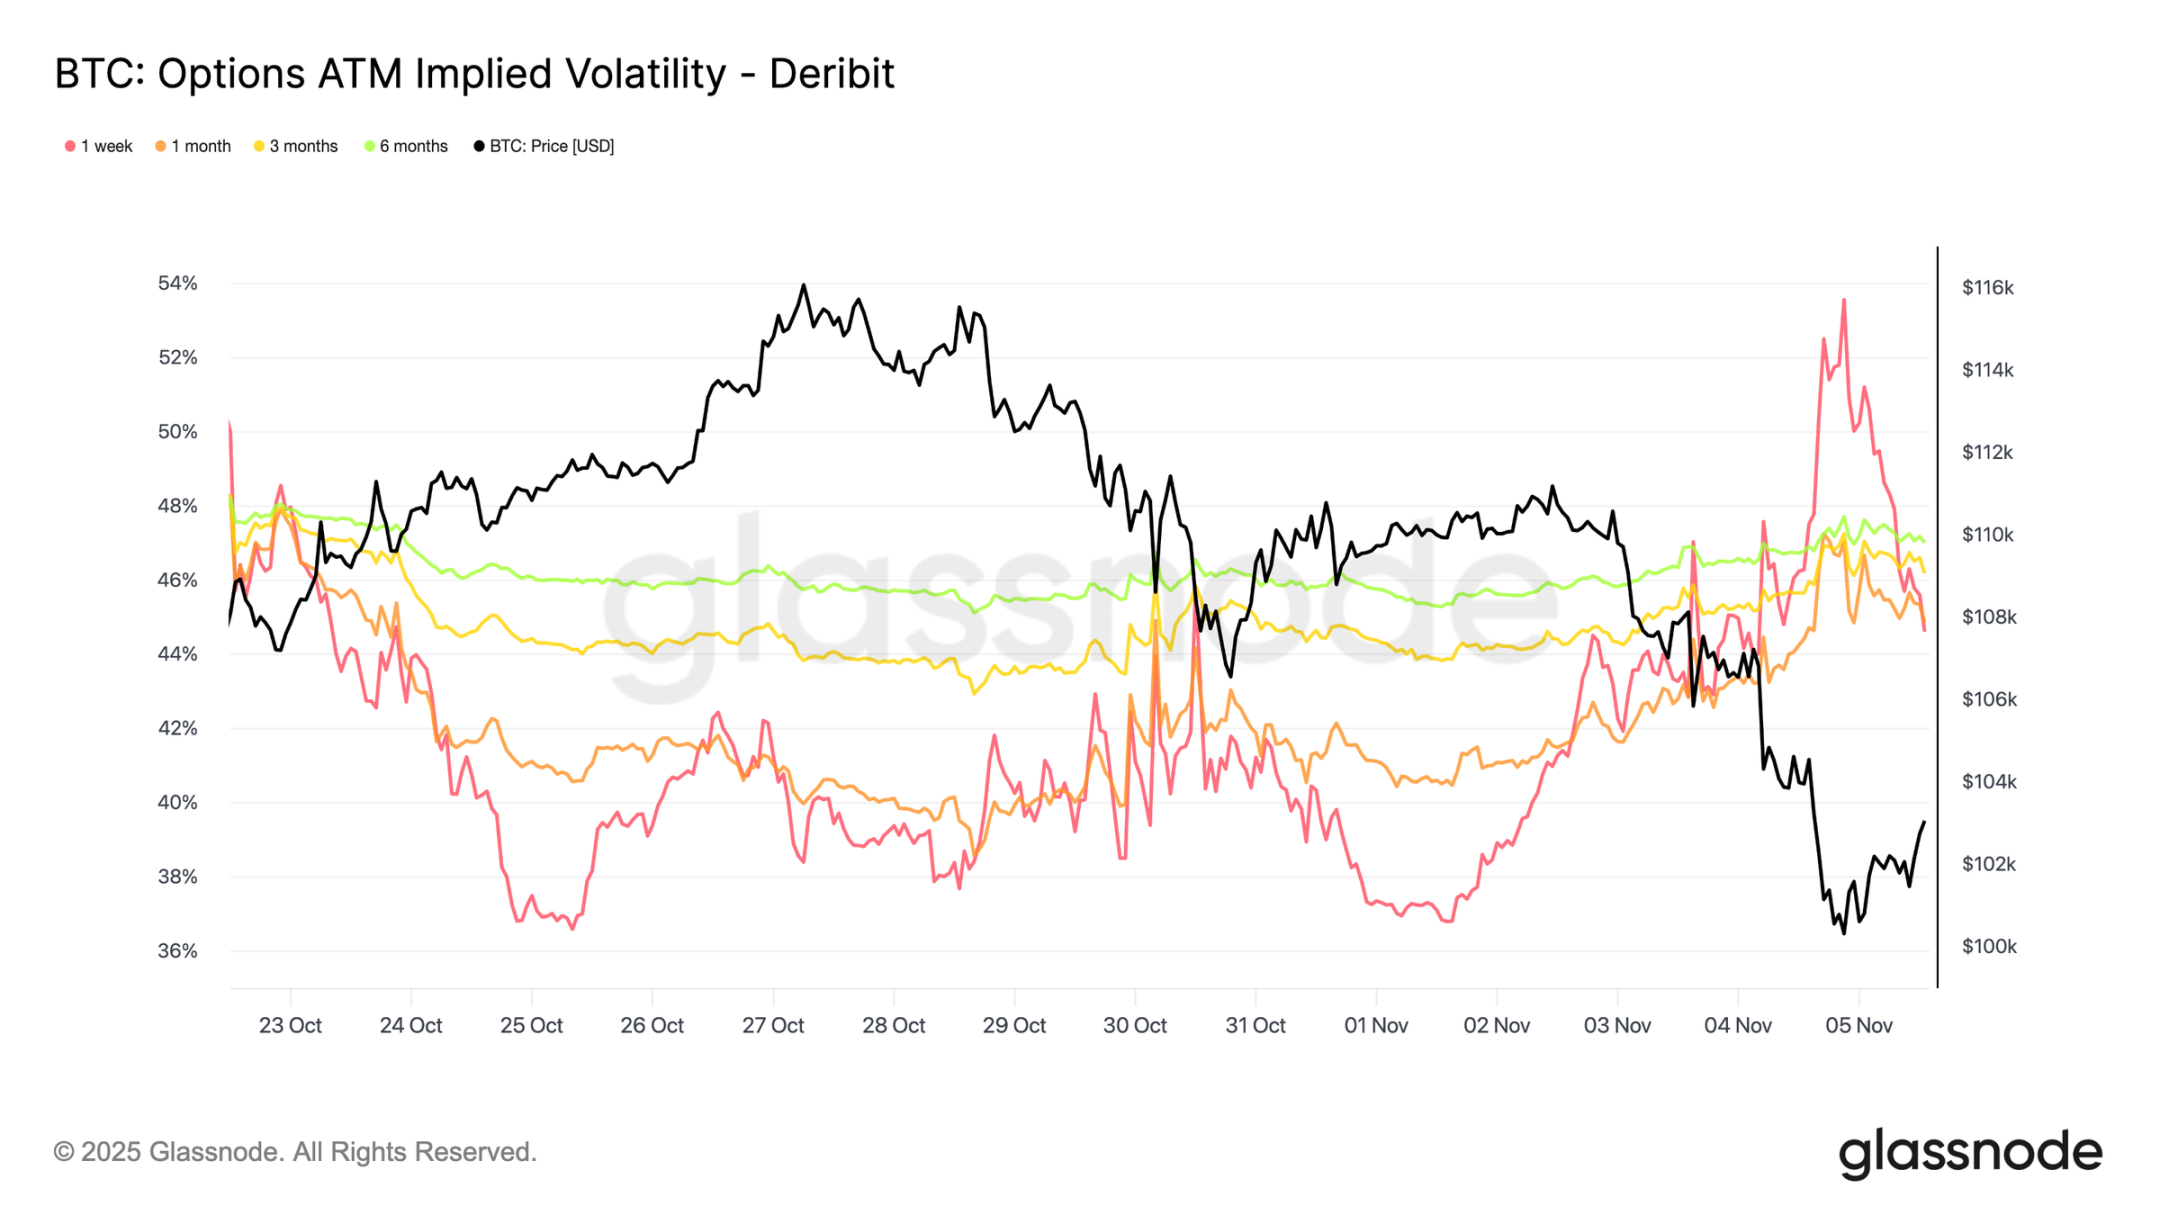
Volatility surged and then fell back
Short-term implied volatility remains closely negatively correlated with price movements. During the Bitcoin sell-off, volatility surged, with one-week implied volatility briefly reaching 54%, before finding support around $100,000 and falling back by about 10 volatility points.
Longer-term volatility also rose: one-month volatility increased by about 4 volatility points from pre-adjustment levels around $110,000, and six-month volatility increased by about 1.5 volatility points. This pattern highlights the classic "fear-volatility" relationship, where rapid price declines can still drive a surge in short-term volatility.
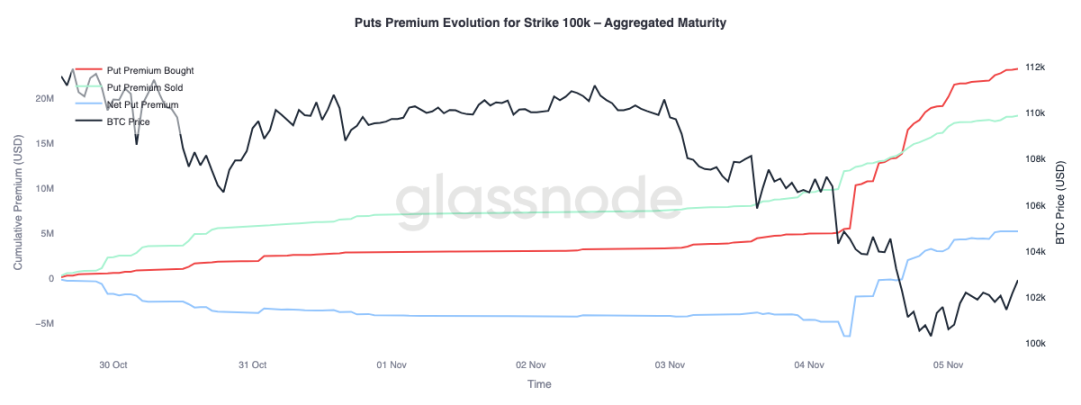
The defense of the $100,000 mark
Observing the put option premium at a strike price of $100,000 provides further insight into current sentiment. Over the past two weeks, the net put option premium has gradually increased, surging yesterday as concerns about a potential end to the bull market intensified. The put option premium spiked during the sell-off, remaining high even as Bitcoin stabilized near support levels. This trend confirms continued hedging activity, with traders still choosing protection rather than taking on new risk.
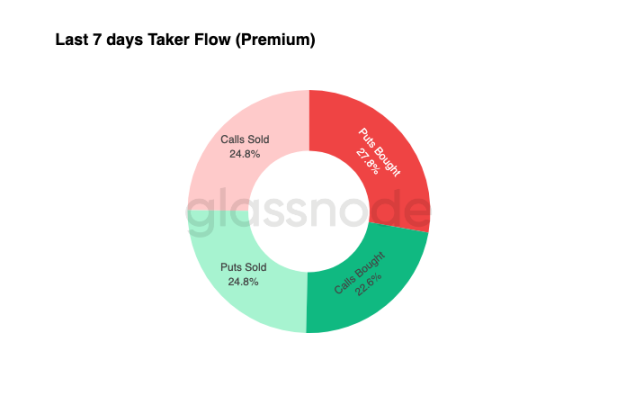
Funds flow towards defensive
Fund flow data over the past seven days shows that taker trading is dominated by negative delta positions—primarily achieved through buying put options and selling call options. There is still no clear bottoming signal in the past 24 hours. Market makers still hold long gamma positions, absorbing significant risk from profit-seeking traders and potentially profiting from two-way price fluctuations.
This pattern keeps volatility high but manageable, and the market maintains a cautious tone. Overall, the current environment favors defense over aggressive risk-taking, lacking clear upside catalysts. However, given the persistently high cost of downside protection, some traders may soon begin selling risk premiums to seek value investing opportunities.
in conclusion
Bitcoin's drop below the short-term holders' cost benchmark (approximately $112,500) and subsequent stabilization around $100,000 marks a decisive shift in market structure. Currently, this correction resembles previous mid-term slowdown phases: 71% of the supply (between 70% and 90%) remains profitable, and the relative unrealized loss rate is controlled at 3.1% (below 5%), indicating a mild bear market rather than a deep capitulation. However, the continued selling by long-term holders since July, along with outflows from ETFs, highlights weakening confidence among both retail and institutional investors.
If selling pressure persists, the active investor realization price (approximately $88,500) will be a key downside reference; while recovering the short-term holder cost benchmark would signal a renewed strengthening of demand. Meanwhile, the directional premium in the perpetual contract market and the CVD bias both indicate a decline in speculative leverage and spot market participation, reinforcing a risk-averse environment.
In the options market, strong demand for put options, a rising premium for $100,000 strike prices, and a slight rebound in implied volatility all confirm a defensive stance. Traders continue to prioritize protection over accumulation, reflecting hesitation about a potential "bottom."
Overall, the market is in a fragile equilibrium: oversold but not panicked, cautious but structurally sound. The next directional move will depend on whether new demand can absorb the continued selling by long-term holders and recover the $112,000-$113,000 range as solid support; or whether sellers will continue to dominate, extending the current downtrend.


