Original Title: Narrative Crypto vs Usable Crypto
Original article by: @0xnoveleader, Castle Labs; @BukovskiBuko3, The Big Whale
Original translation: Peggy, BlockBeats
Editor's Note:
The same week that S&P Global issued its first credit rating of "B-" to Strategy (formerly MicroStrategy), the discussion about digital treasury companies (DATs) entered a new phase. This rating symbolizes far more than just one company: it marks the first time that the Bitcoin treasury model has been incorporated into the mainstream credit assessment framework.
This is both an admission and a clash. S&P, examining Strategy using traditional financial logic, believes its structure of "assets in Bitcoin and liabilities in US dollars" presents a fundamental currency mismatch. Crypto advocates, however, insist this represents a paradigm shift for a new generation of "asset-based companies."
The DAT model connects risk, and potentially the future. It represents a middle ground between crypto and capital markets—neither entirely within the "cryptosphere" nor the "stock market." Strategy was rated "junk," but in a sense, this marked the first time a digital asset treasury was eligible for a rating. In the future, how traditional rating agencies quantify Bitcoin's risks and how investors perceive the "crypto Berkshire Hathaway" will determine whether DATs can move from speculative narratives to become integral to the financial landscape.
The following is the original text:
introduction
Digital Asset Treasuries (DATs) are increasingly becoming a mechanism for attracting traditional finance (TradFi) attention to blue-chip crypto assets like $BTC and $ETH. We are experiencing a wave of DAT projects whose core concept is to accumulate digital assets as core assets in corporate treasuries.
The DAT model offers investors exposure to crypto assets similar to stocks—instead of purchasing cryptocurrencies directly, investors buy shares in companies that hold crypto assets. This model can also be considered a "crypto asset wrapper," freeing investors from the complexities of self-custody and the risks of data breaches and social engineering attacks that come with exchanges.
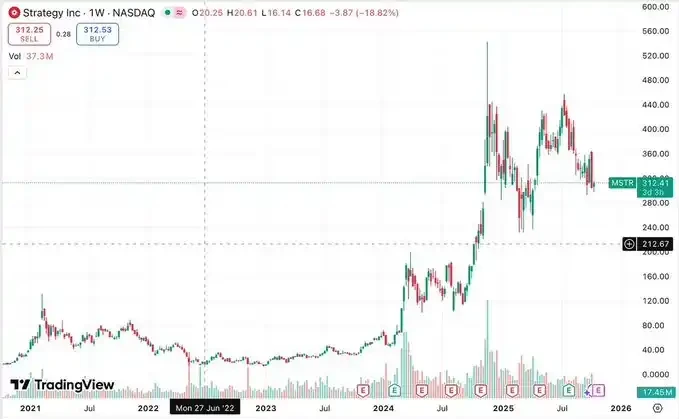
The most representative DAT currently is Strategy (formerly @MicroStrategy), which holds approximately 640,000 bitcoins, representing 3% of the total Bitcoin supply. With Strategy's success and the surge in the price of its stock ($MSTR), this model has become highly attractive to other companies. They can leverage margin to purchase crypto assets, thereby driving changes in per-share asset backing and sparking market speculation on their net asset value multiples (mNAV) and premiums/discounts.
This article aims to provide an in-depth analysis of DAT’s operating mechanism, key indicators, current market landscape, participating companies, potential risks, and ultimately assess its long-term sustainability.
What are DATs and how do they work?
The term DAT (Direct Access Transaction) was coined with the transformation of Strategy, a software company providing business analytics services. Strategy transitioned to a DAT in August 2020, and its stock price has since risen by over 2,000%. While this was partly due to the company becoming the first publicly listed company to acquire a significant amount of Bitcoin, it also validated the viability of the DAT model as a business opportunity.
At its core, DATs serve as "asset accumulation tools for equity financing," raising capital through stock issuance and purchasing crypto assets, thereby increasing the crypto asset exposure on a company's balance sheet. Their valuation and operating metrics (such as NAV, mNAV, and premiums/discounts) are highly dependent on the price fluctuations of the assets they hold.
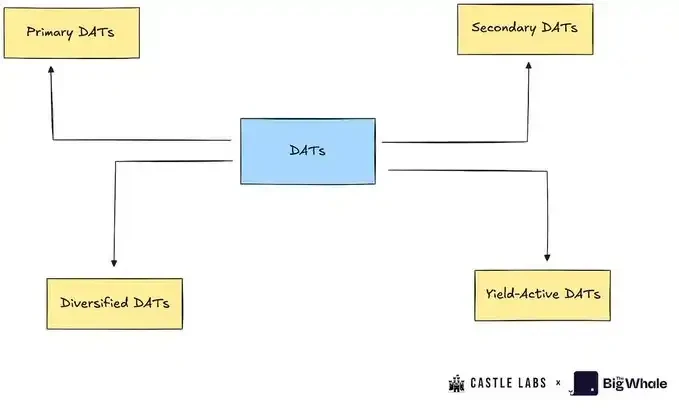
Digital treasury companies can be divided into the following categories:
1. Primary Digital Treasury Companies (Primary DATs): These are the most typical digital treasury companies, accumulating specific assets (such as BTC or ETH) through equity financing. Representative companies include Strategy and BitMine.
Secondary Digital Treasury Companies (DATs): These companies don't fully adopt the DAT model, but instead leverage other businesses to support their stock price and diversify their exposure to digital assets. These companies generate revenue from their primary business and use a portion of that revenue to accumulate crypto assets. Representative companies include Tesla, Galaxy, and MARA.
3. Yield-Active DATs: These companies aim to generate income from their crypto assets. For example, Sharplink stakes most of its ETH and earns staking income from it.
4. Diversified Digital Assets (DATs): These companies continue to accumulate crypto assets, but rather than focusing on a single asset, they hold multiple assets. Representative companies include Nepute Digital Assets Corp (holding BTC, ETH, SOL) and BTCS Inc (holding ETH, ADA, SOL).
Although this report will not strictly distinguish between these different types of digital treasury companies, it will select several of them as cases for in-depth analysis.
DAT Key Terms Analysis
To better understand the working mechanism of DAT, this section will introduce a series of key terms, which are important indicators to judge the health status of a DAT.
Net Asset Value (NAV): This refers to the net value of the DAT treasury, calculated by multiplying the number of assets in the treasury by their USD price. For example, a DAT holding 10,000 BTC (at $114,000 per BTC) would have a NAV of $1.14 billion.
Net asset value per share (NAVps): NAV divided by the company's total diluted shares outstanding. This metric reflects the expected value of each share. If the market price is higher than NAVps, the company's stock is trading at a premium; otherwise, it's trading at a discount.
Crypto Per Share (CPS): The number of units of a cryptocurrency represented by each share. It measures the amount of BTC, ETH, or other asset per share.
Market-to-Net Asset Value (mNAV): The ratio of a company's market capitalization to its net asset value. If mNAV is greater than 1.0, the stock is trading at a premium to its vault value (investors are paying a premium for crypto exposure, leverage, or options). If mNAV is less than 1.0, it indicates a discount due to market skepticism, governance risks, or insufficient disclosure.
Accretion/Dilution Test: A secondary offering is beneficial to investors (accretive) only if the amount of crypto assets purchased by the newly issued shares is higher than the current CPS. The formula is as follows: ΔUΔS>US\frac{ΔU}{ΔS} > \frac{U}{S}ΔSΔU>SU
in:
ΔU: Amount of newly purchased crypto assets
ΔS: Number of newly issued shares
U: The current number of crypto assets held
S: Current number of outstanding shares
For example, a company plans to raise $1 billion. Currently trading at a 40% premium (mNAV = 1.4), its treasury holds 200,000 BTC (NAV = $22 billion), and there are 20 million shares outstanding, with a total market capitalization of $30.8 billion. At a price of $1,540 per share, the company would need to issue approximately 650,000 shares to raise the capital.
After the financing, the company purchased 9,000 BTC at $110,000 per BTC, bringing the total treasury holdings to 209,000. The original CPS was 200,000/20,000,000 = 0.01, while the new CPS is 209,000/20,650,000 = 0.0101, indicating that this financing round has slightly increased the value of the fund for investors.
DAT’s financing mechanism
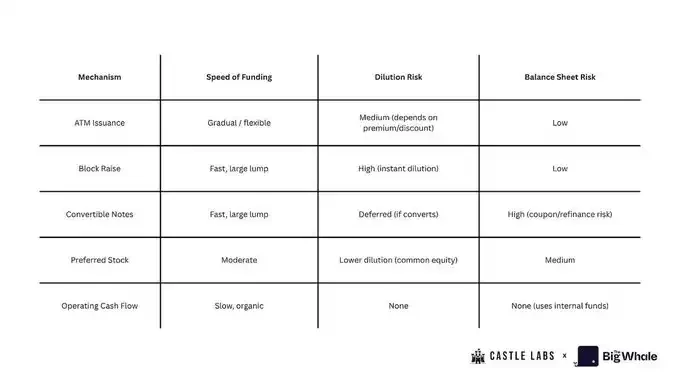
The DAT can fund its treasury in a variety of ways, including:
1. Market Issuance (ATM Issuance)
The company established an ATM issuance program with an investment bank to gradually sell shares in the market and use the proceeds to purchase crypto assets. This method is suitable for situations where the stock price is higher than the NAV. It is a flexible and low-friction financing tool, but excessive use can lead to shareholder dilution.
2. Block Raises / Secondaries
A company issues a large number of shares at once and sells them to investors at a price slightly below the market price to fund large crypto asset purchases. This method can quickly replenish coffers but may cause short-term dilution.
3. Convertible Notes
A company issues bonds with a fixed interest rate, maturity date, and conversion clause (convertible into stock at a set price in the future). This method allows for raising capital without immediately diluting shareholders. However, if the stock price rises and remains above the conversion price for a prolonged period, the company may require the debt to be converted into equity, resulting in dilution. If the stock price falls, the debt remains debt, subject to repayment or refinancing risk.
4. Preferred Stock
Companies raise capital by issuing preferred stock. Preferred stock confers superior dividend and liquidation rights over common stock and may come with fixed dividends, conversion rights, or special rights. This method offers lower financing costs than common stock, but creates a "senior equity" structure, which reduces the upside potential for common shareholders.
5. Operating Cash Flow (OCF)
Instead of issuing new shares or bonds, the company uses part of its operating profits to purchase crypto assets. This is the most sustainable and least dilutive way to build treasury, but it accumulates more slowly.
Current DAT Landscape
Growing institutional interest in digital assets has spawned a diverse group of DATs, all attempting to capitalize on one of the most significant market narratives of 2025. Initially focused on Bitcoin, the DAT model has rapidly evolved to encompass other mainstream public blockchain assets, such as Ethereum and Solana. The management teams of nearly all DATs are focused on improving the core metric of "cryptocurrency unit per share."
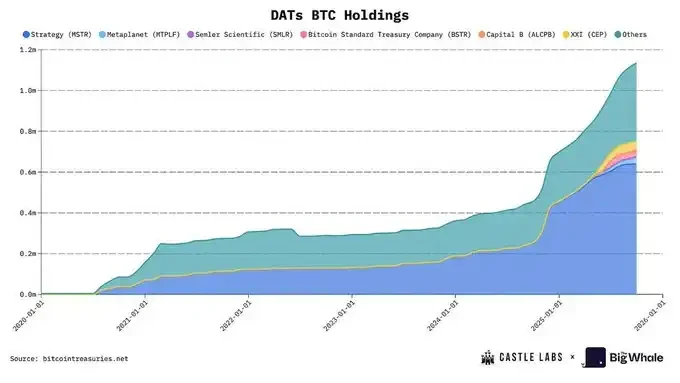
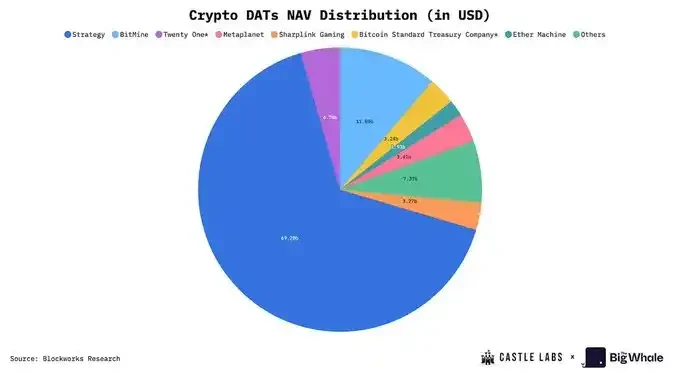
The DATs analyzed in this section represent the publicly listed companies with the highest market capitalization across various crypto assets. Strategy and Metaplanet together hold 64% of the total assets under management (AUM) of all BTC DATs, with Strategy alone holding 61.22%.
In terms of ETH DAT companies, @BitMNR holds 49.66% of the total AUM of ETH DAT, while Sharplink holds 14.72%. This shows that early adopters dominate both the BTC and ETH markets.
Strategy first proposed the DAT concept in 2020. It took four and a half years for the market to gradually enter the mainstream stage. Now, new competitors have emerged in the BTC (Metaplanet) and ETH (Bitmine and Sharplink) fields.
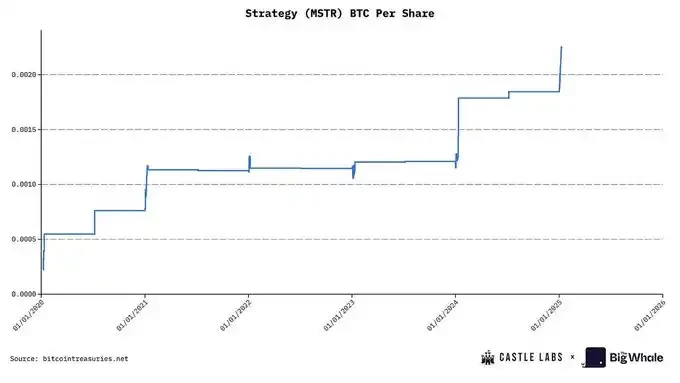
Strategy, a pioneer in this field, continues to accumulate Bitcoin. Over the past five years, the company has held a total of 640,250 BTC, with a NAV of approximately $70 billion at current prices. In 2025 alone, the company acquired 116,554 BTC, achieving a 26% increase in BTC holdings.
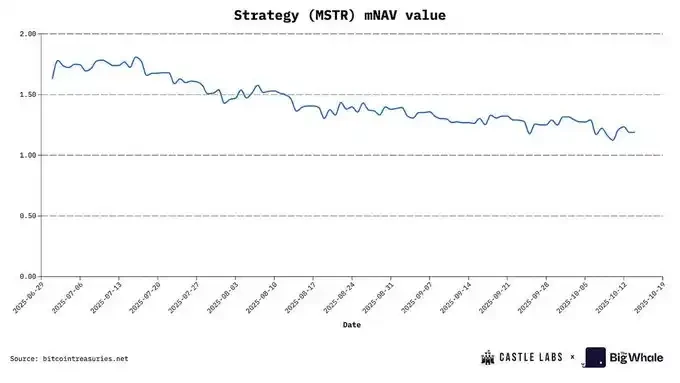
Looking at the timeline, Strategy primarily uses the ATM model to purchase Bitcoin. Early on, it sold shares at a premium of up to 6x, then gradually fell back to the 2.5x–3x range. It is currently stabilizing at an mNAV level below 1.5x, currently at 1.16x basic NAV and 1.293x diluted mNAV.
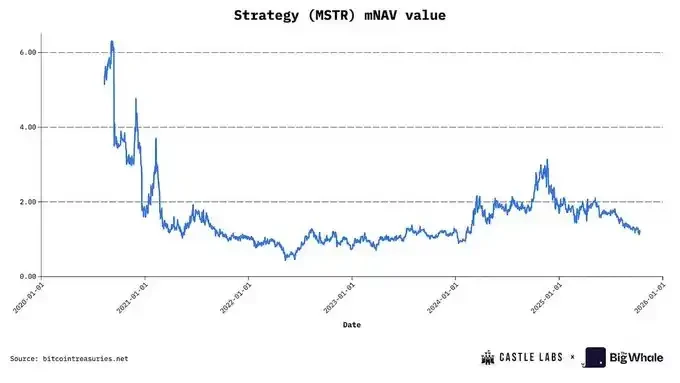
MSTR's mNAV premium data source: BITCOINTREASURIES.NET
Currently, the most mainstream financing tools are preferred stocks and convertible bonds, which are favored by hedge funds and institutional investors to hedge the impact of continued equity dilution while maintaining the continuous accumulation of BTC.
Thanks to its first-mover advantage and the widespread recognition of global stock market investors (almost entering the S&P 500 index), Strategy has become an industry benchmark, even "too big to be compared." This also means it carries a huge responsibility: a failure could cause a structural impact on confidence in the stock market and digital assets.
Another significant BTC DAT company is @Metaplanet_JP from Japan. Originally a hotel operator, the company currently holds over 30,823 BTC. It acquires BTC at a significant premium to its NAV, reaching as high as 8x at one point this year. This means that for every $1 in BTC held, it generates $8 in financing. This high premium is partly due to its listing on the Tokyo Stock Exchange. Compared to the Nikkei Index, Metaplanet's higher volatility provides Bitcoin exposure to the average Japanese stock market investor.
Now let’s take a look at the development of ETH DAT.
BitMine, originally a Bitcoin mining company specializing in immersion-cooled data centers, transitioned to an ETH vault in July 2025. Sharplink, a sports betting marketing technology company, is the second-largest ETH DAT. Together, these two companies hold over 3.87 million ETH, valued at over $15 billion. Their earnings per share (EPS) are 189.1% of BitMine's and 98.5% of Sharplink's, respectively.
Similar to Metaplanet, these two companies also favor an ATM equity financing strategy, selling shares when a premium exists. This allows them to raise capital efficiently without relying on dilutive block offerings or debt financing, thereby increasing the value of each unit of cryptoasset. Once the premium disappears and the mNAV falls below 1, dilution will occur, further reducing the value of each unit of cryptoasset. Sharplink's mNAV is currently 0.92x, a slight discount; BitMine's mNAV is 1.18, a premium of approximately 18%.
A major advantage of ETH DAT is the ability to earn native yield by staking ETH. This is an automated mechanism that increases the amount of ETH per share. Furthermore, staking rewards can be used to increase the annualized yield (APY), such as by investing in DeFi protocols or repurchasing shares. Sharplink is using this strategy to offset the dilution effect of ATM strategies.
With the exception of MSTR, most DAT companies are still in their early stages. Their aggressive capital raising reflects their desire to act quickly in a bull market and seize opportunities brought about by the convergence of equity and digital asset markets.
Risks of the DAT Model
The core characteristic attracting capital to DAT stocks is their "net asset value multiple" (mNAV). Speculators flock to these stocks, hoping to buy in before crypto prices rise and realize returns of 1.5x to 7x for every dollar invested. However, there's a key issue: investors aren't buying Bitcoin or Ethereum directly through these companies; rather, they're purchasing a "volatility wrapper," the entire value of which is determined by the DAT's current trading mNAV. Therefore, such investments carry significant risks, and market participants must remain vigilant.
One of the primary risks of the DAT model stems from its business mechanism for accumulating BTC and ETH. The factor most directly impacting stock price is ongoing equity dilution. From 2022 to the end of 2024, Strategy will dilute shareholders by an average of 45.88% annually; Metaplanet's dilution rate is projected to reach 98% by the end of this year. In comparison, BitMine and Sharplink also have very high dilution rates of 24.25% and 11.4%, respectively, primarily due to their use of the ATM model to acquire ETH. Sharplink's dilution rate is calculated quarterly (Q1 to Q2), while BitMine's is based on a fully diluted estimate of its $25 billion ATM program at the current stock price.
Due to negative operating cash flow (MSTR's operating cash flow in the second quarter was -$34 million, and Sharplink's was -$1.62 million), DAT companies often choose to purchase crypto assets through an ATM model. However, this method is effective only when the market is trading at a premium; if it reaches a discount, the company will be unable to maintain the pace of purchases, causing the price of each unit of crypto assets to stagnate, which in turn triggers further selling pressure from investors.
To avoid continued dilution, MSTR and other companies opted to raise capital through convertible bonds. These bonds are often purchased by hedge funds that employ a "delta-neutral" strategy because they have embedded OTM (out-of-the-money) options. These funds then establish short positions, creating sustained selling pressure.
At the same time, rising stock prices increase the value of the bond because the OTM option appreciates in value. The bond also carries a small annual coupon, further enhancing the return. As the stock price approaches the conversion price, the bond's delta increases, increasing its value.
On the contrary, when the stock price falls, the hedge fund can not only profit from the short position, but also because of the over-collateralization of BTC holdings and common stocks, the value of the bond will not fall rapidly, forming "option protection", that is, the convexity of the bond.

Ultimately, convertible bond holders are often reluctant to convert to equity: while holding the bonds, they maximize their BTC distribution rights in the event of a company bankruptcy and capitalize on volatility gains over the long term. Hedge funds ideally want to roll over the debt—as long as the realized volatility of the common stock is high enough to support significant price swings (requiring buy-side speculators), they will continue to hold the convertible bonds.
A third financing method is issuing preferred stock. This strategy, pioneered by Strategy, aims to mitigate dilution without significantly increasing debt. Preferred stock typically provides annual dividends, but since DATs often have negative or very low cash flows, this further erodes their profitability.
In addition, there are other risks that deserve attention, including insufficient treasury transparency, stock buyback execution risks (lack of revenue or liquidity), liquidity risks in emergency sales, and continued selling of stocks by company insiders, which together put huge pressure on stock prices.
We've seen significant market capitalization declines for these DAT stocks recently: MSTR is down 44%, and Metaplanet is down over 70%. These risks are fully priced in by the market, suggesting the DAT model may be losing momentum and explaining why DATs have underperformed their underlying crypto assets during the current bull market.
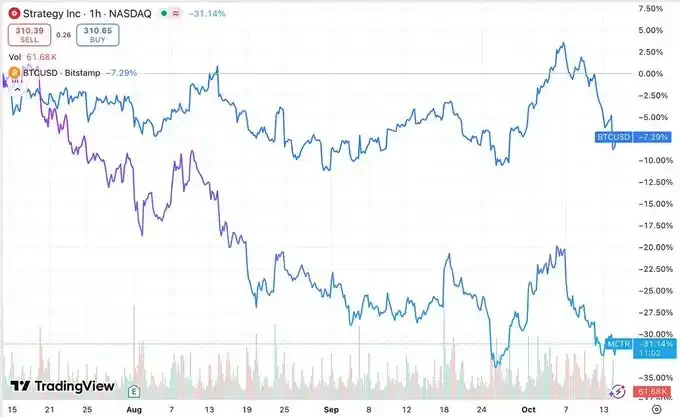
Strategy vs BTC performance in the last three months
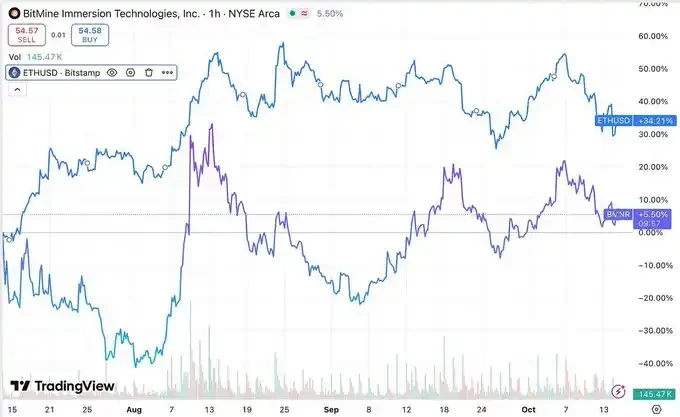
BitMine vs ETH performance in the last three months
Can DAT surpass BTC and ETH?
Using Ethereum as a treasury asset allows DAT companies to earn an annualized return of approximately 3.18% through staking, which helps improve the per-share ETH metric. However, even using the most mature DeFi protocols, it will take a long time for DATs to significantly increase their per-share ETH without additional capital injections, and this also introduces counterparty risk. While staking and yield farming can generate cash flow for ETH and other altcoin DATs, these returns are still limited at the current scale and are unlikely to provide substantial benefits. To truly build a self-sustaining ETH treasury flywheel, companies must accumulate sufficient funds to generate high enough returns to cover all expenses and increase shareholder value.
Whether yield-oriented DATs (such as ETH DATs) can outperform BTC DATs depends on market preference for the underlying assets. Currently, the market favors BTC DATs more strongly, especially MSTR, whose mNAV performance is more stable and stickier than BMNR and SBET.
The market has begun to price the risk in these assets, resulting in a significant gap between the performance of various DATs and BTC or ETH in Q3, with the underlying assets outperforming their equity wrappers.
Because DATs' core business model relies on acquiring underlying assets, their intrinsic value rarely exceeds the net value of their holdings. This, coupled with persistent operating cash flow losses, dividend pressure, and rising debt levels, is the primary reason for the continued decline in multiples for most DATs.
Before making an investment decision, investors often need to weigh the opportunity cost of allocating funds. The following is a simplified example that shows how this opportunity cost might look:
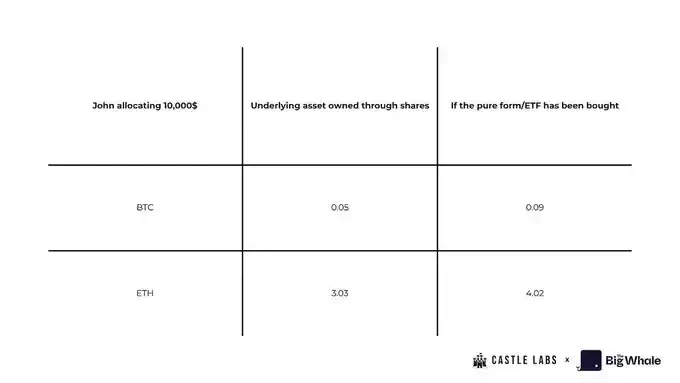
John plans to invest $10,000 and choose to directly purchase BTC and ETH spot or ETFs, or purchase MSTR or SBET shares at the end of Q2.
If John chooses to invest all $10,000 in spot trading, he will receive: approximately 0.093 BTC (based on the closing price of Q2); more than 4 ETH (based on the closing price of Q2)
If he instead purchased MSTR and SBET shares, he would receive: 24.61 shares of MSTR; 1,064.96 shares of SBET (based on the June 30th price)
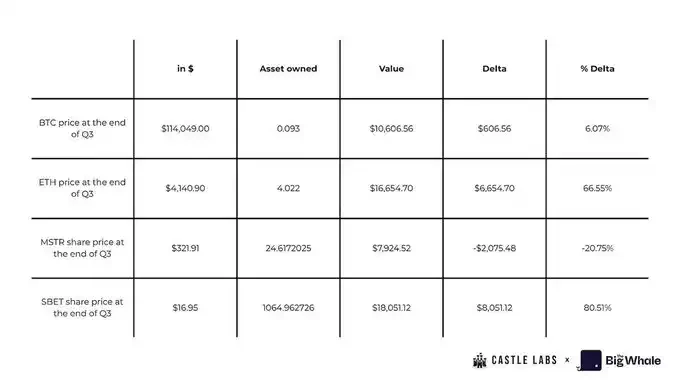
Multiplying the number of shares by the current BTC value per share, John would hold approximately 0.04 BTC less than if he had purchased the stock directly. At worst, he would only hold MSTR shares, not Bitcoin. Similarly, if he purchased SBET shares, he would hold a full 1 ETH less than if he had purchased the stock directly.
It's worth noting, however, that if John hadn't sold any shares at the end of Q3, he would have made a profit of approximately $8,000 on Sharplink stock, as its share price had risen 80%, outperforming both spot and ETF returns. On the other hand, his loss on MSTR stock would have been approximately -20.75%, representing a loss of his original portfolio value.
Not only is the opportunity cost of DATs high, but retail investors ultimately lack actual ownership of the underlying assets. In the event of bankruptcy, claims on the underlying assets revert to creditors and preferred shareholders. This raises serious questions about the sustainability of DATs as long-term investment vehicles.
However, there is still a differentiating factor that is attracting funds: DATs offer the possibility of amplified returns and are more speculative than holding spot or ETFs, as shown by the performance of Sharplink stock from Q2 to Q3.
While DAT's earnings may look good under FASB accounting rules (which allow unrealized gains to be included in profits), these gains are still marked to market and only translate into free cash flow once the assets are sold. In other words, these gains are simply changes in the value of assets on paper and cannot be converted into actual cash unless they are liquidated.
In theory, these issues could be mitigated if companies could use excess cash to borrow or generate stable income through options contracts. However, each protocol integration increases counterparty risk, raising questions about whether this is worthwhile. The market generally believes that if these companies begin selling their holdings, it would be a fatal blow to shareholder confidence.
Sustainability Assessment
While there is no perfect set of evaluation metrics that can cope with the volatility of digital asset prices, this section will introduce several key indicators for comprehensively evaluating the performance of DATs.
We will use Strategy (MSTR) as an example to illustrate how to evaluate and score. Each indicator is scored on a scale of 0–5:
Score ≥ 4: Good performance on this indicator
Score = 3: Moderate performance on this indicator
Score ≤ 2: This indicator performs poorly
Score = 0: The indicator performs very poorly
1. Dilution Risk
Dilution risk arises when the issuance of new shares affects the crypto asset units (CPS) held by existing shareholders. If the CPS after the issuance is lower than the current CPS, it is dilution; otherwise, it is appreciation.
The way to assess dilution risk is to track the changes in CPS and compare the CPS values before and after financing.
MSTR: This strategy frequently uses ATM equity issuance and convertible bonds to finance Bitcoin acquisitions. Because MSTR typically issues equity when its stock is trading at a premium (mNAV > 1), this can be considered "accretive dilution." However, its reliance on ongoing financing places its dilution risk at a low to medium level. Therefore, we assign it a score of 3.
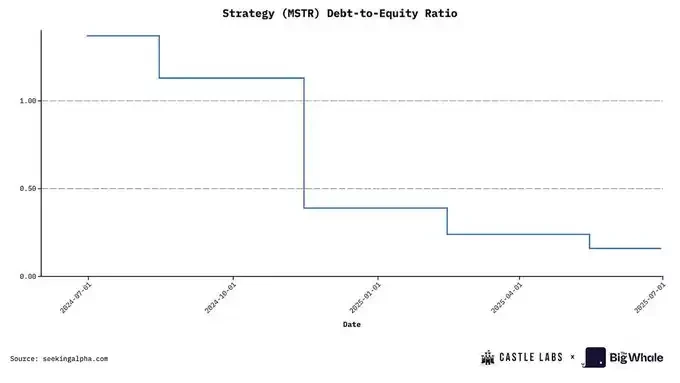
2. Leverage
The key to assessing a DAT’s leverage level is to track the debt instruments it uses to purchase digital assets, including convertible bonds, mortgages, or other similar financing methods.
The commonly used indicator for measuring leverage is the debt-to-equity ratio, which is used to determine the impact of a sharp decline in treasury assets on a company's leverage level and whether it may trigger a liquidity crisis.
MSTR: Strategy's current debt-to-equity ratio is 0.36, which is at a historical low and falls into the low leverage category, so we give it a score of 4.
3. Choice of Underlying Asset
The quality of the crypto assets held by a DAT is key to its ability to align with investor interests. Most DATs revolve around blue-chip assets such as BTC, ETH, and SOL.
The advantage of ETH lies in its sustainable yield, which can be used to support company operations or expand treasury size. Cryptocurrency per unit (CPS) is also a key metric. For example, the current annualized yield on ETH staking is approximately 3%. If a DAT holds $1 billion in ETH, it could earn approximately $30 million in additional annual income simply through staking. Companies can also choose to participate in more attractive income opportunities such as lending or liquidity provision, but this also introduces counterparty risk, a problem faced by Solana DAT.
In contrast, BTC lacks the ability to generate returns. Its appeal stems primarily from its position as "digital gold"—its limited supply and monetary properties. The increasing number of companies adding BTC to their balance sheets reflects its growing importance as an asset.
MSTR: The strategy holds BTC. While its status as an asset is rising, it currently lacks a significant income mechanism (this may improve in the future). Therefore, we classify it as medium and give it a score of 3.
4. Multiplier to NAV Ratio (mNAV)
mNAV is one of the simplest and most effective metrics for assessing the status of a DAT and is calculated as the company's market capitalization divided by its treasury net asset value (NAV).
MSTR: Strategy's current market capitalization is $82.3 billion, with a NAV of approximately $70 billion, a basic mNAV of 1.16, and a diluted mNAV of 1.25.
Based on the base mNAV value, we can score as follows: mNAV > 1.2: score 4 or 5 (good performance); 1.0 < mNAV < 1.2: score 3 (moderate performance); 0.8 < mNAV < 1.0: score 1 or 2 (poor performance); mNAV < 0.8: score 0 (very poor performance)
Therefore, Strategy scores 3 on this metric.
5. Treasury Transparency and Governance
This is a more qualitative indicator used to assess the quality and frequency of a company's treasury disclosures, proof of reserves, audit history, etc. Whether a company provides a public address for tracking is also an important reference.
Some companies avoid disclosing their addresses because it could lead to front-running: DAT purchases could drive up asset prices, which could then be exploited by the market.
MSTR: Strategy maintains limited transparency regarding its reserve proof, a topic often criticized by the market. Furthermore, its governance structure is complex, involving various instruments such as preferred stock and convertible bonds. Therefore, we assign it a score of 2.
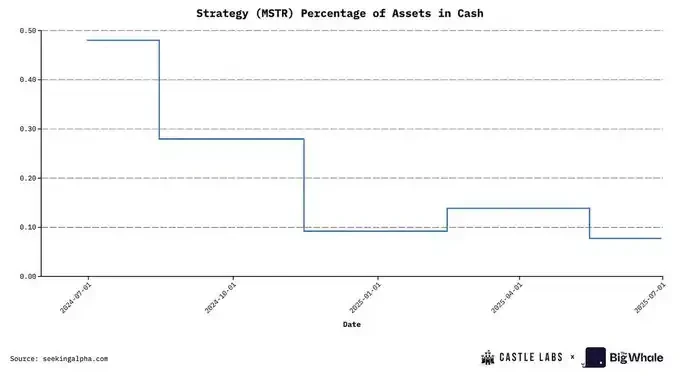
6. Liquidity and Cash Runway
This is a quantitative indicator used to analyze a company's current cash flow situation and whether it needs to sell crypto assets to maintain operations if problems arise.
The evaluation method is to divide the company's monthly operating expenses by its cash holdings to determine its cash flow. It is good practice to have at least one year's cash flow.
MSTR: Strategy's current cash assets only account for 0.07% of the company's total assets. The cash ratio is extremely low, so we give it a score of 1.
To help readers more clearly understand the overall performance of DAT, we have included six key indicators in the evaluation chart, including: dilution risk, leverage level, treasury asset quality, net asset value multiple (mNAV), transparency and governance, and cash flow sustainability.
Remember: the higher the score, the better the DAT performs on that metric (e.g., a higher leverage score indicates lower debt levels and stronger performance).
Taking Strategy as an example, its average score in the above six dimensions is 2.83 points (out of 5 points).

Conclusion
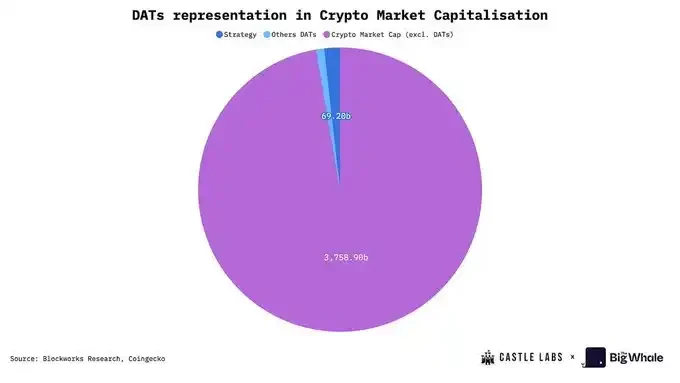
DATs have made significant progress in the industry, currently accumulating a net asset value (NAV) of approximately $108 billion, representing approximately 2.5% of the total cryptocurrency market capitalization. This figure alone is impressive, and the largest participant, Strategy, holds 3% of the global Bitcoin supply. Beyond these figures, the DAT model itself is highly attractive. As an "equity-driven asset accumulation tool," it allows traders and institutions to gain exposure to crypto assets without directly holding or trading them. Its core principle is to arbitrage the premium or discount of a company's stock.
Today, DATs have expanded beyond Bitcoin and Ethereum to include other mainstream public blockchain assets like @Solana. These new assets provide DATs with greater leverage, such as generating returns through DeFi. These returns can be used for company operations or to improve business metrics. For example, staking ETH can increase the company's ETH holdings in its treasury, thereby increasing the value of each ETH share, a highly valued metric for investors when evaluating stocks.
DAT's growth and key business metrics are highly dependent on the price performance of the digital assets it holds. Its mNAV could decline significantly during periods of heightened market volatility.
Ultimately, the surge in DATs and NAV reflects growing interest in digital assets from both institutional and retail investors, which is a positive sign for the industry as a whole. However, any investor participating in these assets should fully understand the potential risks, as outlined in this report.
- 核心观点:数字资产财库公司连接加密与资本市场。
- 关键要素:
- Strategy持有64万枚比特币。
- DAT提供股权化加密资产敞口。
- 标普首次对比特币财库评级。
- 市场影响:推动机构采用数字资产新模式。
- 时效性标注:中期影响