Drawdown, liquidation, and recovery: a 4-year cycle of revelations for US stocks, A-shares, and Crypto
- 核心观点:危机回撤是周期重启起点。
- 关键要素:
- 2021年流动性泛滥推高资产泡沫。
- 2022-2023年暴力出清市场杠杆。
- 2023-2025年AI与降息驱动分化复苏。
- 市场影响:强化跨市场周期认知与资产配置。
- 时效性标注:长期影响。
How do you view cycles and retracements?
If you have been in the Crypto market for a long time and have experienced extreme stress tests such as "9.4", "3.12", "5.19" and the latest "10.11", you will probably come to an iron rule: every crisis and pullback is often the starting point for the cycle to restart.
Although the time scale of Crypto is still too short and the fluctuations are more intense, if we observe it side by side with the two behemoths of US stocks and A-shares, we will find a commonality in the market - from the peak of the bubble, to the violent liquidation, and then to the differentiated recovery, the cyclical script is always repeated.
The past four years are a prime example. Global assets began retreating from their peak in October 2021, then gradually recovered amid the AI wave and new interest rate cycle from 2023 to 2025. Today, U.S. stocks and Crypto have regained their highs, and A-shares are also hovering on the threshold of recovery.
It can be said that the past four years have been a stress test for global capital flows, risk pricing, and market psychology. Today, we will try to approach this from the perspective of "retracement" and deeply deconstruct this vivid "market cycle lesson."
1. Cross-market cycle lesson: Drawdown is never a distant story
“In the long run, we are all dead” — Keynes.
But in the capital market, what everyone is most obsessed with is still the long-term macro narrative: the cycle.
Taking the Crypto market as an example, over the past decade, Bitcoin has almost formed a "four-year cycle" pattern recognized by the market, including an upward trend of about 3 years, followed by about 1 year of adjustment and clearing, and then the start of the next cycle. So far, such a cycle has been fully played out four times.
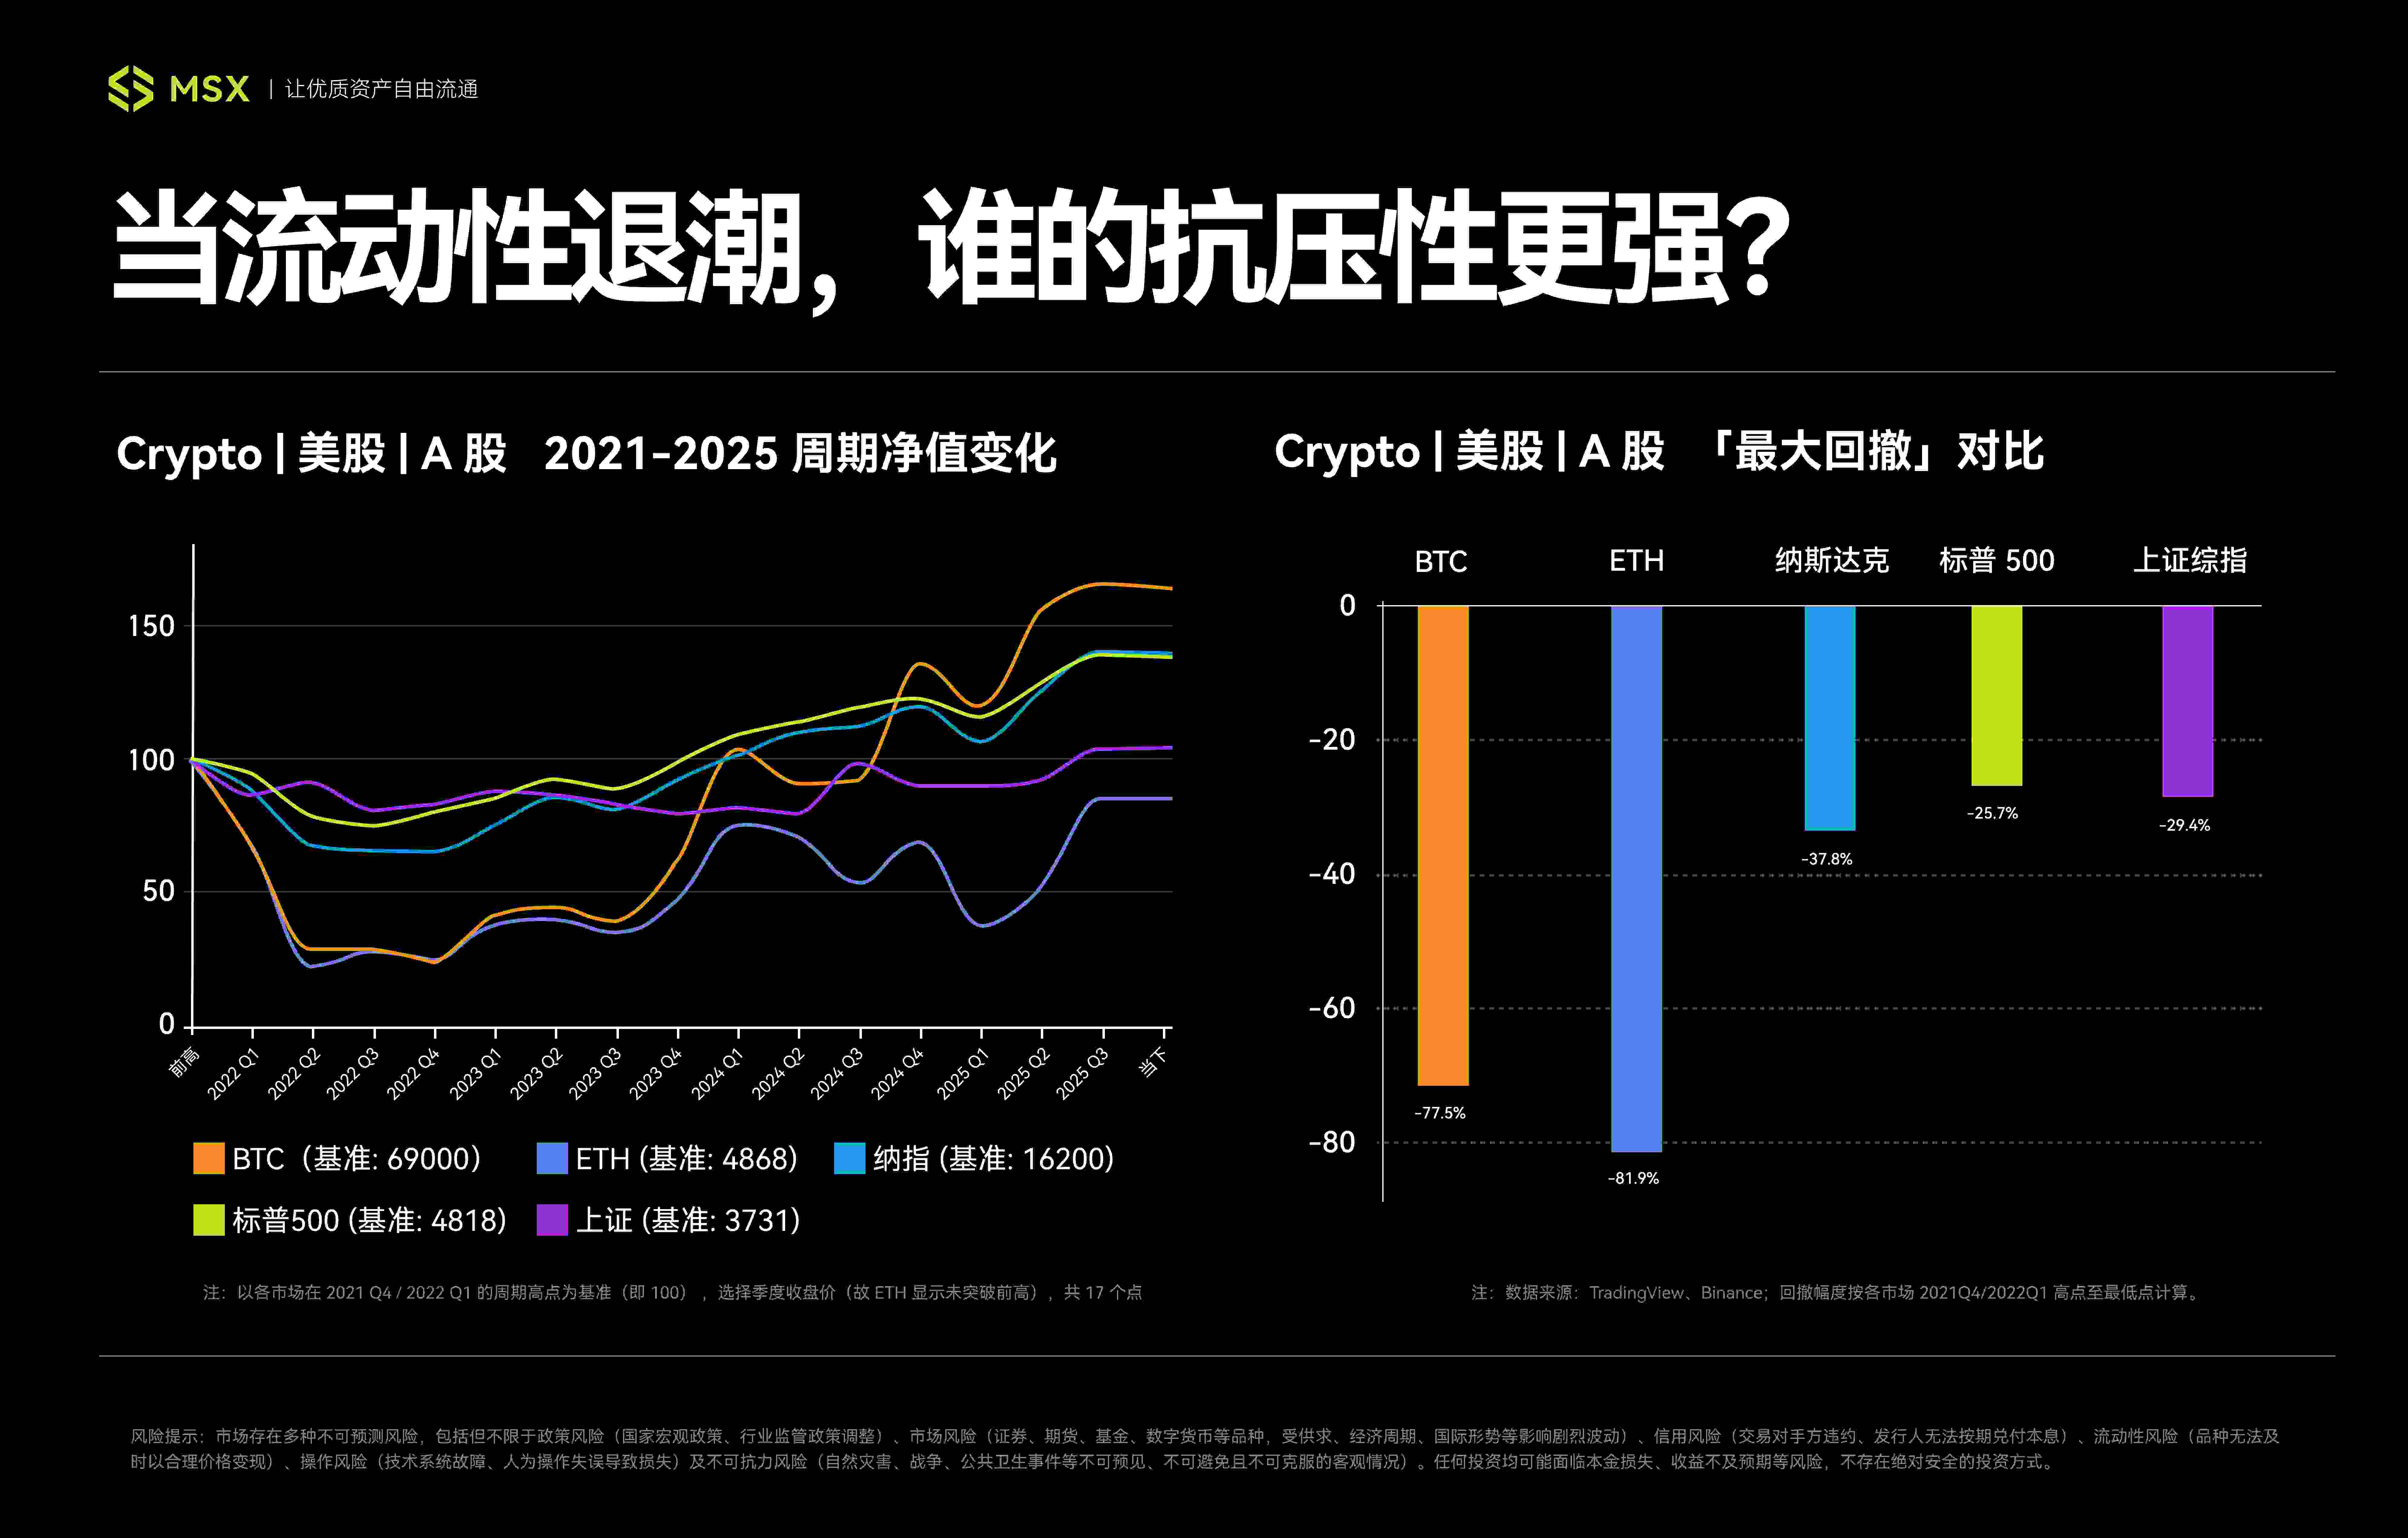
However, from Q4 2021 to Q4 2025, we witnessed a broader and more far-reaching resonance between macro liquidity and risk assets. This time, both emerging cryptocurrencies and mature US and A-shares were caught up in the dynamic, with a clear path that exemplifies a textbook example of a "peak boom - pullback - divergent recovery" cycle:
- Q4 2021: The final carnival of global liquidity overflow, Bitcoin, Nasdaq, and S&P 500 (Q1 2022) have successively set new historical highs, and A-shares are also at the end of the group rally;
- 2022-2023: The Federal Reserve's fastest interest rate hike cycle in history has caused a sudden tightening of US dollar liquidity, and no risky assets have been spared. US stocks, Crypto, and A-shares have experienced a brutal wave of liquidation;
- 2023-2025: Inflation peaks, AI concepts emerge, and expectations of interest rate cuts rekindle. Different markets, based on their own underlying logic, begin to follow completely different recovery curves.

Therefore, the complete cycle that the global market has experienced from 2021 to 2025 is very appropriate for review and comparison. It raises a core question: when the macro tsunami comes, all ships will sink, but why can some assets quickly float up and set new highs, while some ships remain stranded underwater, struggling on the edge of recovery.
Ultimately, drawdowns are the true face of asset risk, directly revealing the true strength of the underlying infrastructure. After all, investing shouldn't just focus on returns; it's also about asking, "Can you survive this?"
The long-term fate of the market is often determined by the recovery after the pullback, which is where the story of each cycle really begins.
2. 21-25: A complete cycle of "three-market resonance"
If we were to choose a time period to summarize the true fate of global assets over the past four years, 2021 Q4 – 2025 Q4 would undoubtedly be the most ideal sample.
Because this is not an ordinary bull-bear transition, but a rare "three-market resonance cycle": global liquidity has shifted from extreme looseness to rapid tightening, and then returned to stability. In this drastic macro change, both the emerging Crypto and the mature US stocks and A shares have experienced a complete three-act drama from "prosperity → liquidation → repair".
This provides us with a perfect controlled laboratory to observe how different assets actually perform in the same storm.
1. Q4 2021: Peak of the Bubble
First of all, 2021 is the final chapter of the global liquidity frenzy triggered by the epidemic. The overflow of cheap funds has pushed the valuation of risky assets to an unprecedented peak.
The most direct signal is that the U.S. stock market hit a historical high from the end of 2021 to the beginning of 2022. The Nasdaq index broke through 16,200 points on November 22, 2021, and then on January 4 of the following year, the S&P 500 index also hit 4,818 points. High valuations and the bubble in the technology sector became the main theme of the market.
Interestingly, Crypto and the Nasdaq resonated almost synchronously and reached their peak moments - Bitcoin reached a high of US$69,000 on November 10, 2021 (Binance spot data, the same below), and Ethereum also hit a record high of US$4,868 on the same day. The wealth myth of NFT and DeFi spread virally on social media, attracting the last batch of high-chasers to enter the market.
For A-shares, although the CSI 300 Index did not simultaneously set a new historical high (its highest point was in early 2021), driven by structural trends such as "carbon neutrality", "new energy" and "core liquor assets", the market still maintained a local frenzy at the high level of 3500-3700 points.
2.2022-2023: Violent liquidation
However, the feast ended more quickly and violently than anyone expected. Faced with inflation not seen in 40 years, the Federal Reserve launched the fastest interest rate hike cycle in history that year. Liquidity in the global market suddenly dried up, and no risky assets were spared.
Especially for the Crypto market, 2022 can be described as a devastating "black swan year": from the death spiral of Terra/LUNA, to the bankruptcy and liquidation of Three Arrows Capital, to the collapse of FTX, liquidity, confidence and valuations collapsed almost at the same time, and the leverage liquidation within the industry and the depletion of macro liquidity formed a perfect "Davis double kill".
Among them, Bitcoin has been in a state of collapse, reaching a cyclical low of $15,476 on November 21, 2022. Ethereum, on the other hand, hit a cyclical bottom of $881 on June 18. Counting from the high point, it has been exactly one year. The maximum retracement of BTC is as high as 77.5%, and the maximum retracement of ETH is as high as 82%, which is terrible.
As the pricing anchor of global assets, the pullback of U.S. stocks is more orderly in comparison. The logic of its decline clearly revolves around "anti-inflation" and "tightening expectations". The S&P 500 index bottomed out at 3,491 points (intraday) on October 13, 2022, with a maximum drawdown of about -27.5%. The Nasdaq also fell to a low of 10,088 points (intraday) on the same day, with a maximum drawdown of about 38%.
Although the absolute decline is much smaller than that of Crypto, considering its huge size, the evaporated market value is also astronomical, officially declaring that the world has entered a technical bear market.
The decline of A-shares is more complicated, which is the superposition of "global tightening" and "domestic factors". For two years, the market has experienced repeated bottoming out. The Shanghai Composite Index hit a low of around 2860 several times in April and October 2022, and even hit a new cyclical low of 2635 points on February 5, 2024.
Starting from the absolute high point (3731 points) on February 18, 2021, the Shanghai Composite Index has experienced a maximum drawdown of nearly 30%. Although the depth is similar to that of the US stock market, the repair process is extremely long, posing an extreme test to investors' confidence and patience.
3.2023-2025: Differentiated recovery
After entering 2023, when global inflation peaked and the interest rate hike cycle came to an end, the market began to brew a recovery, especially as the AI craze ignited the US stock market and ETF expectations boosted Crypto. This round of recovery began to no longer be synchronized, but completely diverged.
First of all, the U.S. stock market is recovering. There is no doubt that AI narrative will serve as the engine of a new round of growth. Technology giants such as Nvidia are far ahead, and the surge in profits of technology giants has also become a booster, leading the Nasdaq and S&P 500 to get out of the quagmire.
The S&P 500 officially recovered its losses on January 19, 2024, and the Nasdaq Composite Index followed suit on March 1, 2024, both reaching record highs. As of October 14, 2025 (close), the S&P 500 closed at 6,644 points and the Nasdaq at 22,521 points, representing increases of 38% and 39%, respectively, from their previous cycle highs in 2021/2022.
Crypto has regained the attention of mainstream funds as risks within the industry have been cleared and boosted by the "compliance" milestone of the approval of the Bitcoin spot ETF. The price of BTC has experienced a V-shaped reversal, breaking through the 2021 high and reaching US$126,199 at one point, a surge of nearly 83% compared to its previous historical high. ETH also made its comeback in August this year, setting a historical high of US$4,956.
However, the Alts are in a completely different situation. Except for the first-tier public chains such as Solana, Sui, TON, etc., which have ushered in a local bull market by relying on ecological revival or narrative dividends, most of them are almost dead in an environment of shrinking liquidity. The Alt market has gradually divided into two poles: "mainstream asset pool" and "speculative island".
The road to recovery for A-shares is particularly tortuous. Despite the frequent policy warming, market confidence has recovered slowly. The Shanghai Composite Index has been hovering at a low level for a long time, in sharp contrast to the performance of major global markets. It was not until August that it officially reached 3,800 points, starting its difficult recovery journey.
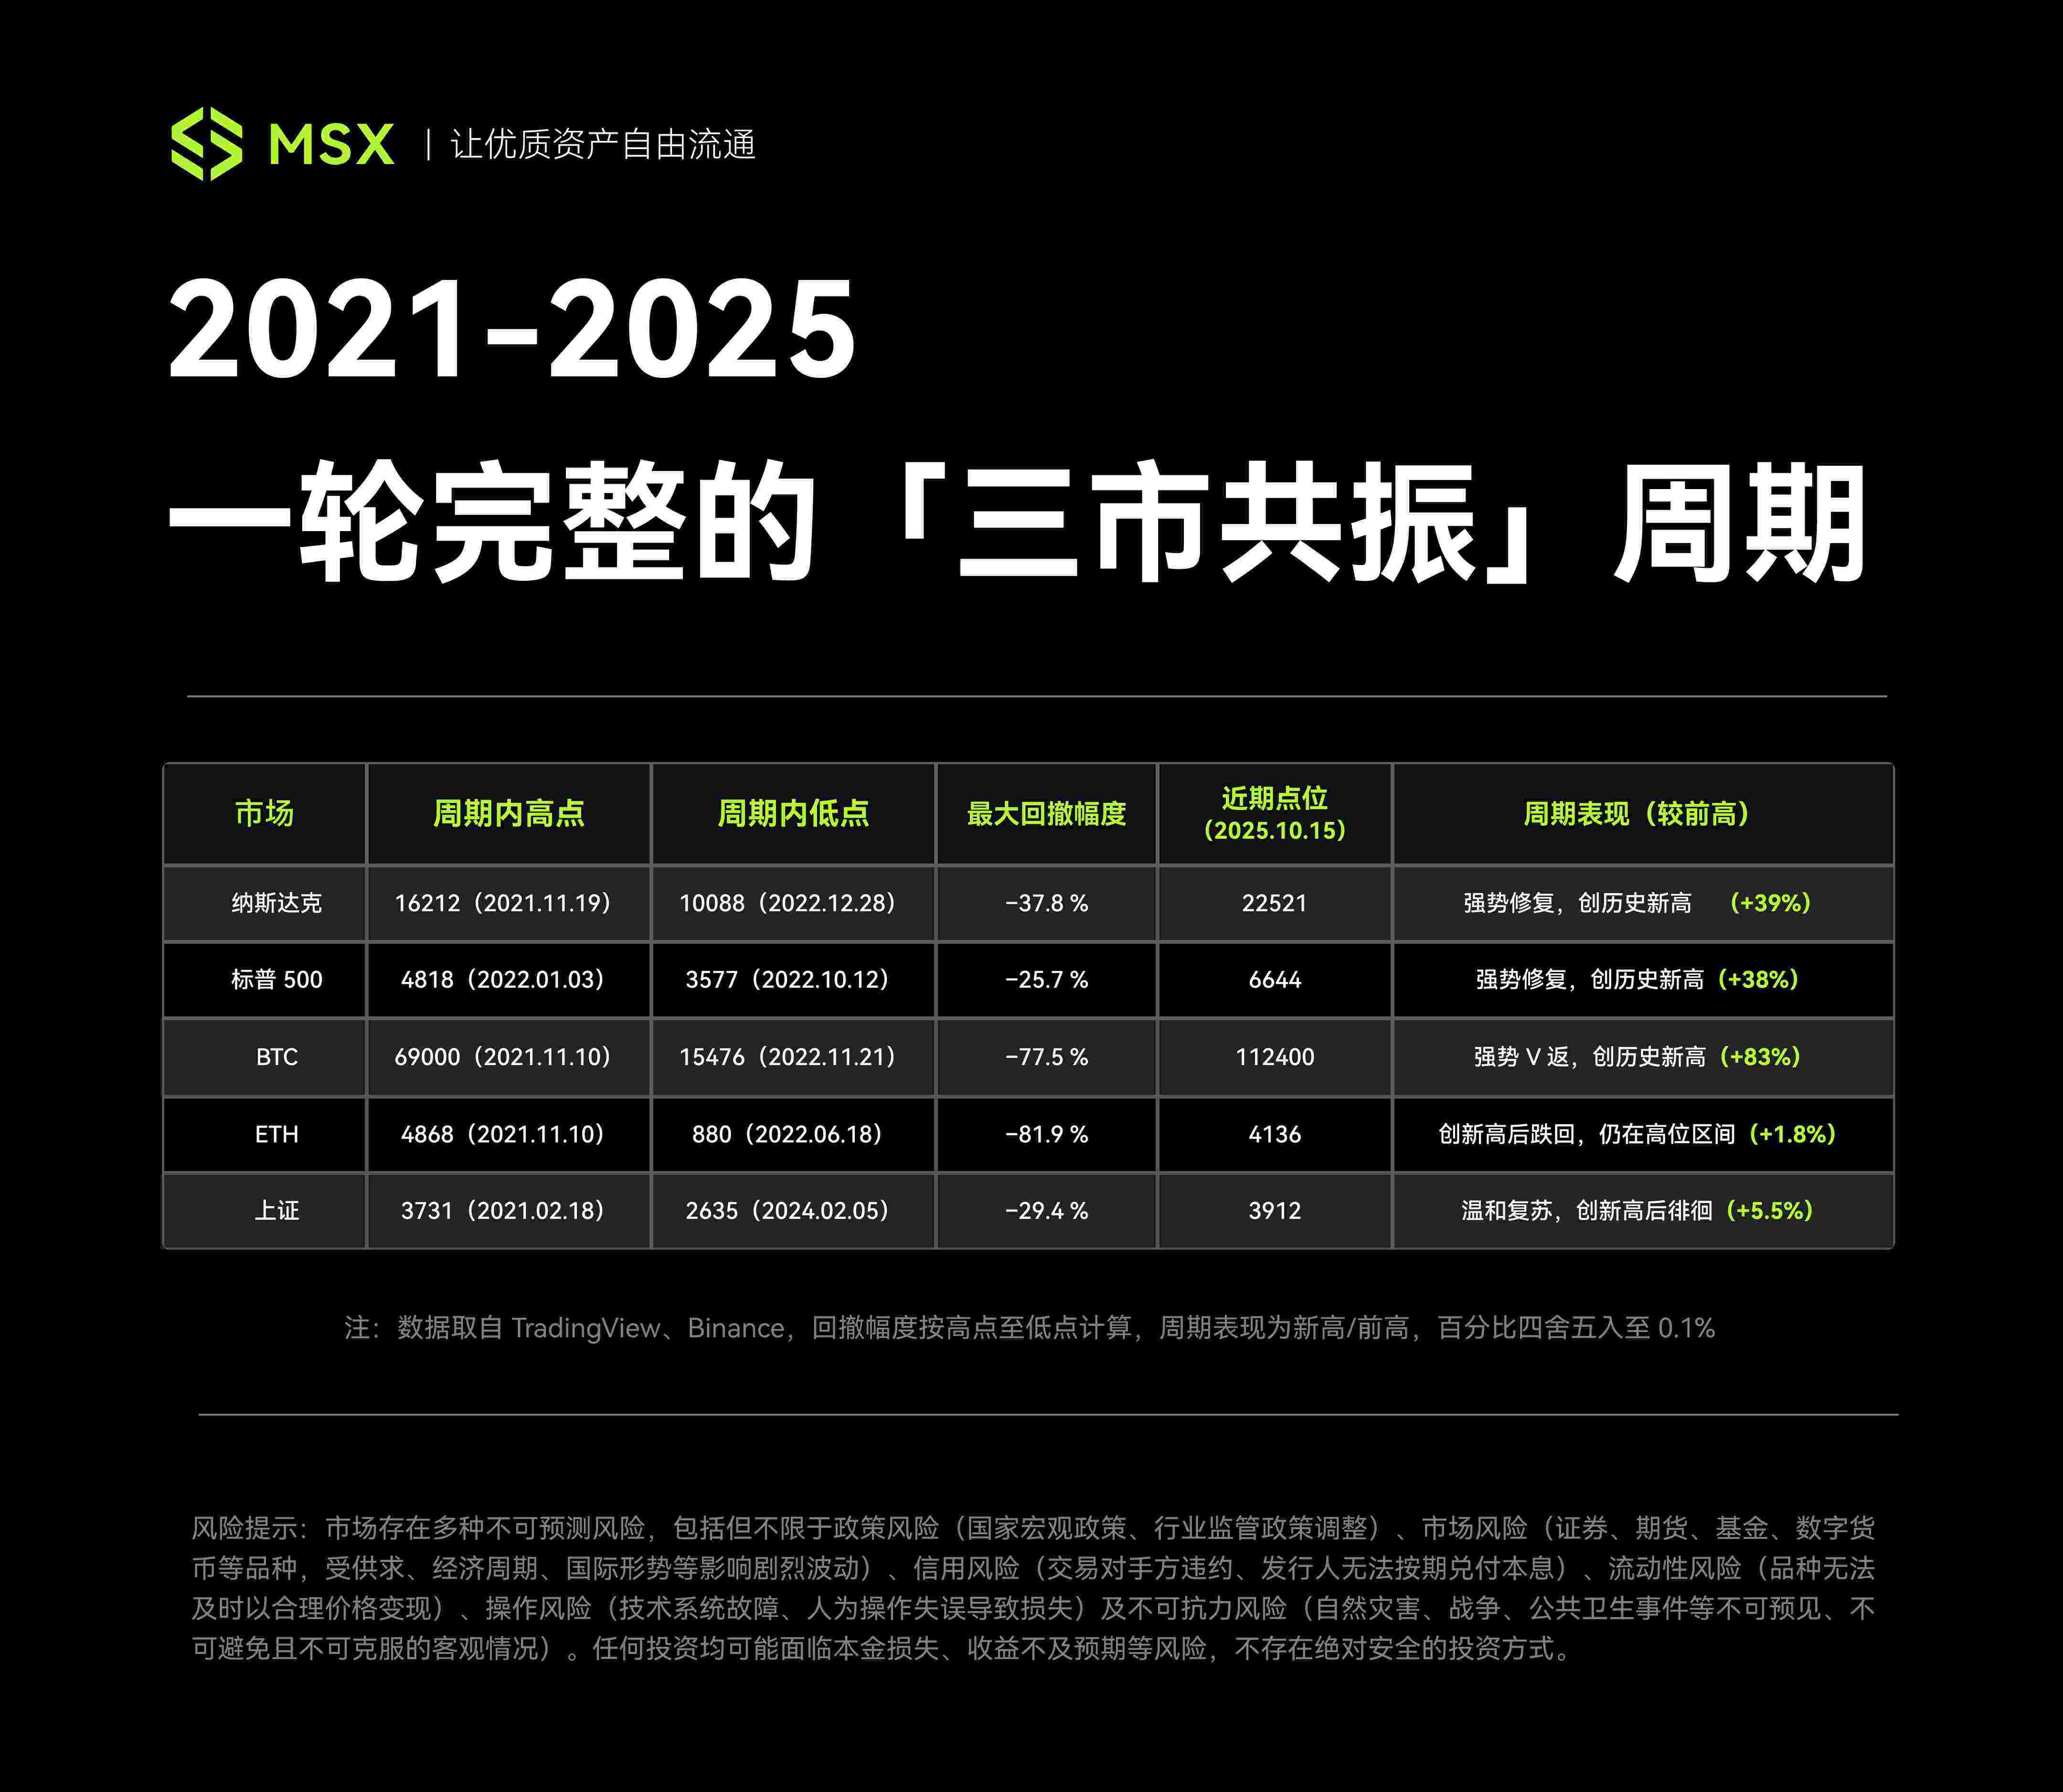 Note: Data is taken from TradingView and Binance. Retracement is calculated from high to low, and the cycle is expressed as new high/previous high. Percentages are rounded to the nearest 0.1%.
It is worth noting that although the highest point of A-shares occurred in February 2021, earlier than the starting point of our defined cycle (October 21), based on the "triple top" structure and from the perspective of retracement calculation, this article still starts from that absolute high point, which can better reflect its complete downward cycle.
At this point, a complete cycle has been completed, and the three major markets have delivered completely different responses after experiencing similar macro shocks.
3. Cross-market comparison: Who can withstand cyclical pullbacks?
Overall, the pullbacks in the three major markets of U.S. stocks, Crypto, and A-shares all have an obvious commonality, that is, they are strongly correlated with the U.S. dollar liquidity cycle. For example, all three peaked around Q4 2021, and bottomed out in resonance around Q4 2022, indicating that the U.S. dollar liquidity cycle is still the "main gate" hanging above the global market.
However, if we look closely at the underlying logic of the three, we will find that they each represent a different cycle paradigm:
- The US stock market relies on institutions and profitability, and is the most typical "liquidity-profit" dual-cycle market;
- Crypto relies on narrative and liquidity supply, and is a "highly elastic cyclical asset" with built-in leverage;
- A-shares, on the other hand, rely on policies and confidence, and are a typical "structural recovery market";
In other words, the depth of the U.S. stock market's pullback is determined by liquidity, but the speed of recovery is driven by corporate profits. Therefore, in the tightening storm of 2022, the decline of U.S. stocks is a valuation compression dominated by macro logic, but when the liquidity panic subsides, the market's focus quickly returns to fundamentals.
In particular, the huge productivity expectations brought about by the subsequent AI revolution were directly converted into tangible profit growth and income statement expansion for technology giants. This powerful "profit-stock price" positive feedback mechanism, coupled with its mature financial system (such as the long-term allocation needs of institutional investors), together constituted a tenacious repair closed loop, making the US stock market always a model of "declining in an orderly manner and rising faster."
Crypto, to a large extent, is an amplifier of the risk appetite of the U.S. stock market (especially the Nasdaq) - when liquidity is abundant, its growth is even more astonishing; when liquidity dries up, its decline is even more severe. It can be regarded as a "cyclical offensive target" with high leverage.
However, the other side of high elasticity is drastic differentiation. As Bitcoin ETFs deeply bind this market to Wall Street, most Alts are almost dead in the liquidity contraction. The "Alt general rise bonus" expected by ordinary people is becoming increasingly scarce, and the market is gradually dividing into "mainstream asset pools" and "speculative islands."
To put it bluntly, as Crypto assets gradually become "Wall Street-like" and "institutionalized," they no longer represent the excess returns of the grassroots era, but a market with extremely high volatility but diminishing marginal returns. Liquidity dividends are beginning to give way to structural opportunities, which also means that U.S. stocks have once again become a more cost-effective option.
After all, compared with Altcoins, U.S. stocks have higher certainty, information transparency, and institutional maturity. High-quality assets have smaller drawdowns and faster rebounds. Moreover, since corporate profits can be verified and policy cycles are predictable, the logic of the news can always be dug out - it is rare for there to be "unexplained surges and plunges" in the market. Therefore, from an investment perspective, this kind of certainty is precisely the most scarce value in the current liquidity environment.
The repair logic of A-shares neither relies entirely on the global technological wave nor has an endogenous supply mechanism. The core driving force is more like a long game between the "policy bottom" and the "market bottom", and its essence is the repair of confidence and expectations.
In short, from this perspective, it is entirely possible to use U.S. stocks as base assets, Crypto as a cyclical offensive asset with built-in leverage, and A-shares as a structural strategy target.
Final Thoughts
Looking back at this global market experiment from 2021 to 2025, we will find that surviving the pullback is the only way to grasp the cycle.
There is no standard answer to how to withstand drawdowns safely, but understanding their risk-return characteristics, especially their drawdown performance under extreme pressure, is the first step in making wise decisions.
After all, in the long-term race of investment, what determines how far we can go is never how fast we run when the wind is favorable, but how much of a drawdown we can withstand when the wind is against us.
Let us encourage each other.