
On-chain lending breaks records: A panoramic view of the current state of crypto market leverage in Q2 2025
- 核心观点:加密货币杠杆Q2大幅回升,创历史新高。
- 关键要素:
- CeFi借贷环比增长14.66%至177.8亿美元。
- DeFi借贷增长42%至264.7亿美元新高。
- 期货未平仓合约达1326亿美元。
- 市场影响:市场风险偏好显著提升。
- 时效性标注:中期影响。
Originally Posted by Zack Pokorny, Galaxy
Original translation: AididiaoJP, Foresight News
introduction
Leverage in the cryptocurrency market resumed its upward trend in the second quarter, following declines in both cryptocurrency-backed loans and futures markets in the first quarter. Renewed optimism about cryptocurrencies following the "Liberation Day" market volatility in early April and rising asset prices also fueled leverage expansion in the second quarter. Notably, on-chain cryptocurrency collateralized lending grew 42% during this period, reaching a record high of $26.5 billion.
Digital Asset Reserve Companies (DATCOs) remained a key topic in Q2. However, these companies’ overreliance on non-debt strategies to fuel asset purchases resulted in their debt balances remaining unchanged compared to the previous quarter.
This article tracks leverage trends in crypto-collateralized lending on DeFi and CeFi platforms, publicly traded reserve companies, and crypto futures markets, while also adding new participants in CeFi and DeFi lending platforms and futures markets.
Key Takeaways
As of June 30, Galaxy Research tracked $17.78 billion in outstanding CeFi borrowing. This figure represents a 14.66% increase ($2.27 billion) month-over-month and a $10.59 billion increase ($147.5%) since the bear market trough in Q4 2023 ($7.18 billion).
Outstanding USD-denominated loans in DeFi applications rebounded strongly from the first quarter, increasing by $7.84 billion (+42.11%) to $26.47 billion, a new all-time high.
Digital Asset Reserve Companies (DATCOs) remained a core theme in Q2. The rise of Ethereum Reserve Companies became a notable trend within the DATCO space between March and June, as such entities were less common in the early months of the year.
Because Bitcoin DATCOs haven’t issued new debt, the outstanding debt balance of the companies that track the data reserves remains unchanged. Nevertheless, June 2028 remains a month to watch, as $3.65 billion in outstanding debt matures.
Open interest in futures contracts, including perpetual futures, surged in the second quarter, reaching $132.6 billion across major platforms as of June 30.
As of June 30, the open interest in perpetual futures contracts was US$108.922 billion, an increase of US$29.2 billion (+36.66%) from the end of the first quarter.
Cryptocurrency-backed loans
The following shows the major players in the CeFi and DeFi cryptocurrency lending markets. As cryptocurrency prices plummeted and liquidity dried up, some of the largest CeFi lenders by loan size collapsed in 2022 and 2023. These lenders are highlighted with red warning dots. Since Galaxy's last cryptocurrency leverage report, we've added five DeFi applications, one CeFi lender, and one collateralized debt position (CDP) stablecoin.
New DeFi applications include:
- Fraxlend (Ethereum, Fraxtal, and Arbitrum)
- Curve Llamalend (Ethereum, Arbitrum, Fraxtal, and OP Mainnet)
- Lista (BSC)
- Hyperlend (HyperEVM)
- Venus (BSC, Ethereum, Unichain, Arbitrum, zkSync Era, Base, OP Mainnet, and opBNB)
Existing applications for extended chain coverage include:
- Echelon (Echelon Chain)
- Save (Eclipse)
- Euler (Arbitrum)
- Kamino (13 new markets)
- Dolomite (Ethereum)
New Collateralized Debt Position (CDP) stablecoins include:
- Felix (HyperEVM native)
New CeFi lenders include:
- Figure Markets
- Nexo
Cryptocurrency Lending and Credit Market Map
CeFi
The table below compares CeFi cryptocurrency lenders included in the market analysis. Some companies offer multiple services to investors. For example, Coinbase primarily operates as an exchange but also provides credit to investors through over-the-counter cryptocurrency loans and margin financing. However, this analysis focuses solely on the scale of its cryptocurrency-collateralized lending.
This is Figure Markets' first participation in this report. Figure is a leading player in the on-chain credit space, with $11.1 billion in private credit and home equity lines of credit (HELOCs). The company also offers Bitcoin-backed loan products, data for which is included in the table below. Although Figure's Bitcoin loan product has been live since April 2024, the company only recently began incentivizing its use.
Nexo also made its first appearance in the report this quarter. The lender, which has been operating since 2018 and currently serves only non-US clients, recently announced plans to re-enter the US market.
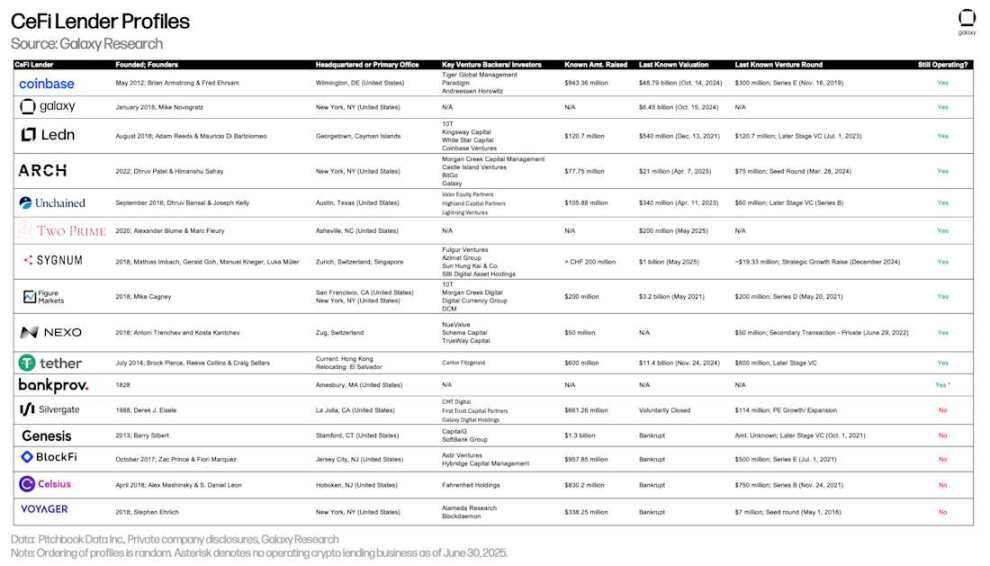
Overview of CeFi Cryptocurrency Lenders
Galaxy Research tracked $17.78 billion in CeFi borrowing outstanding as of June 30. This figure represents a 14.66% increase ($2.27 billion) month-over-month and a $10.59 billion increase ($147.5%) since the bear market trough in Q4 2023 ($7.18 billion).
Galaxy Research believes that the growth of CeFi lending is mainly driven by the following factors:
- Lending activity is reflexive to price increases: as prices rise, lending activity generally increases. This applies to both DeFi and CeFi lending.
- Increased competition could start to show up in borrowing costs. More competition means costs are better controlled, leading to greater lending activity in the market at more attractive rates.
- Reserve companies are beginning to raise funds through CeFi lenders, which represents a sizable new source of demand.
Due to adjustments to its loan issuance strategy, Ledn has fallen out of the top three in terms of outstanding loan volume. In the second quarter, Ledn decided to fully focus on Bitcoin-backed loans, eliminating its yield and Ethereum-related products. This decision led to a record high in Ledn's Bitcoin-backed loan issuance. However, due to the cancellation of institutional loans (from discontinued Bitcoin and Ethereum yield products), its overall loan volume declined compared to the first quarter. It is important to note that as of the end of the second quarter, Ledn's reported loan volume was 100% USD-denominated, of which 99% was Bitcoin-backed and 1% was legacy Ethereum-backed loans, which will be phased out.
Tether, Nexo, and Galaxy are the top three lenders by outstanding loan value tracked by Galaxy Research. As of June 30, Tether had $10.14 billion in outstanding loans, Nexo had $1.96 billion, and Galaxy had $1.11 billion.
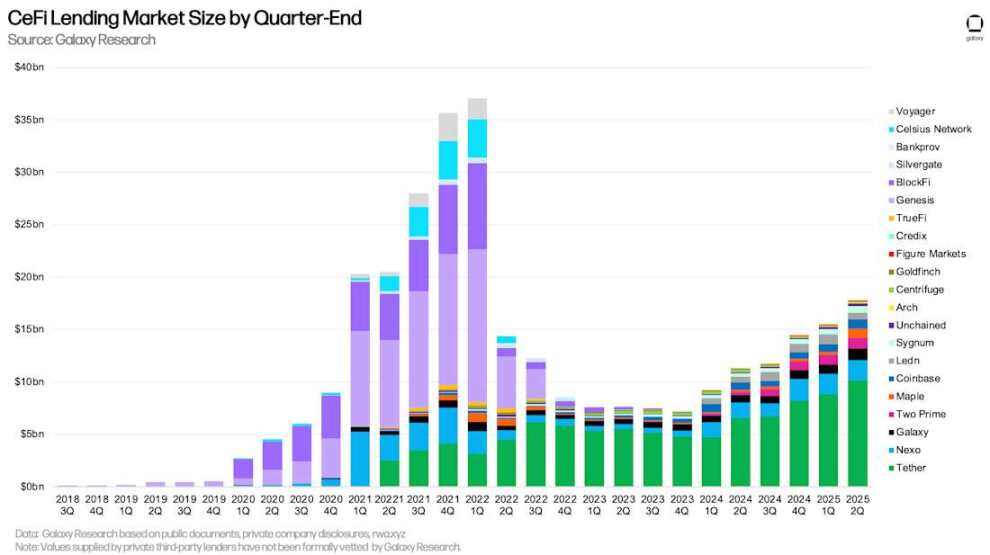
CeFi cryptocurrency lending market size by quarter end
Tether dominated our analysis with a 57.02% market share. Together with Nexo (11.01%) and Galaxy (6.23%), the top three CeFi lenders accounted for 74.26% of the market share.
When comparing market share, it's important to note the differences among CeFi lenders. Some lenders offer only specific loan types (e.g., only Bitcoin-collateralized, altcoin-collateralized products, or cash loans excluding stablecoins), serve only certain client types (e.g., institutional or retail), or operate only in specific jurisdictions. This combination of factors makes it easier for some lenders to scale.
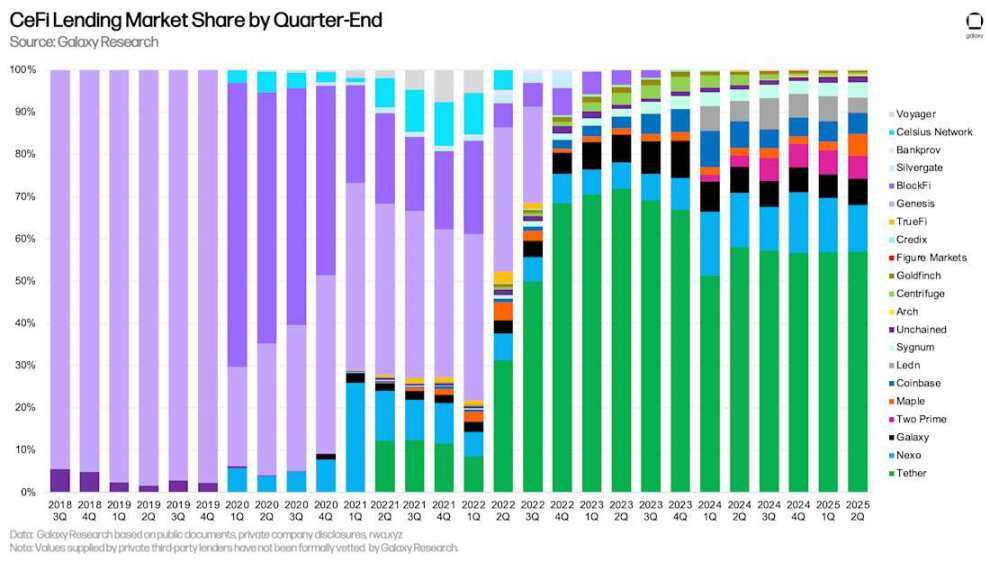
CeFi lending market share by quarter end
The table below details Galaxy Research's data sources for each CeFi lender and the logic used to calculate their loan size. While DeFi and on-chain CeFi loan data is readily available through transparent on-chain data, obtaining CeFi data is more complex. This is due to inconsistencies in how CeFi lenders calculate outstanding loans, how frequently they disclose this information, and the difficulty of obtaining this information.
It is important to note that the values provided by third-party private lenders have not been formally audited by Galaxy Research.
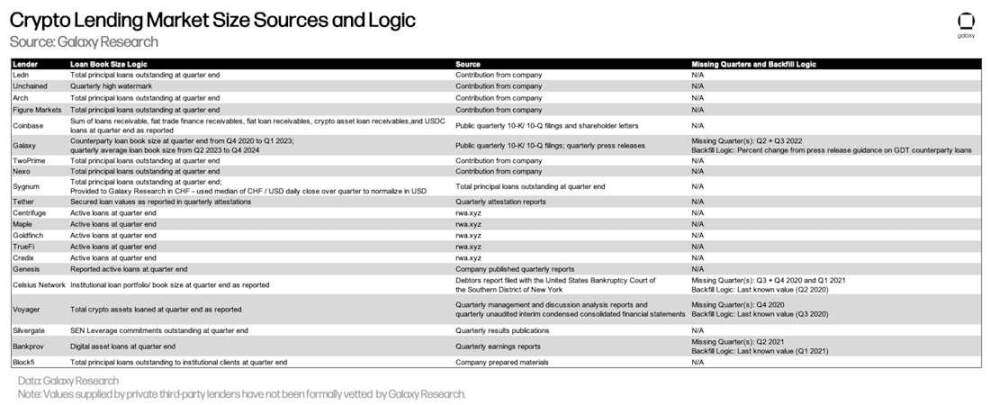
Cryptocurrency lending market size data source and logic
CeFi and DeFi lending
Outstanding USD-denominated loans in DeFi applications rebounded strongly from the first quarter, increasing by $7.84 billion (+42.11%) to $26.47 billion, a new all-time high. Combining DeFi applications with CeFi lending platforms, total outstanding cryptocurrency-collateralized borrowing reached $44.25 billion at the end of the quarter. This figure represents a $10.12 billion (+29.64%) increase from the previous quarter, primarily driven by growth in outstanding loans on DeFi lending platforms. Only the fourth quarter of 2021 ($53.44 billion) and the first quarter of 2022 ($48.39 billion) had higher outstanding loans than the second quarter of 2025.
Note: There may be double counting between total CeFi lending and DeFi borrowing. This is because some CeFi entities rely on DeFi applications to lend to off-chain customers. For example, suppose a CeFi lender pledges its idle Bitcoin to borrow USDC on-chain, then lends the USDC to an off-chain borrower. In this case, the CeFi lender's on-chain borrowing would appear both in its DeFi outstanding borrowings and in its financial statements (as outstanding loans to customers). This is difficult to filter out due to the lack of disclosure or on-chain attribution information.
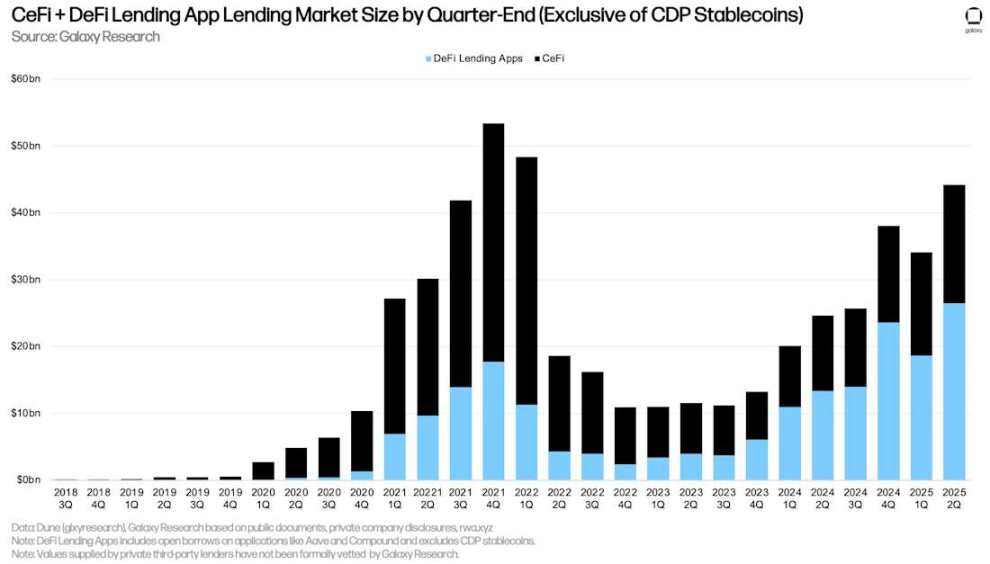
CeFi + DeFi lending application market size by quarter end (excluding CDP stablecoins)
Due to the quarter-over-quarter growth in outstanding borrowings in DeFi lending applications, their lead over CeFi lending platforms is once again approaching its all-time high in Q4 2024. As of the end of Q2 2025, DeFi lending applications accounted for 59.83% of CeFi lending platforms, up from 54.56% in Q1 2025, but down 216 basis points from the high of 61.99% in Q4 2024.
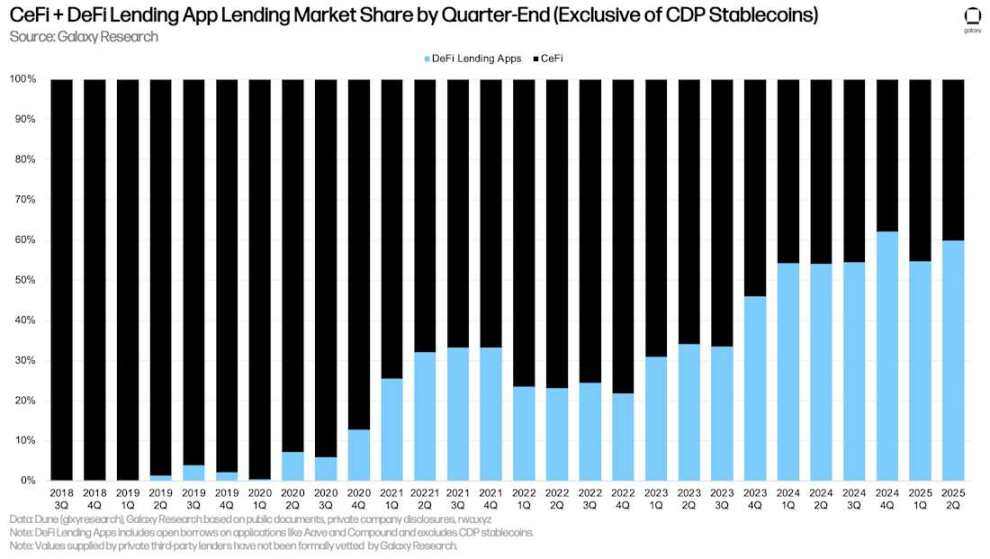
CeFi + DeFi lending application market share by quarter end (excluding CDP stablecoins)
The third component, the cryptocurrency-collateralized portion of the stablecoin supply of collateralized debt positions (CDPs), saw a month-over-month increase of $1.24 billion (+16.45%). Similarly, there may be double counting between the total size of CeFi loans and the supply of CDP stablecoins, as some CeFi entities may rely on minting CDP stablecoins with cryptocurrency collateral to provide loans to off-chain clients.
Overall, crypto-collateralized lending increased by $11.43 billion (+27.44%) to $53.09 billion in Q2 2025. Only Q4 2021 ($69.37 billion) and Q1 2022 ($63.43 billion) saw higher crypto-collateralized lending and CDP stablecoin balances than today’s levels.
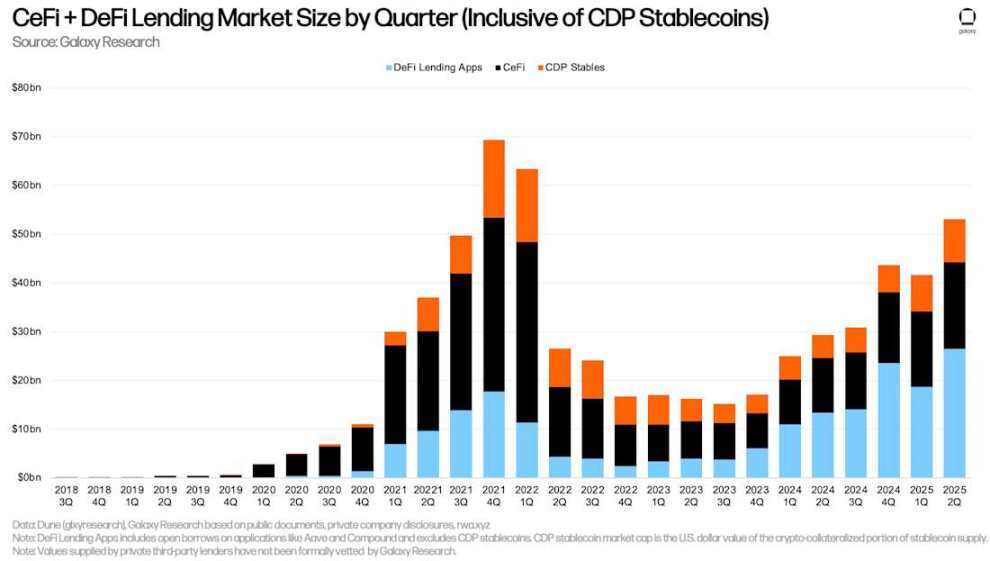
Quarterly CeFi + DeFi lending market size (including CDP stablecoins)
As of the end of Q1 2025, DeFi lending applications accounted for 49.86% of the crypto-collateralized lending market (up 515 basis points from Q1 2025), CeFi platforms accounted for 33.48% (down 373 basis points), and the crypto-collateralized portion of CDP stablecoins accounted for 16.65% (down 142 basis points). Combining DeFi lending applications and CDP stablecoins, on-chain lending platforms accounted for 66.52% of the market (up 373 basis points), down from a historical high of 66.86% at the end of Q4 2024.
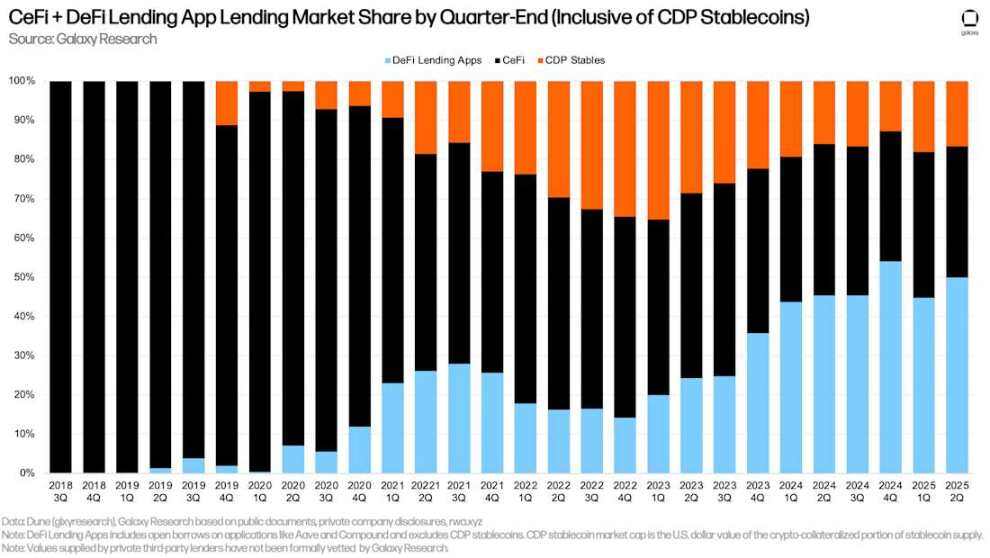
CeFi + DeFi lending application market share by quarter end (including CDP stablecoins)
Other perspectives on DeFi lending
DeFi borrowing continues to climb to new all-time highs, with activity on Ethereum dominating. Ethena's "Liquid Leverage" initiative, a partnership with Aave, and the continued use of Pendle Principal Tokens (PTs) on Aave and Euler have played a significant role in expanding the on-chain lending market. Powered by the "Liquid Leverage" program and Pendle PT tokens, users are implementing "revolving strategies," which allow them to profit from arbitrage between the yield of collateralized assets and borrowing costs. This strategy, commonly used with ETH and stETH (liquid staked ETH), allows users to gain leveraged exposure to the annualized interest rate (APY) on Ethereum staking.
Since the quarter-end on June 30, the asset supply of DeFi lending applications has increased by $20.06 billion (+33.91%) to $79.22 billion. As of July 31, 2025, Ethereum accounts for 78.22% of DeFi lending supply. During the same period, Solana's deposits were $4.3 billion, accounting for 5.43%.
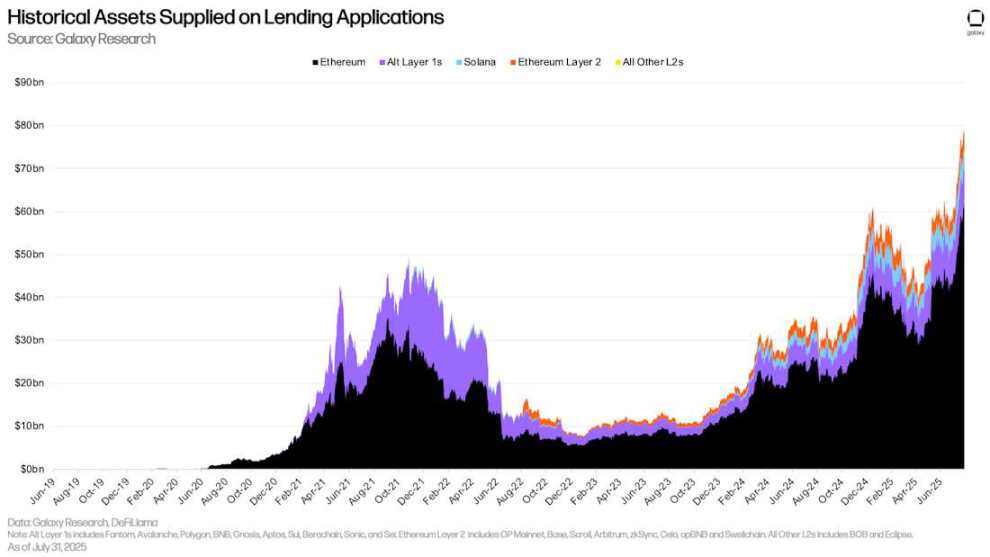
Historical asset supply on lending applications
DeFi lending applications saw similar growth in borrowed assets as supply. Between June 30th and July 31st, DeFi lending applications added $6.2 billion in new borrowing (+33.94%). Ethereum led the growth in both absolute and relative terms, with $8.48 billion in new borrowing, a growth rate of +42.73%. Over the same period, Ethereum's Layer 2 borrowing platform ranked second in terms of growth, with total borrowing increasing by $309.73 million (+24.71%).
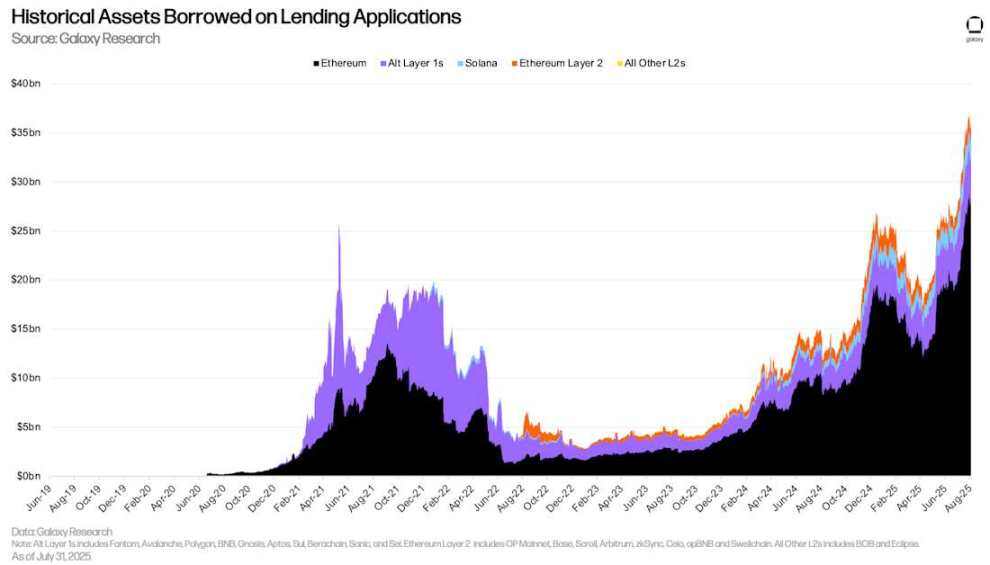
Historical borrowing assets on lending applications
As of August 8th, there was $5.79 billion worth of Ethena assets outstanding on Aave V3 Core, of which 55.88% were Pendle PT tokens. Furthermore, the total amount of USDe (synthetic USD on Ethena) and sUSDe (staked USDe, whose returns come from USDe’s underlying collateral) was $2.45 billion.
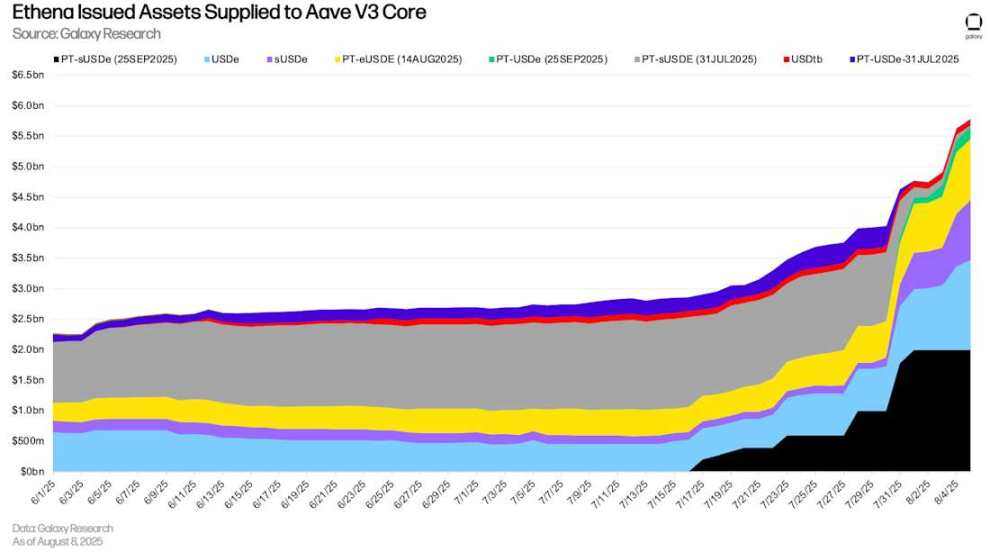
Ethena-issued assets supplied to Aave V 3 Core
On-chain and off-chain interest rates
Below is a comparison of the borrowing rates for stablecoins, BTC, and ETH in the on-chain lending market and off-chain platforms.
Stablecoins
The weighted average stablecoin borrowing rate rose slightly from 4.7% on March 31st to 4.96% on July 31st (using a seven-day moving average of the weighted average stablecoin borrowing rate and CDP stablecoin minting fees). This slight increase was due to a slight increase in borrowing activity, while stablecoin lending market parameters remained largely unchanged. Stablecoin interest rates on Aave (the largest stablecoin liquidity center) have remained unchanged since mid-March 2025.
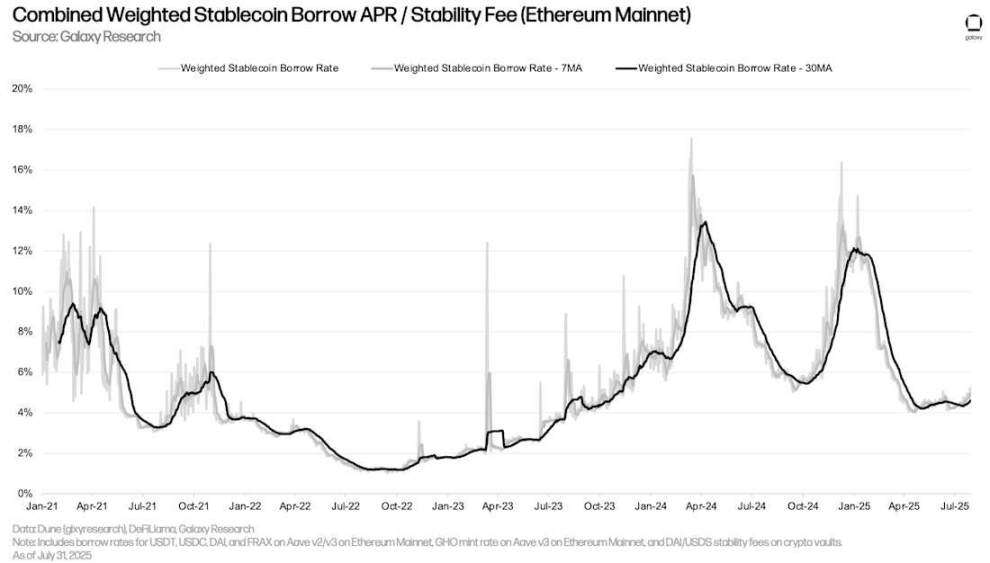
Composite Weighted Stablecoin Borrowing Annual Interest Rate/Stability Fee (Ethereum Mainnet)
Below are the costs of borrowing stablecoins through lending apps and minting them using crypto as collateral. While the two interest rates tend to move similarly, CDP minting rates are typically less volatile because they are manually set periodically and don't fluctuate in real time with the market.
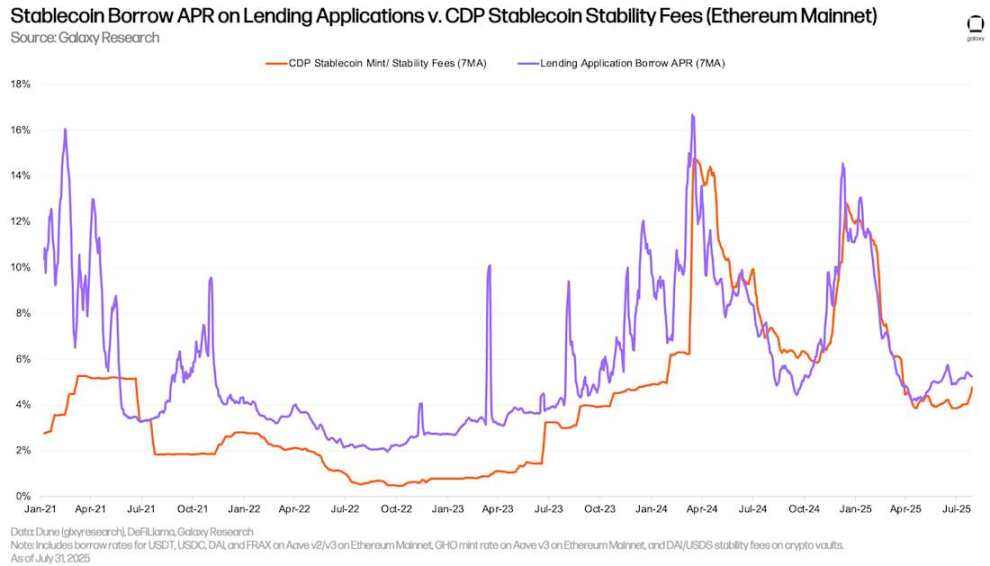
Stablecoin APR on Lending Apps vs. CDP Stablecoin Stability Fees (Ethereum Mainnet)
Since early July, over-the-counter (OTC) USDC interest rates have begun to rise slightly, while interest rates on on-chain lending applications have remained largely flat. As of July 28, 2025, the spread between on-chain USDC interest rates and OTC interest rates (on-chain interest rate minus OTC interest rate) reached its highest level since December 30, 2024. Despite continued price increases throughout the quarter, both on-chain and OTC stablecoin interest rates remained stable.
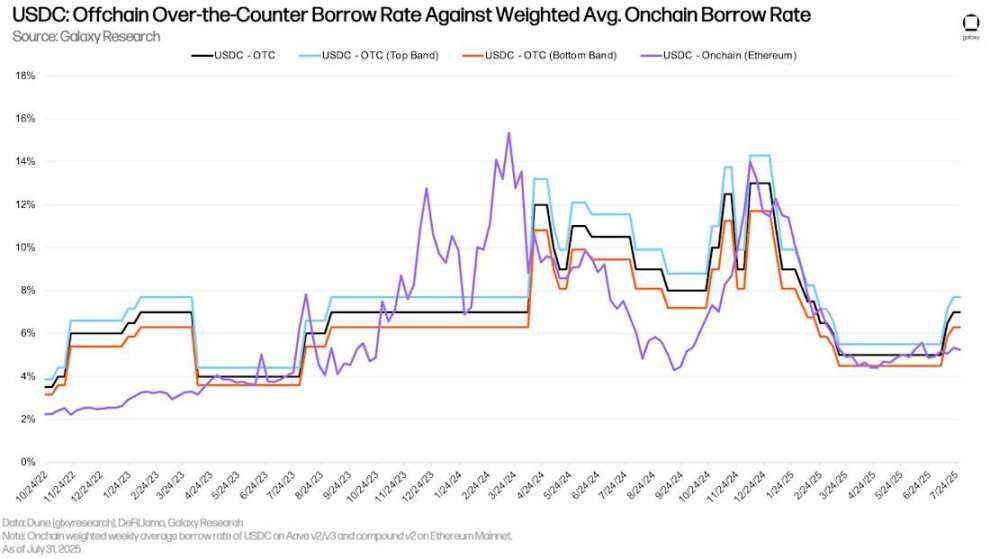
USDC: OTC borrowing rate vs. weighted average on-chain borrowing rate
The chart below tracks the same interest rates for USDT. Since early July, USDT’s on-chain and OTC interest rates have been closer than those of USDC.
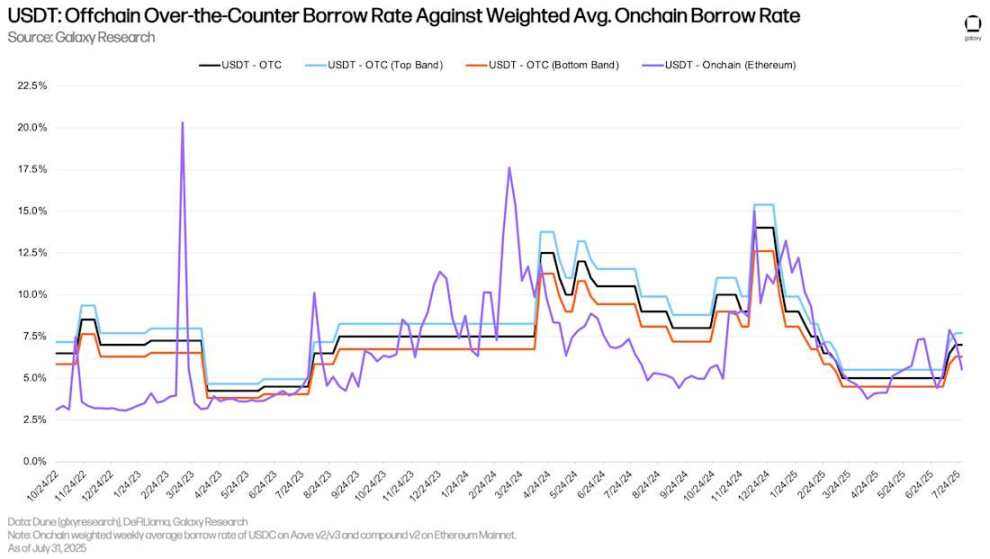
USDT: OTC borrowing rate vs. weighted average on-chain borrowing rate
Bitcoin
The chart below shows the weighted borrowing rates for Wrapped Bitcoin (WBTC) in lending applications across multiple applications and chains. On-chain WBTC borrowing costs are generally lower because Wrapped Bitcoin is primarily used as collateral in on-chain markets and borrowing demand is low. Compared to stablecoins, on-chain BTC borrowing costs continue to remain stable because users borrow and repay less frequently.
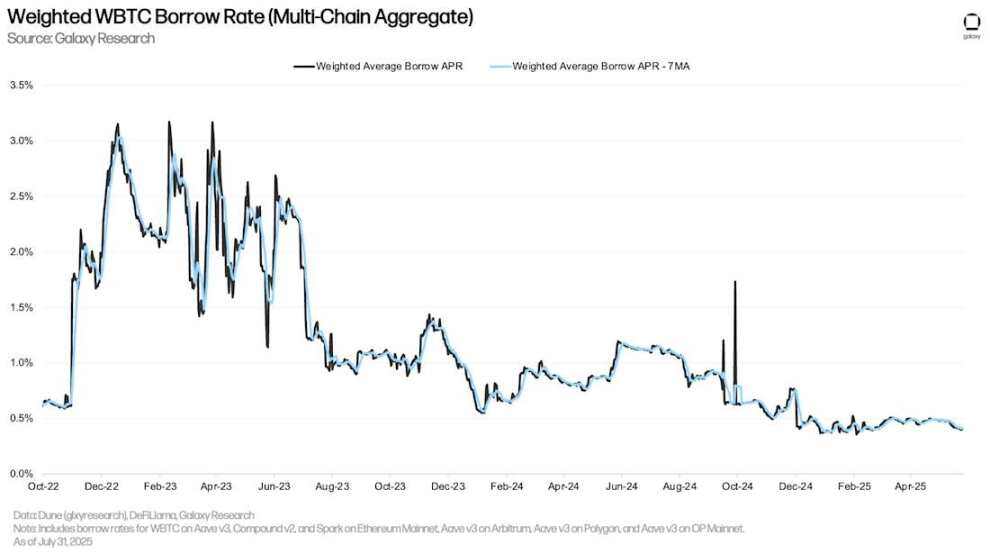
Weighted WBTC Borrowing Rate (Multi-chain Aggregation)
The historical divergence between on-chain and OTC BTC borrowing rates persisted in the second quarter. In the OTC market, demand for BTC is primarily driven by two factors: 1) shorting BTC; and 2) using BTC as collateral for stablecoin and cash loans. The former is a less common source of demand in the on-chain lending market, leading to a discrepancy in on-chain and OTC BTC borrowing costs.
In early April, as the market rebounded strongly from its Liberation Day lows, OTC BTC interest rates rose slightly. However, as the market cooled in late July, interest rates fell back to the 2.25% level seen at the beginning of the second quarter.
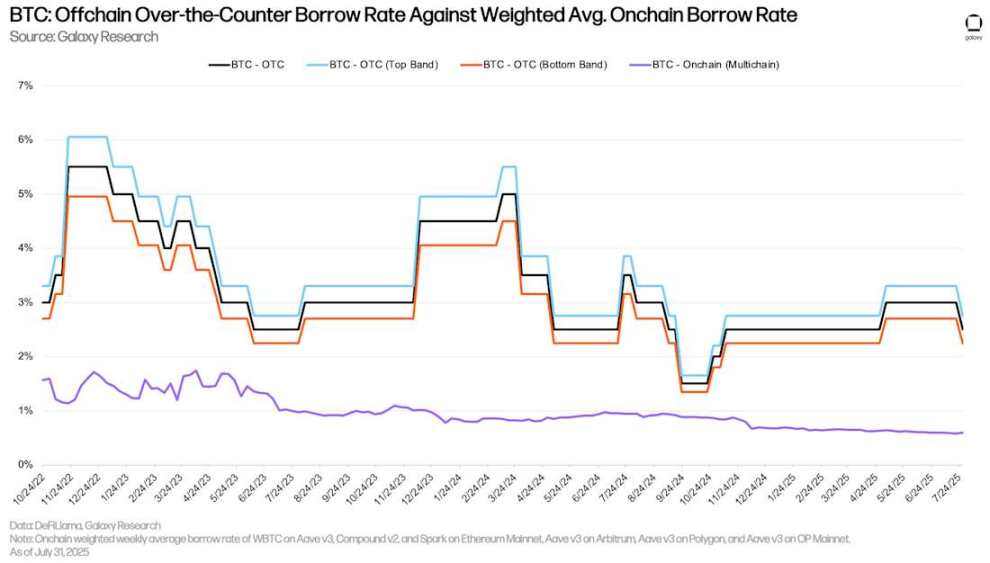
BTC: OTC borrowing rate vs. weighted average on-chain borrowing rate
ETH and stETH
The chart below shows the weighted borrowing rates for ETH and stETH (staked ETH on the Lido protocol) across multiple applications and chains. Historically, ETH borrowing costs have been higher than stETH because users borrow ETH to implement revolving strategies, gaining leveraged exposure to the Ethereum network's annual staking rate (using stETH as collateral). As a result, ETH borrowing rates typically fluctuate around the Ethereum network's annual staking rate by 30-50 basis points. When borrowing costs exceed staking returns, this strategy becomes uneconomical, and as a result, ETH borrowing rates rarely exceed the annual staking rate for extended periods. However, ETH borrowing rates spiked significantly in July due to a large withdrawal of ETH from Aave V 3 Core. The impact of this event is discussed in detail below.
Similar to WBTC, borrowing costs for stETH are generally lower because the asset is primarily used as collateral and has relatively low utilization.
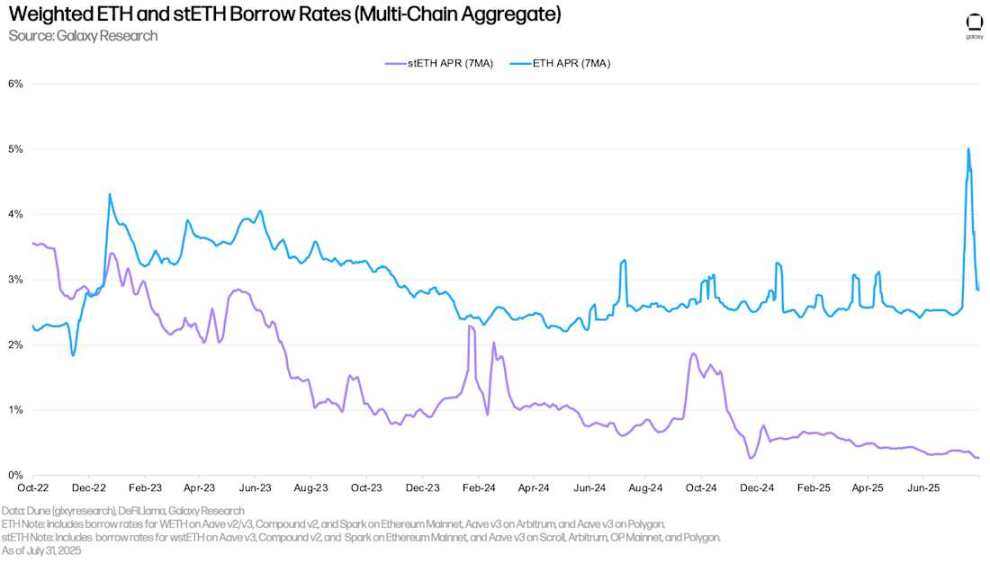
Weighted ETH and stETH borrowing rates (multi-chain aggregation)
By using Liquid Staking Tokens (LSTs) or Liquid Restaking Tokens (LRTs) as collateral (these yield-generating tokens), users can obtain ETH loans at low (or even negative) net borrowing rates. This cost efficiency drives the use of a recycling strategy: users repeatedly use LSTs as collateral to borrow unstaked ETH, stake it, and then use the generated LSTs to borrow more ETH, thereby amplifying their exposure to the ETH staking annual interest rate. This strategy only works when the borrowing cost of ETH is lower than the stETH staking annual interest rate. In most cases, users can successfully implement this strategy. However, between July 15th and July 25th, nearly 300,000 ETH was withdrawn from Aave V3 Core, causing ETH borrowing rates to spike, rendering the recycling strategy unprofitable (the net interest rate is consistently above 0% in the figure below).
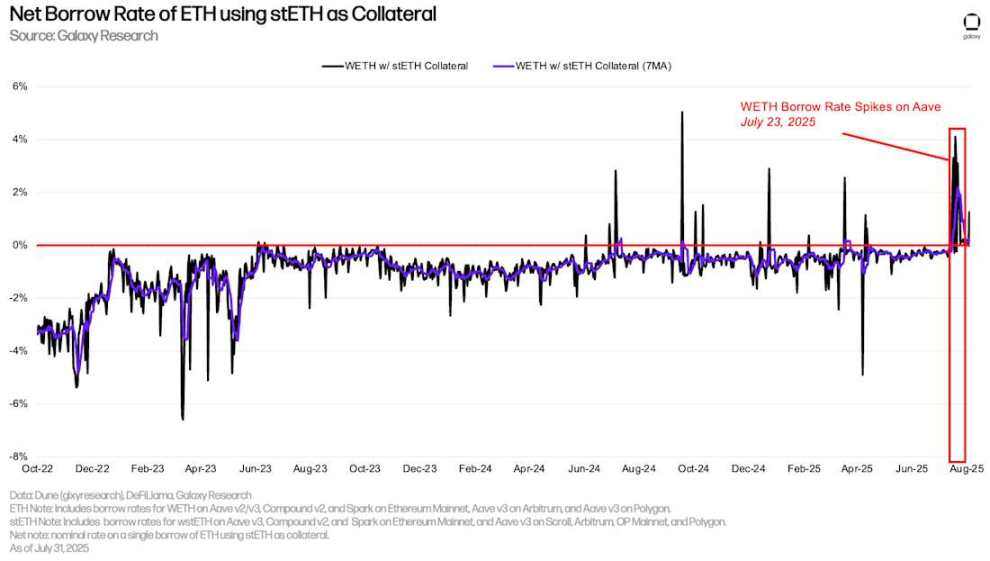
Net borrowing rate for ETH using stETH as collateral
This incident had a knock-on effect on Ethereum's exit queues, with users rushing to close their rotating positions, which requires unstacking ETH from Ethereum's Beacon Chain. At its peak, wait times for ETH unstacking reached nearly 13 days, a new all-time high. This incident on Aave demonstrates that, while uncommon, the DeFi market can have a significant impact on the operation of the blockchain itself.
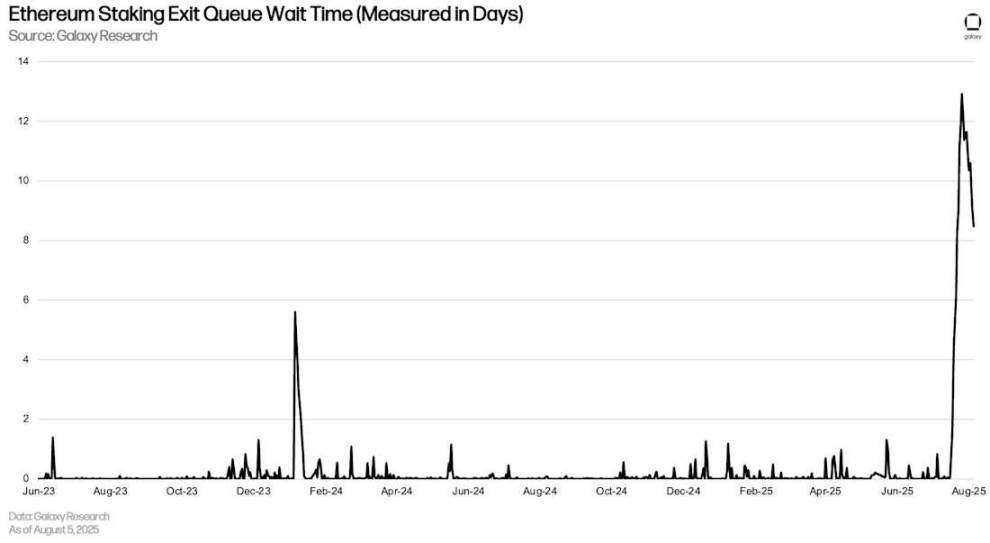
Ethereum staking exit queue waiting time (in days)
ETH OTC interest rate
Similar to Bitcoin, the cost of borrowing ETH through on-chain lending applications is significantly lower than borrowing over-the-counter (OTC). This is primarily driven by two factors: 1) Similar to BTC, there is short-selling demand in the OTC market, which is less common on-chain; and 2) Ethereum's annualized staking rate (APR) provides a floor for OTC borrowing, as suppliers have little incentive to deposit assets with OTC platforms at a rate lower than the APR, or for OTC platforms to lend assets at a rate lower than the APR. Therefore, for ETH, the floor rate for OTC borrowing is typically the APR, while the on-chain APR is typically the cap.
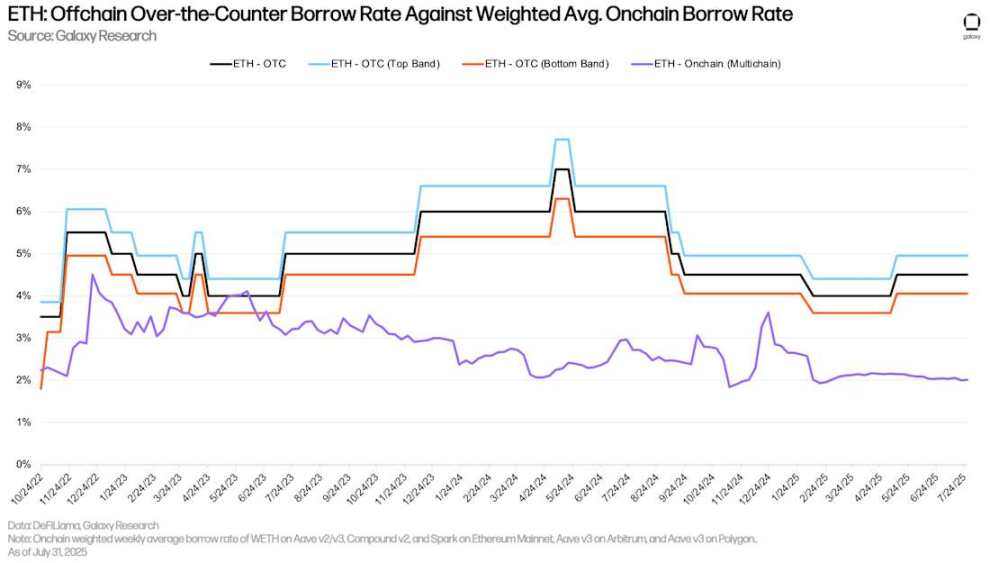
ETH: OTC borrowing rate vs. weighted average on-chain borrowing rate
Corporate Debt Strategies
Digital Asset Reserve Companies (DATCOs) remained a core theme in the second quarter. The rise of Ethereum reserve companies (DATCOs) between March and June became a notable trend within the DATCO space, despite the fact that such entities were less common in the early months. A key difference between some Bitcoin and Ethereum reserve companies is that Bitcoin reserve companies utilize debt financing to purchase assets. In contrast, the large Ethereum reserve companies that have launched in the past few months have relied entirely on private placements in public equity (PIPEs), private placements, online at-the-market offerings (ATMs), and sales of other assets (e.g., selling BTC to purchase ETH) for funding. Therefore, combined with the lack of new debt issuance by Bitcoin DATCOs, the outstanding debt balance of trackable reserve companies remained unchanged at $12.74 billion (including GameStop).
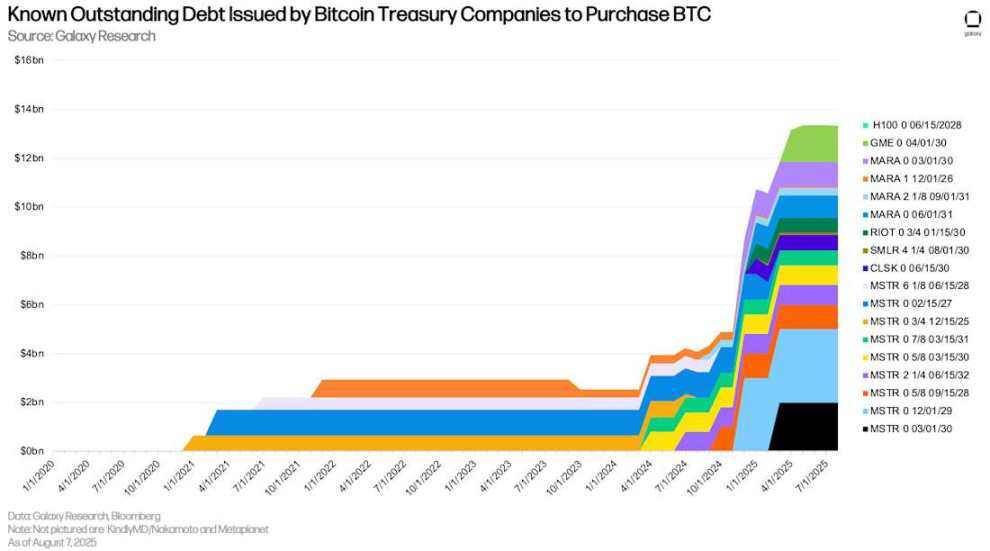
Known outstanding debt issued by Bitcoin Reserve to purchase BTC
With no new debt issuance, DATCOs' debt is consistent in size and maturity. However, June 2028 remains a month to watch, with $3.65 billion in outstanding debt maturing. The first tranche of debt is due in December 2026, 16 months away.
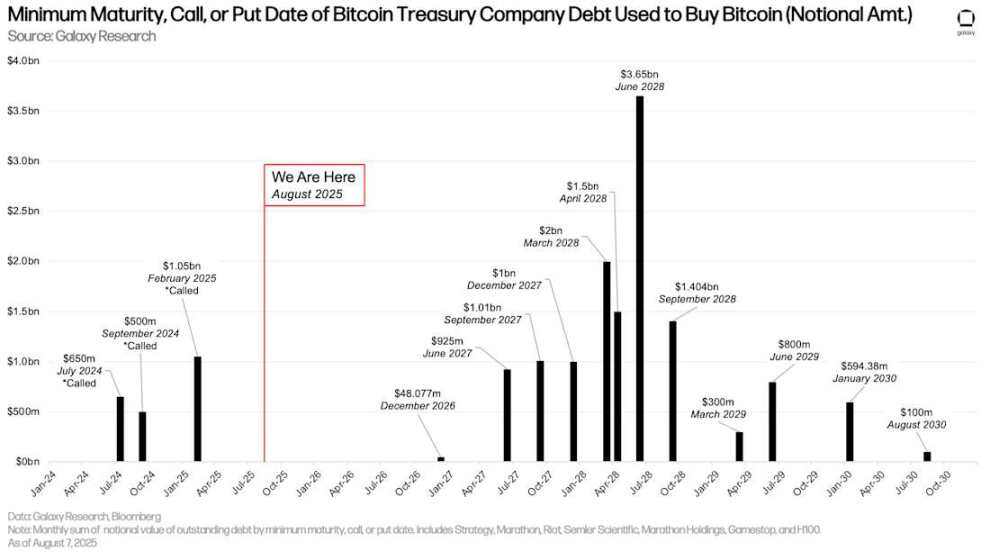
Earliest maturity, redemption, or put date of Bitcoin Reserve's debt used to purchase Bitcoin (notional amount)
Similar to their maturity schedules, DATCOs that issue interest-bearing debt made quarterly interest payments consistent with the previous quarter. Strategy (formerly MicroStrategy) had the highest quarterly interest expense, at $17.5 million.
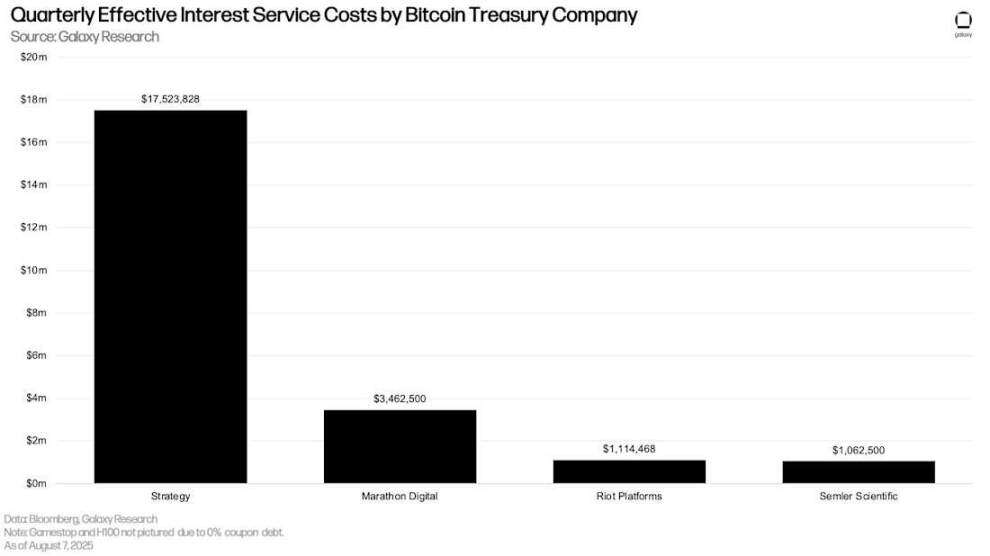
Bitcoin Reserve's actual interest expenses per quarter
futures market
Open interest in futures (including perpetual futures) surged in the second quarter. As of June 30th, total futures open interest across major platforms reached $132.6 billion. This represents a $36.14 billion (+37.47%) increase from the end of the first quarter on March 31st. During the same period, Bitcoin futures open interest increased by $16.85 billion (+34.92%), Ethereum futures open interest increased by $10.54 billion (+58.65%), Solana futures open interest increased by $1.97 billion (+42.82%), and other cryptocurrency futures open interest increased by 38.52%. It's important to note that total open interest doesn't fully reflect the absolute amount of leverage, as some open interest may be offset by long spot positions, allowing traders to maintain delta-neutral exposure to the underlying asset.
Since last quarter, we have added the following futures platforms:
- BingX
- Bitunix
- CoinEx
- Coinbase
- Gate
- KuCoin
- MEXC
- dYdX
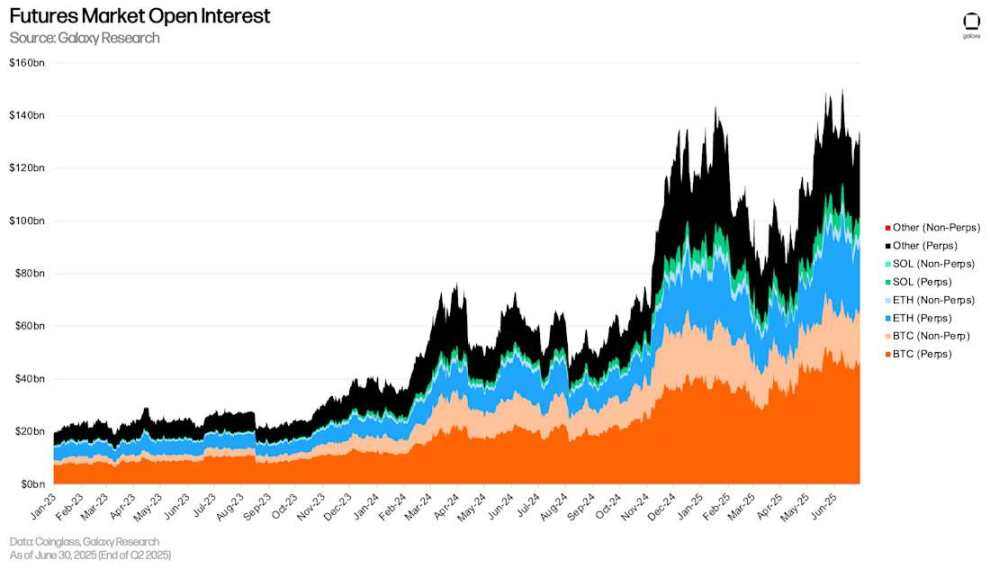
Open interest in the futures market
As of June 30, open interest on the CME (including perpetual and non-perpetual contracts) was 15.48%, up 149 basis points from 13.99% on March 31 and down 58 basis points from January 1. The Chicago exchange's open interest peaked at 19.08% on February 21 and has since fallen 360 basis points.
As of June 30, CME's Ethereum open interest (calculated by dividing CME Ethereum open interest by total market open interest) was 10.77%, up 218 basis points from the end of the first quarter of 2025 and down 118 basis points from January 1, 2025. Similarly, CME's Bitcoin open interest rose 380 basis points to 26.32% in the second quarter, down 152 basis points from the beginning of the year.
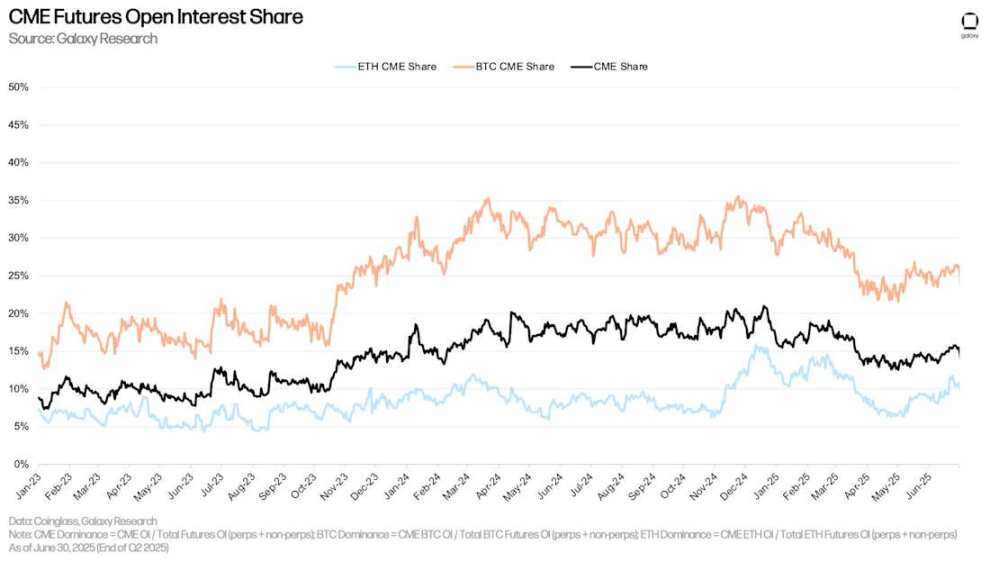
CME futures open interest
Perpetual Futures
As of June 30th, open interest in perpetual futures contracts reached $108.922 billion, up $29.2 billion (+36.66%) from the end of the first quarter. Open interest in perpetual futures contracts was 14.18% lower than its all-time high of $126.7 billion reached on June 10th. As of June 30th, Bitcoin perpetual futures held a 41.77% market share, Ethereum held a 23.13% share, Solana held a 5.88% share, and other assets held a 29.23% share.
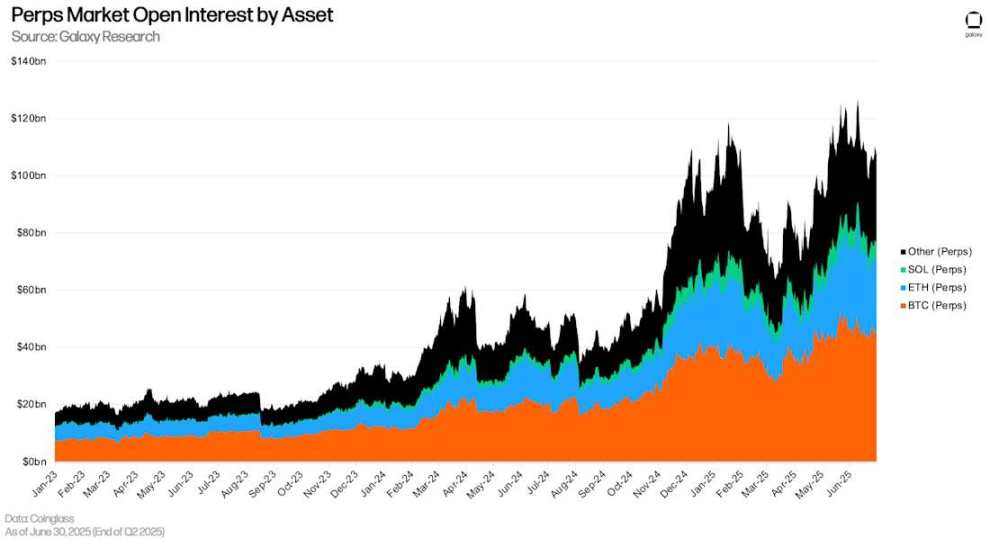
Perpetual Futures Open Interest by Asset
As of June 30, the proportion of open interest in perpetual futures contracts was 82.02%, down 231 basis points from the end of the first quarter.
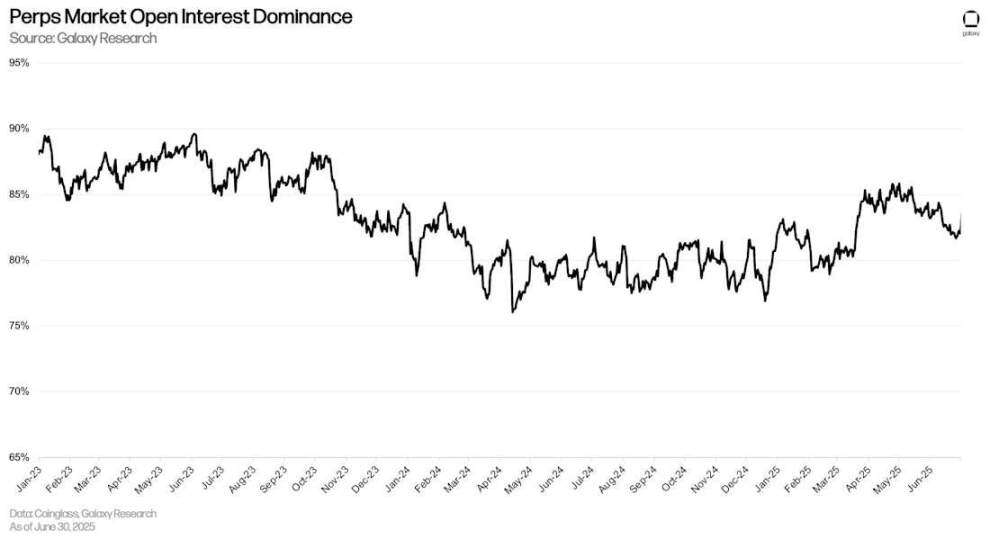
Perpetual futures open interest ratio
Binance holds the largest share of the perpetual futures market, accounting for 20.83% of open interest. This is followed by Bybit (15.41%) and Gate (12.85%). As of the end of the second quarter, Hyperliquid's open interest was $7.516 billion, representing 6.91% of the total perpetual futures market.
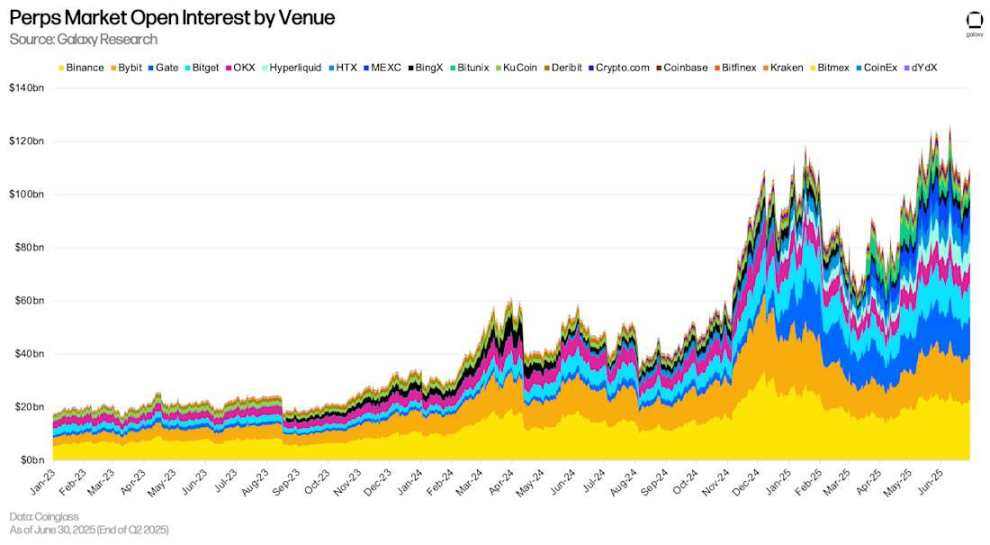
Perpetual Futures Open Interest by Platform
in conclusion
Leverage in the system continues to expand to new highs, with on-chain borrowing reaching all-time highs and overall crypto-collateralized lending reaching multi-year highs. This growth is driven by factors including: a reflexive relationship between lending activity and price increases; reserve companies leveraging up as a significant new source of demand; and the expansion of new, capital-efficient collateral in DeFi. This trend is also evident in futures markets, where open interest has also seen significant growth.
Looking ahead, continued collaboration among DeFi participants and the optimization of new collateral types suggest that the DeFi lending market is expected to continue growing in the coming quarters. Meanwhile, CeFi lending is also benefiting from the support of reserve companies and the overall market optimism.


