Original title: "Nearly 10 billion selling pressure on the market remains unchanged, Bitcoin is heading towards 140,000? "
Original author: UkuriaOC, CryptoVizArt, Glassnode
Original translation: AididiaoJP, Foresight News
Bitcoin's liquidity experienced a significant test last weekend, with an early investor selling over 80,000 BTC through Galaxy Digital's over-the-counter trading service. Despite this, the market has proven resilient, with the vast majority of investors opting to hold onto their holdings rather than book profits.
Executive Summary
Bitcoin faced significant liquidity challenges last weekend, with a major early investor selling over 80,000 BTC through Galaxy Digital's over-the-counter (OTC) service. While this $9.6 billion sell-off put upward pressure on the market, the market quickly absorbed the massive selling pressure, causing the price to briefly dip to $115,000 before quickly stabilizing at $119,000, just below its all-time high.
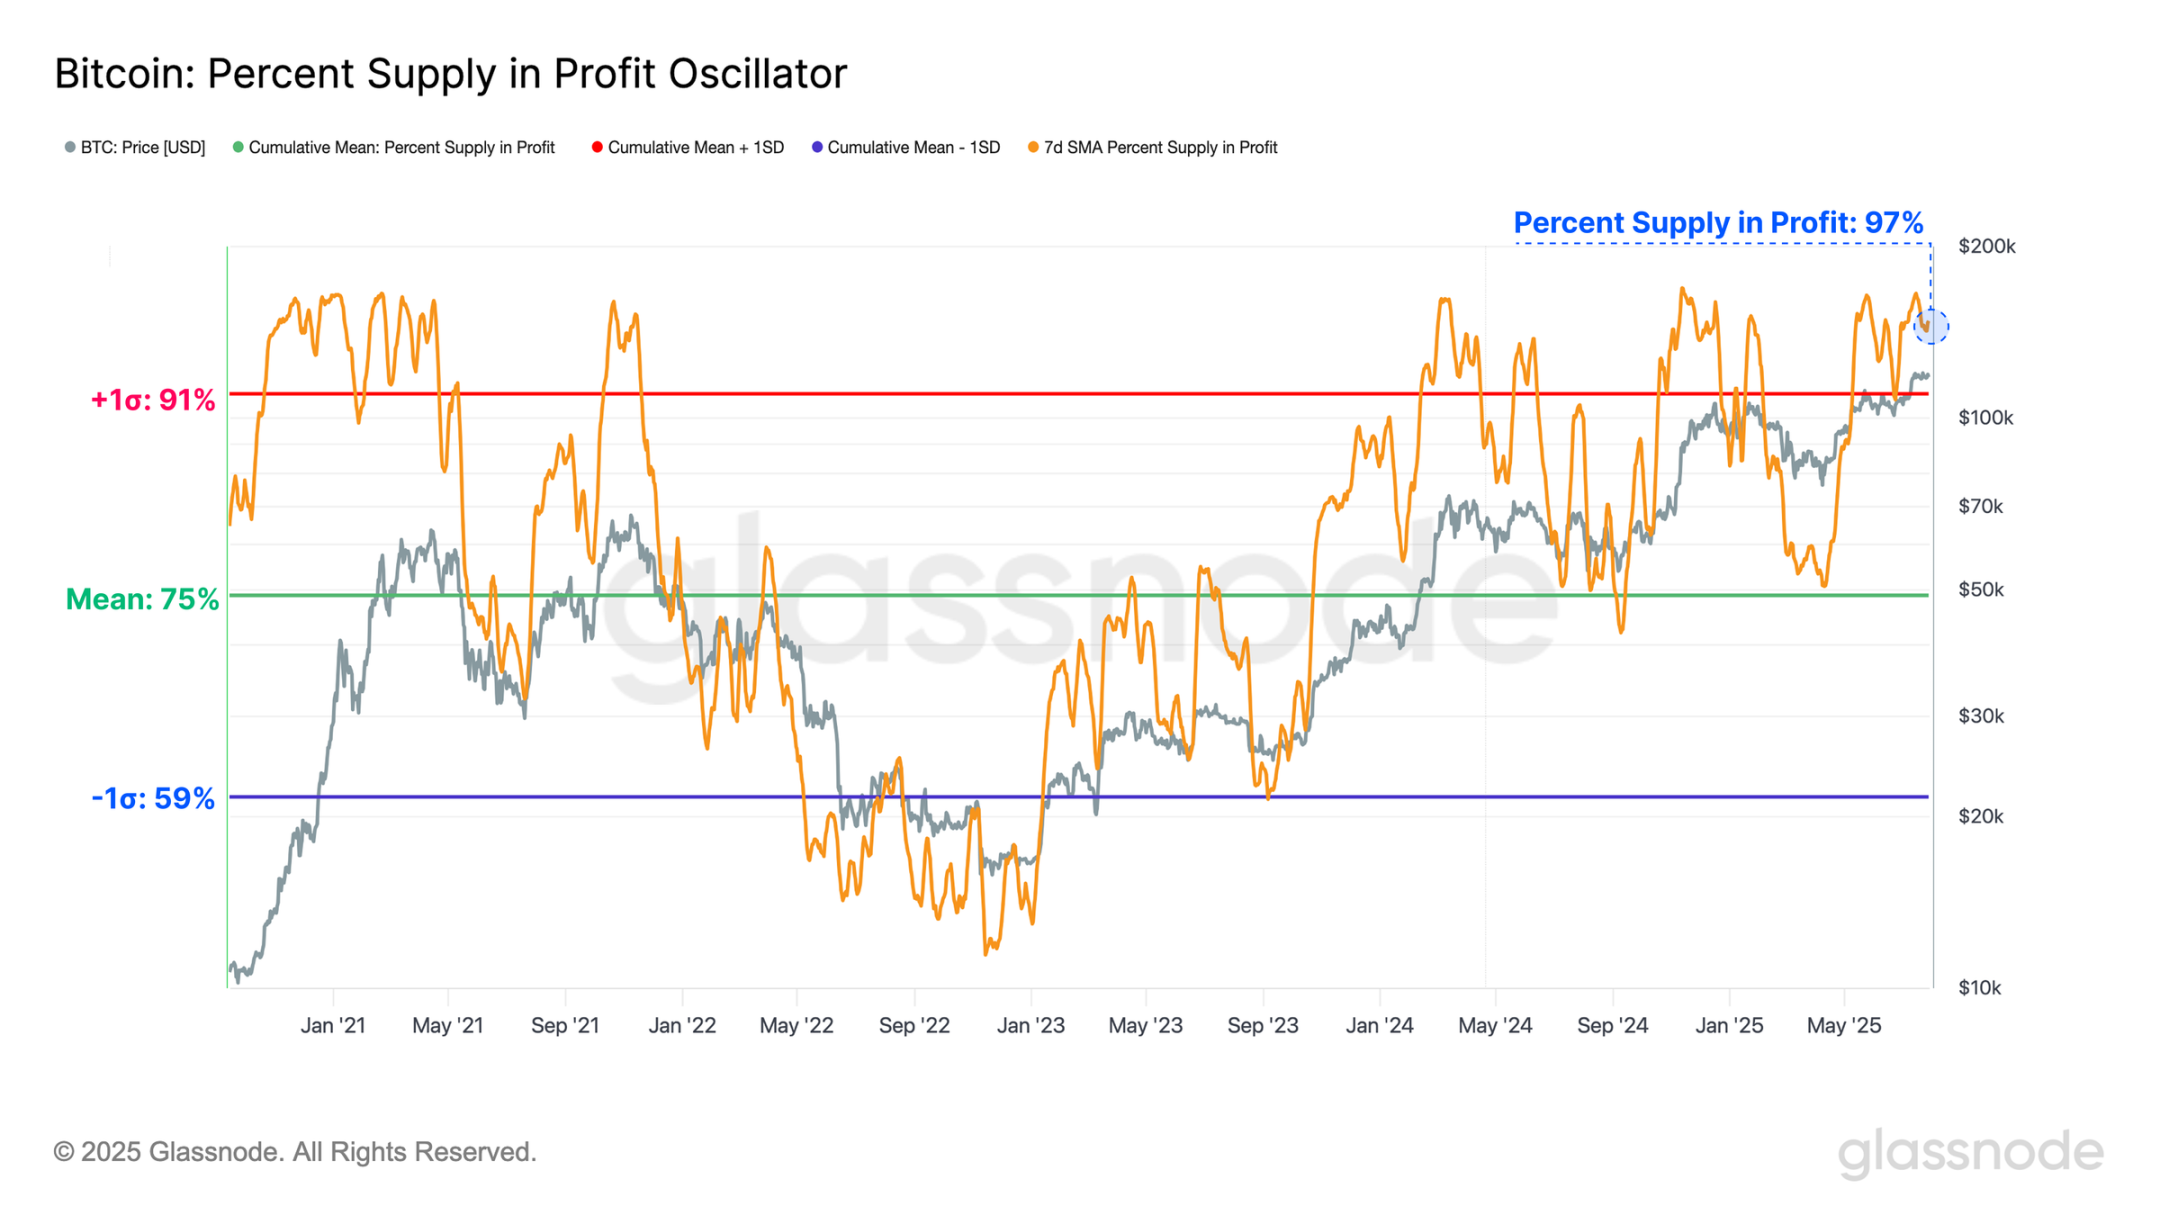
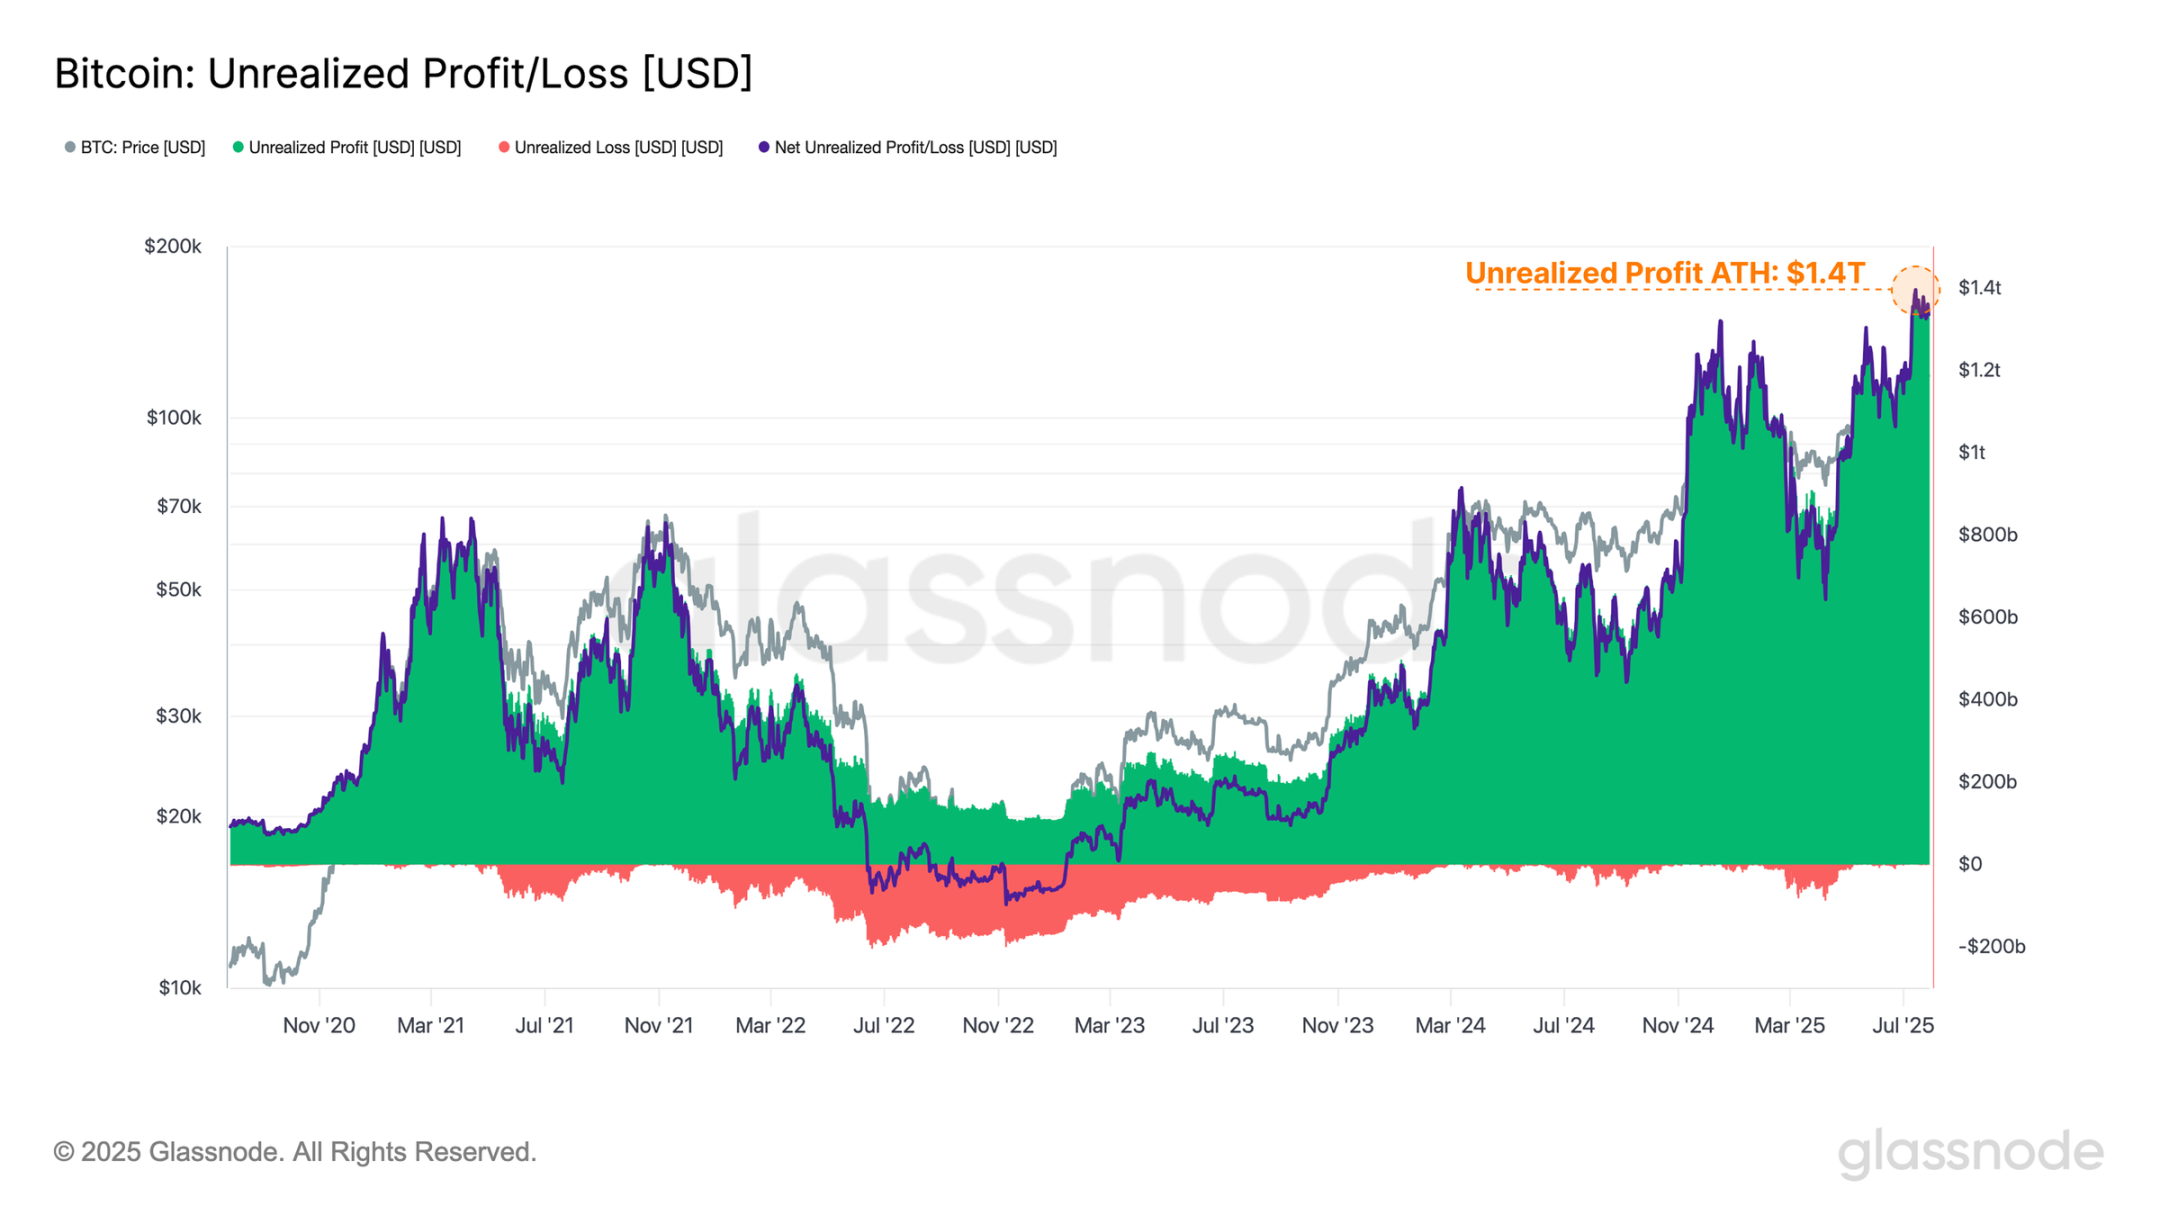
Even after such a massive sell-off, market participants are still sitting on significant unrealized profits, currently totaling $1.4 trillion, with 97% of the circulating supply still in profit.
According to multiple on-chain valuation models, Bitcoin's price is currently range-bound between $105,000 and $125,000. A breakout could push the price higher to $141,000, where significant selling pressure is expected given the significant amount of unrealized profit taking expected.
Deep Liquidity
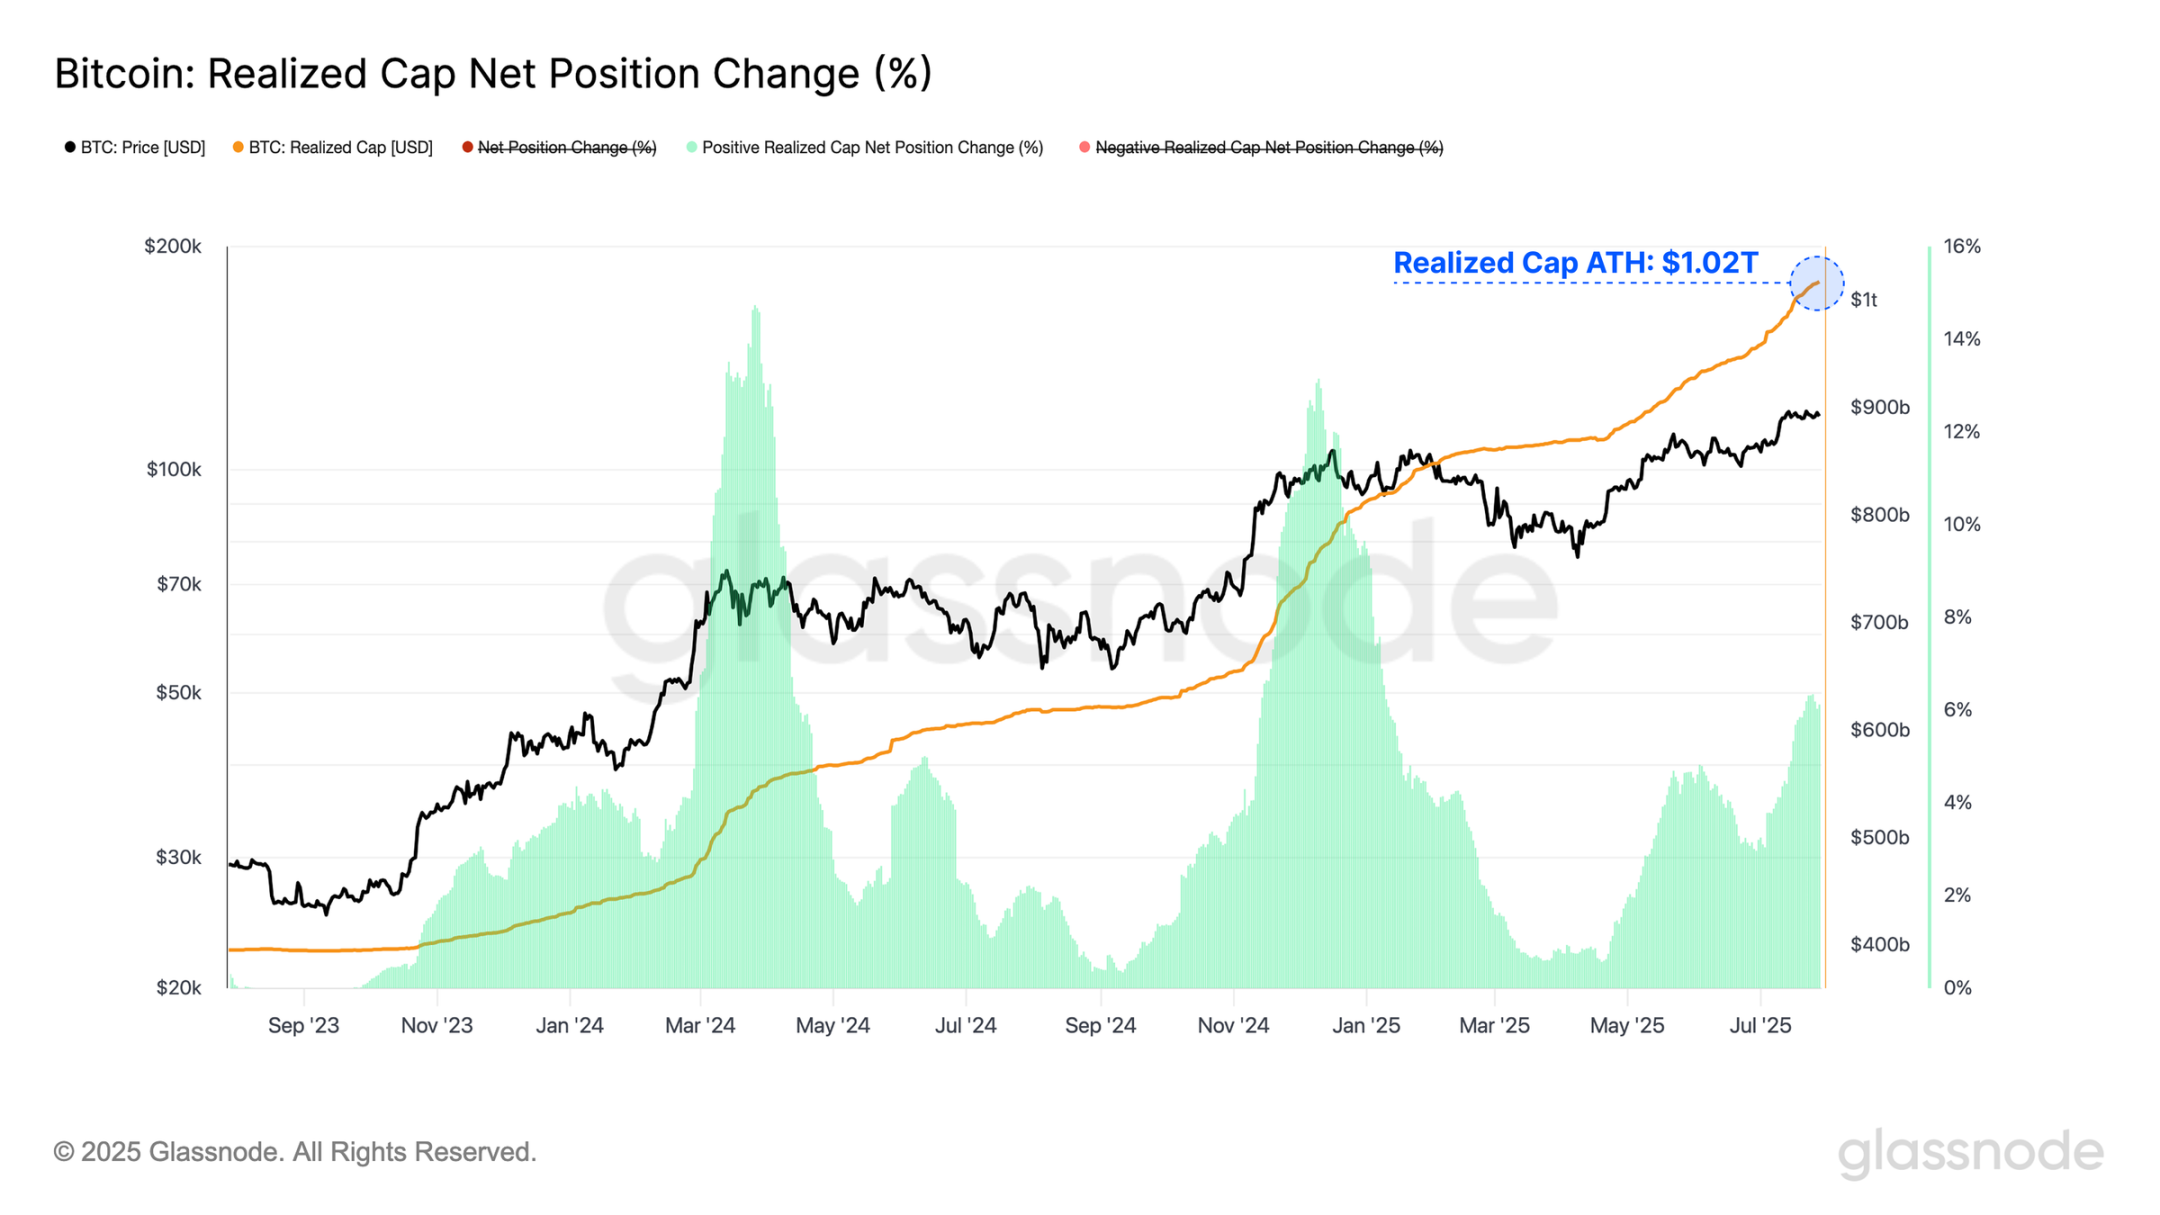
Realized Cap, a fundamental on-chain metric used to quantify the total USD-denominated liquidity in the Bitcoin network, has surpassed $1.02 trillion, highlighting the asset's growing liquidity depth and market thickness.
This liquidity was put to the test last weekend when an early Bitcoin investor sold 80,000 BTC (approximately $9.6 billion) through Galaxy Digital's services, likely through a mix of market sell-offs and over-the-counter transactions. The resulting selling pressure pushed the price down to $115,000 before stabilizing at $119,000.
The event highlighted Bitcoin’s ability to absorb significant selling even during weekend trading hours, when liquidity is typically thin, and underscored the robustness of its market structure.
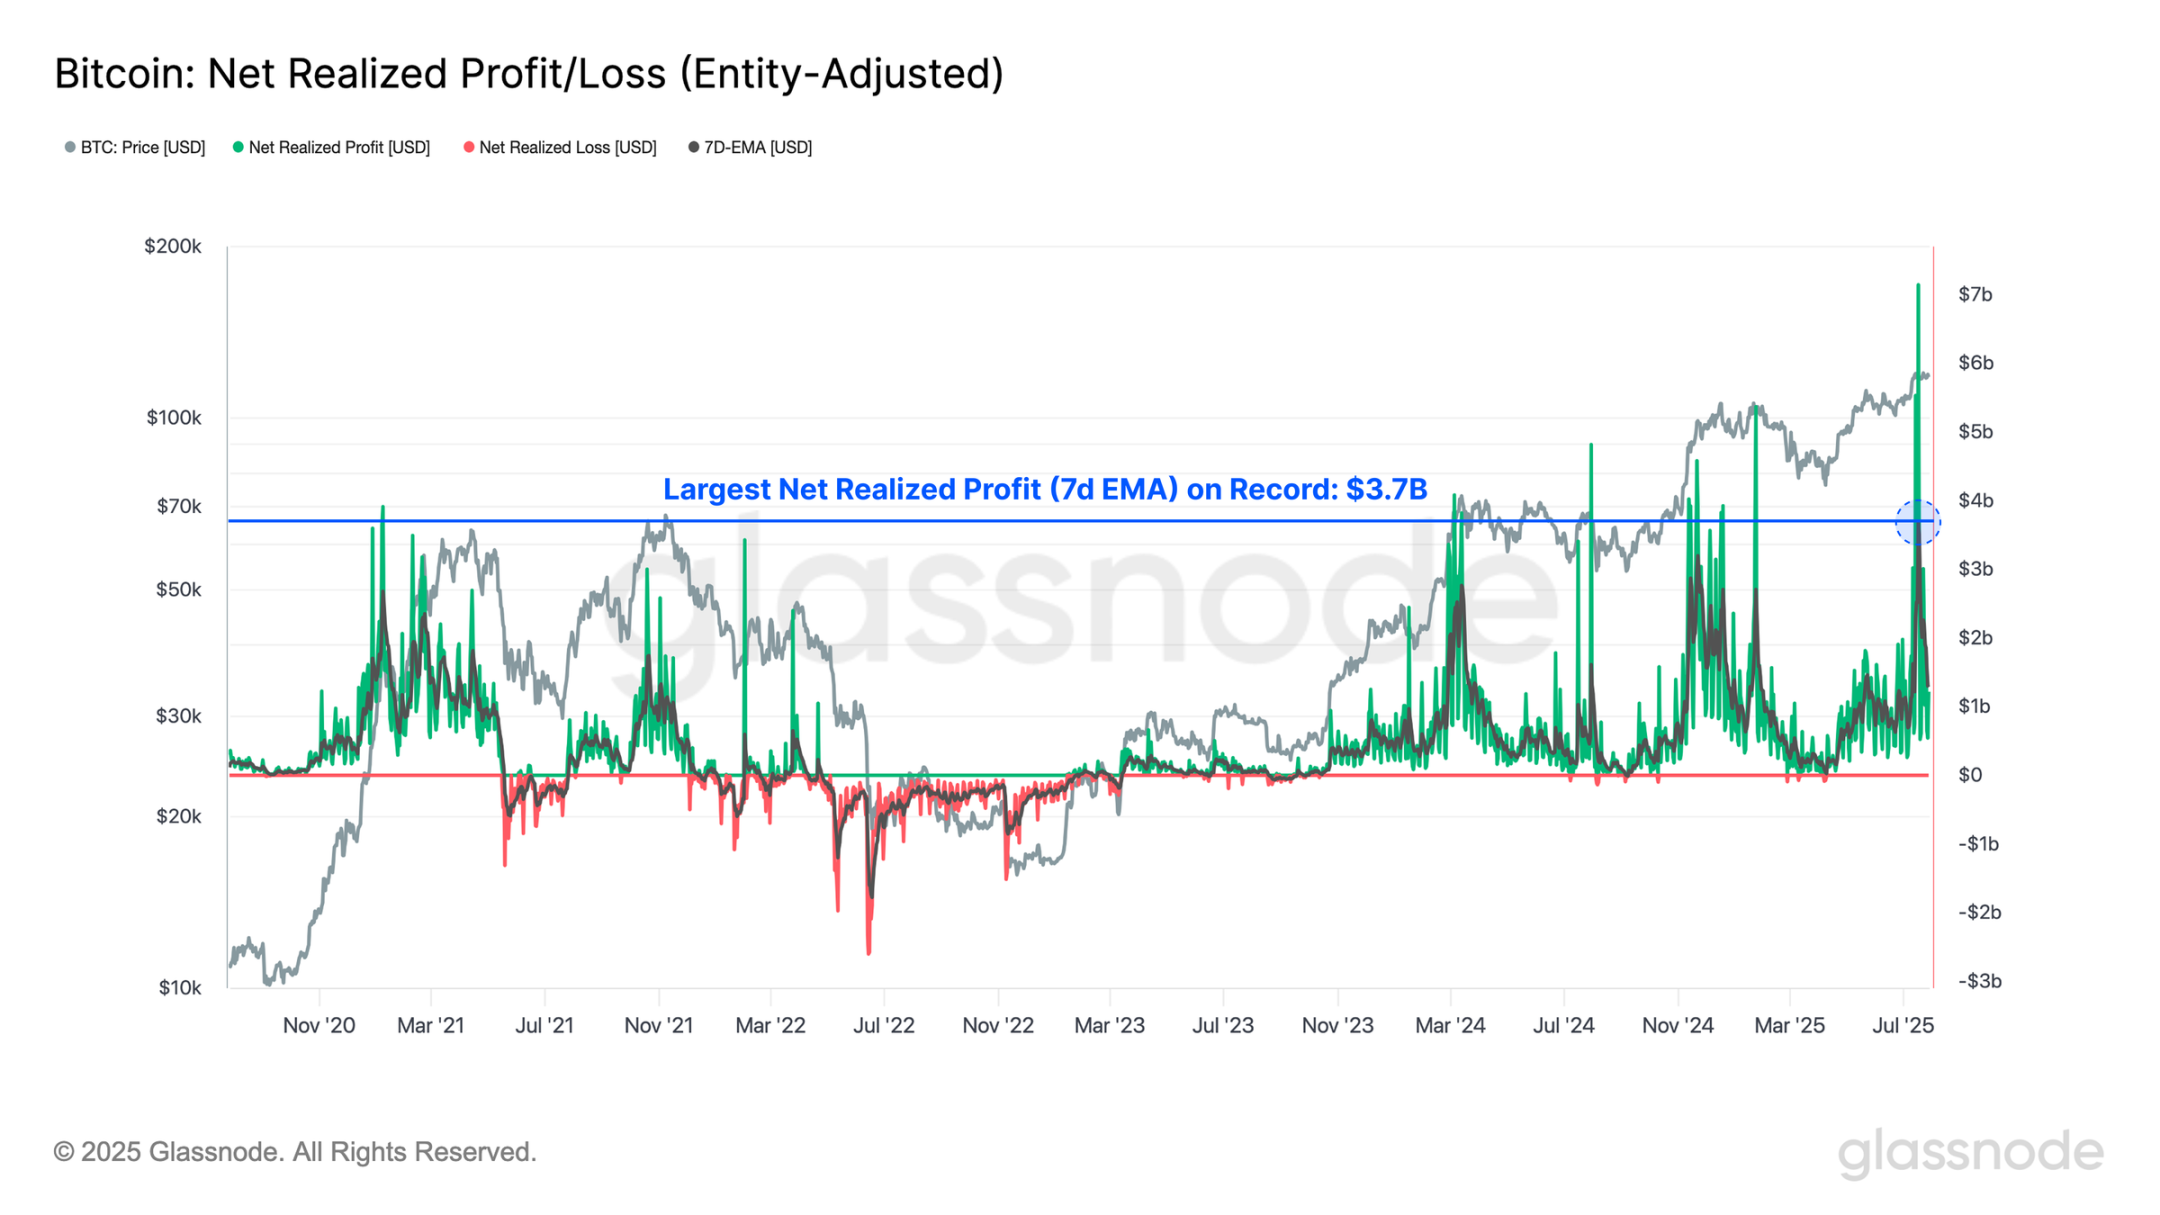
The event also pushed the Net Realized Profit/Loss indicator (NRP/Loss) to a record high of $3.7 billion. Notably, the surge in this indicator preceded the weekend sell-off, reflecting the early movement of funds before final distribution.
Because this batch of tokens was initially marked as an internal transfer by the entity’s adjustment algorithm, subsequent address changes through Galaxy Digital were recorded as economically significant transactions, i.e., changes in ownership.
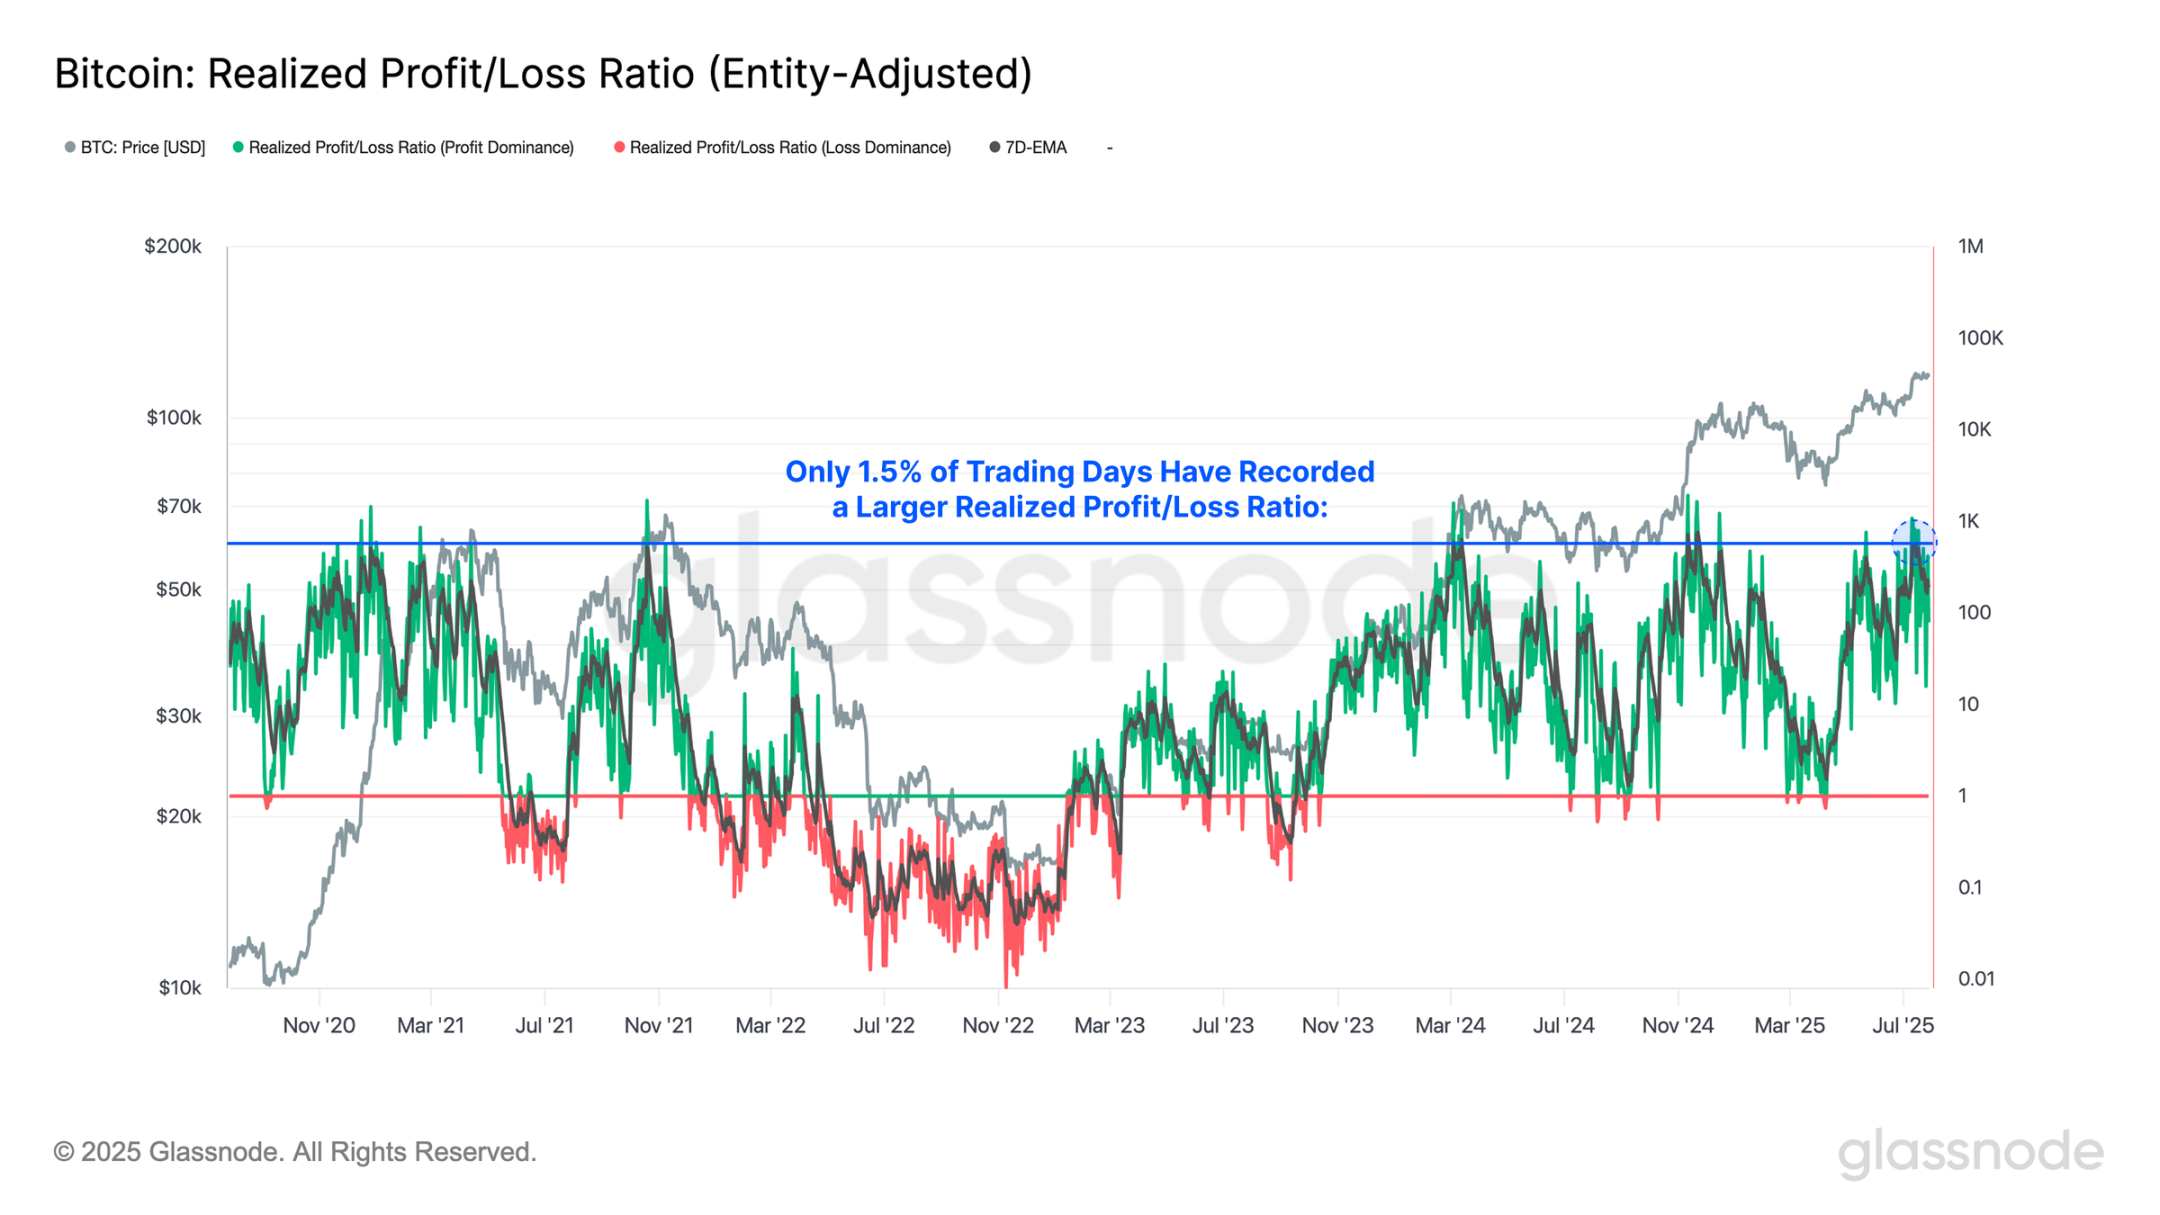
The recent surge in profit-taking has driven a sharp acceleration in the Realized Profit/Loss Ratio, with realized profits now exceeding losses by 571 times. This is an extremely high level, with only 1.5% of trading days historically exceeding this level.
However, caution is advised when interpreting this signal. While extreme profit-taking can accompany price tops (as seen at the all-time high of $73,000 in March 2024), this isn't an immediate reaction. For example, when the price broke through $100,000 in late 2024, profit-taking peaked at $98,000, yet the market continued to rise 10% to $107,000 before peaking.
This lag means that a significant increase in profit-taking often foreshadows (but does not immediately cause) a market breakdown. It creates supply pressures that take time to digest, and the market may react with a lag.
Holding period analysis
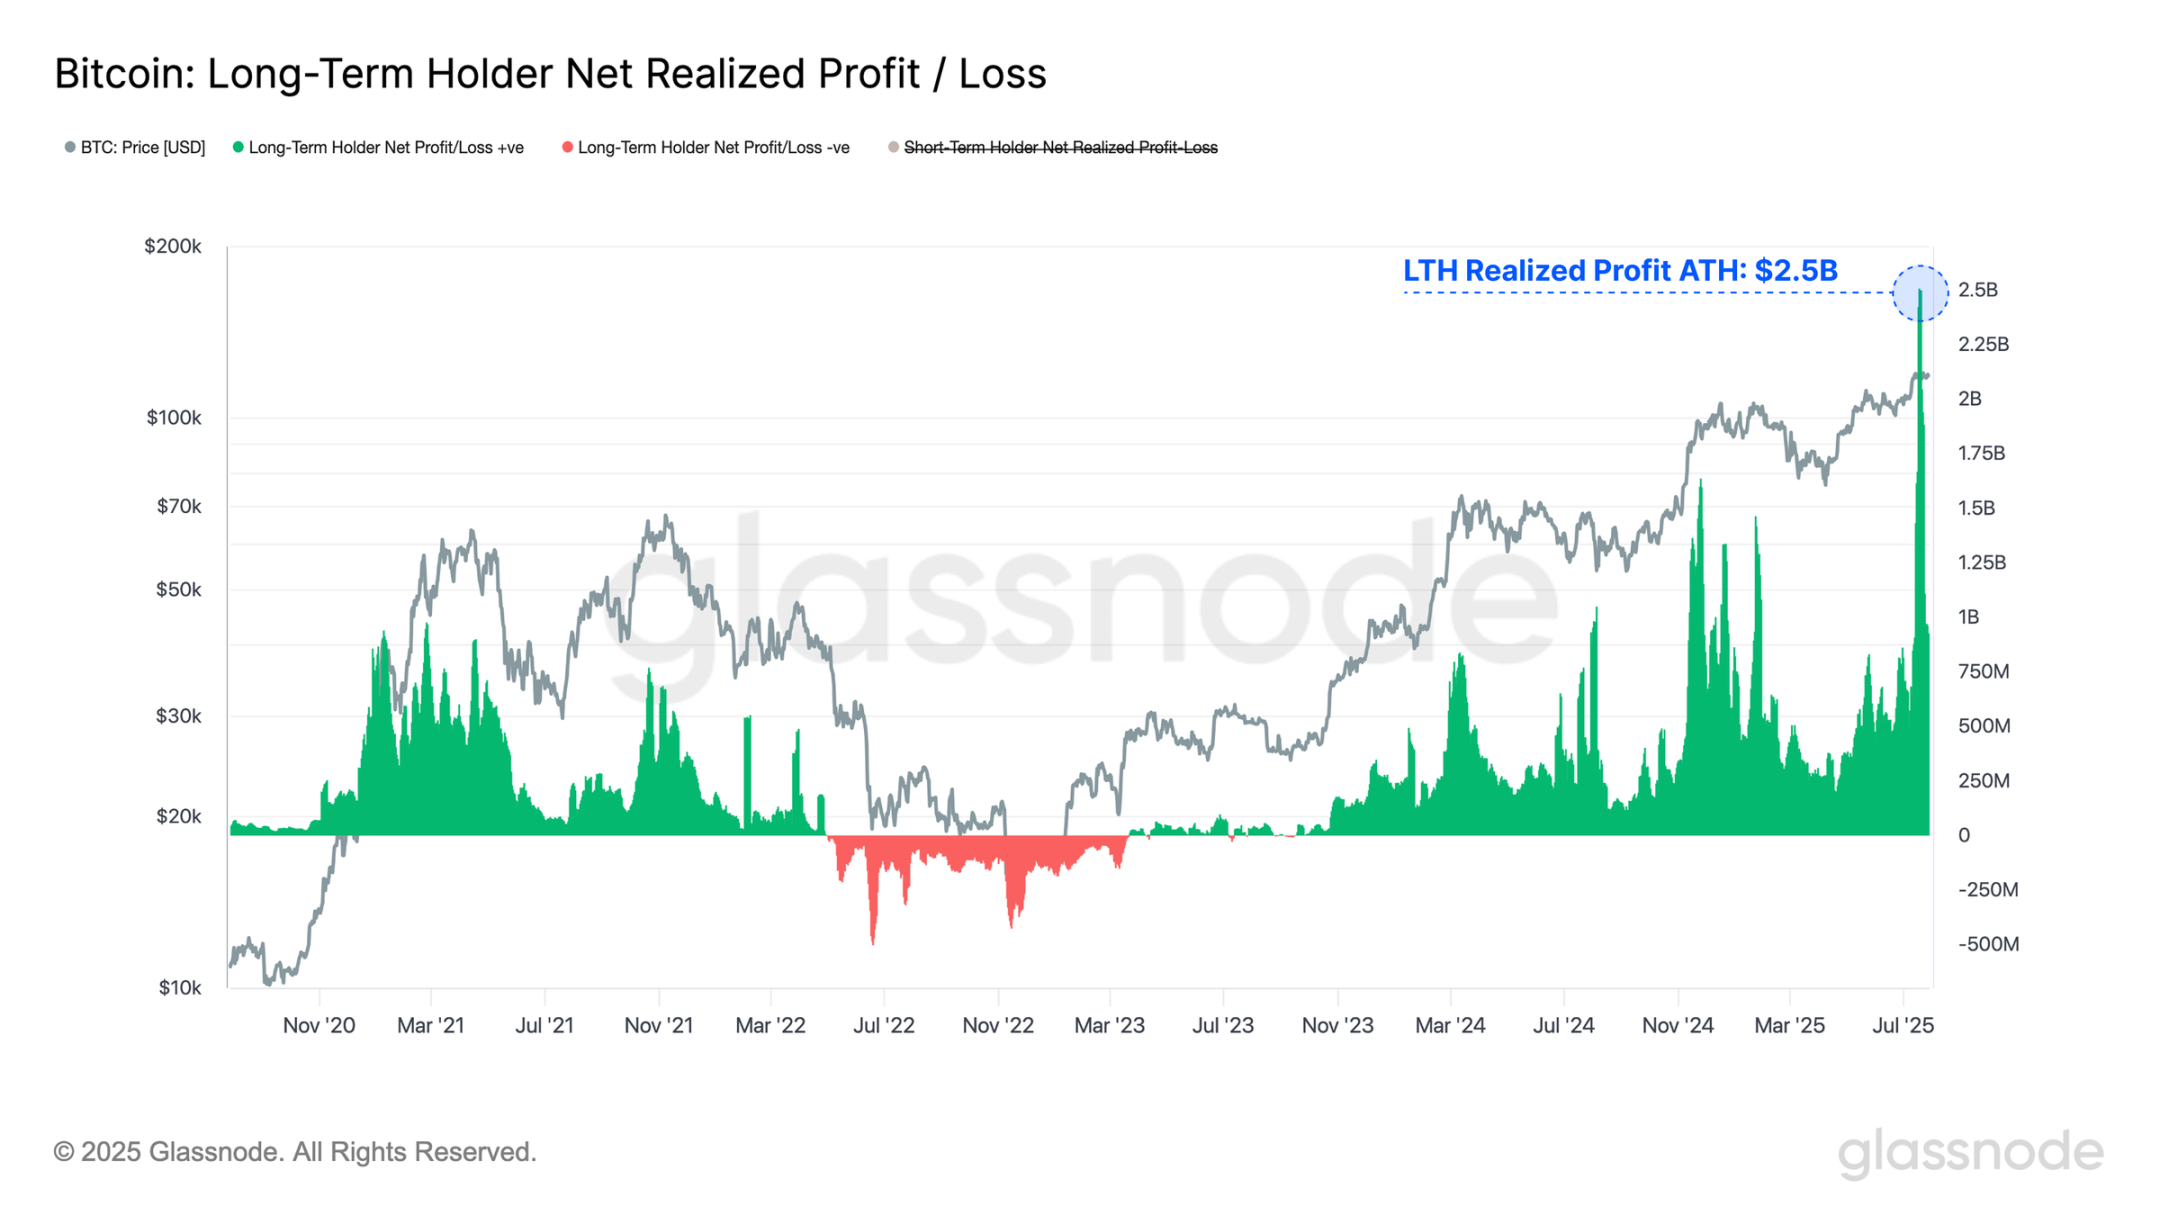
After digesting a large number of long-dormant tokens, long-term holders' net realized profit/loss (LH) reached a new all-time high of $2.5 billion, surpassing the previous peak of $1.6 billion. This marked the largest single sell-off in Bitcoin's history, an extreme liquidity stress test. However, the market demonstrated remarkable resilience, with prices remaining stable and fluctuating near all-time highs.
This further demonstrates the Bitcoin market’s remarkable ability to withstand significant pressure during major distribution events, having previously witnessed tests such as the Mentougou compensation and the German government sell-off during this cycle.
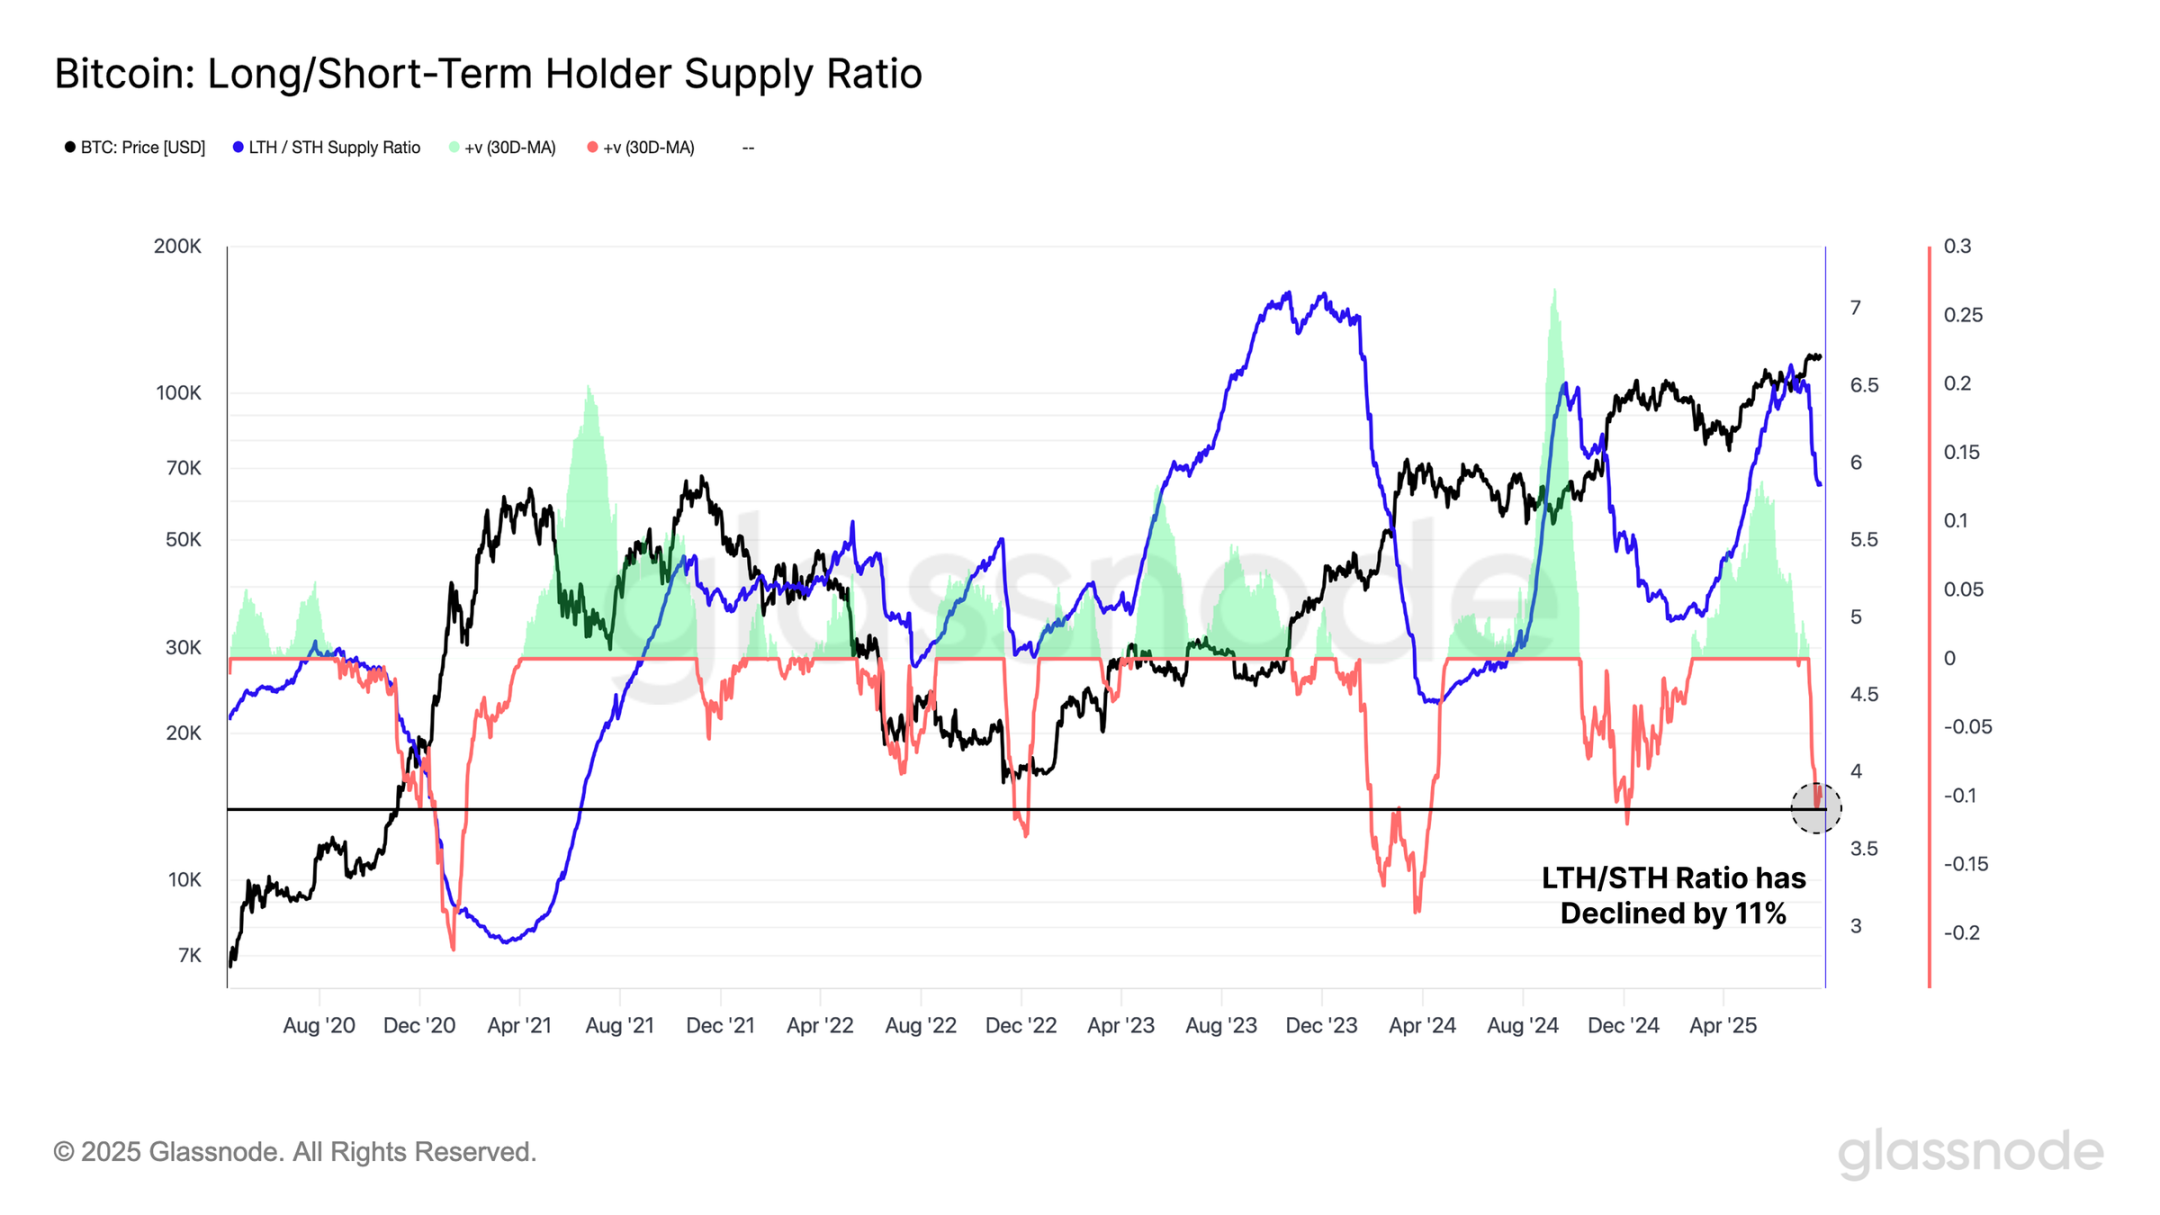
Comparing the supply ratios of long-term and short-term holders reveals a common pattern across all three all-time highs of this cycle: an initial accumulation phase is always followed by a sharp shift toward aggressive allocation.
As the current distribution phase continues, the LTH/STH supply ratio continues to shrink. Over the past 30 days, the ratio has fallen 11%, with only 8.6% of trading days experiencing a more dramatic decline, highlighting the magnitude of the shift in investor behavior.
Unrealized profit analysis
Despite significant selling pressure over the weekend, including significant profit-taking by long-term investors, the Bitcoin market has remained remarkably stable. As a result, the vast majority of participants remain in significant unrealized profits, with 97% of the circulating supply currently held below the spot price.
The total amount of paper gains (i.e., unrealized profits) held by market participants recently hit a record high of $1.4 trillion. This indicates that most investors are sitting on significant unrealized profits, which could trigger potential selling pressure in the future if prices continue to rise.
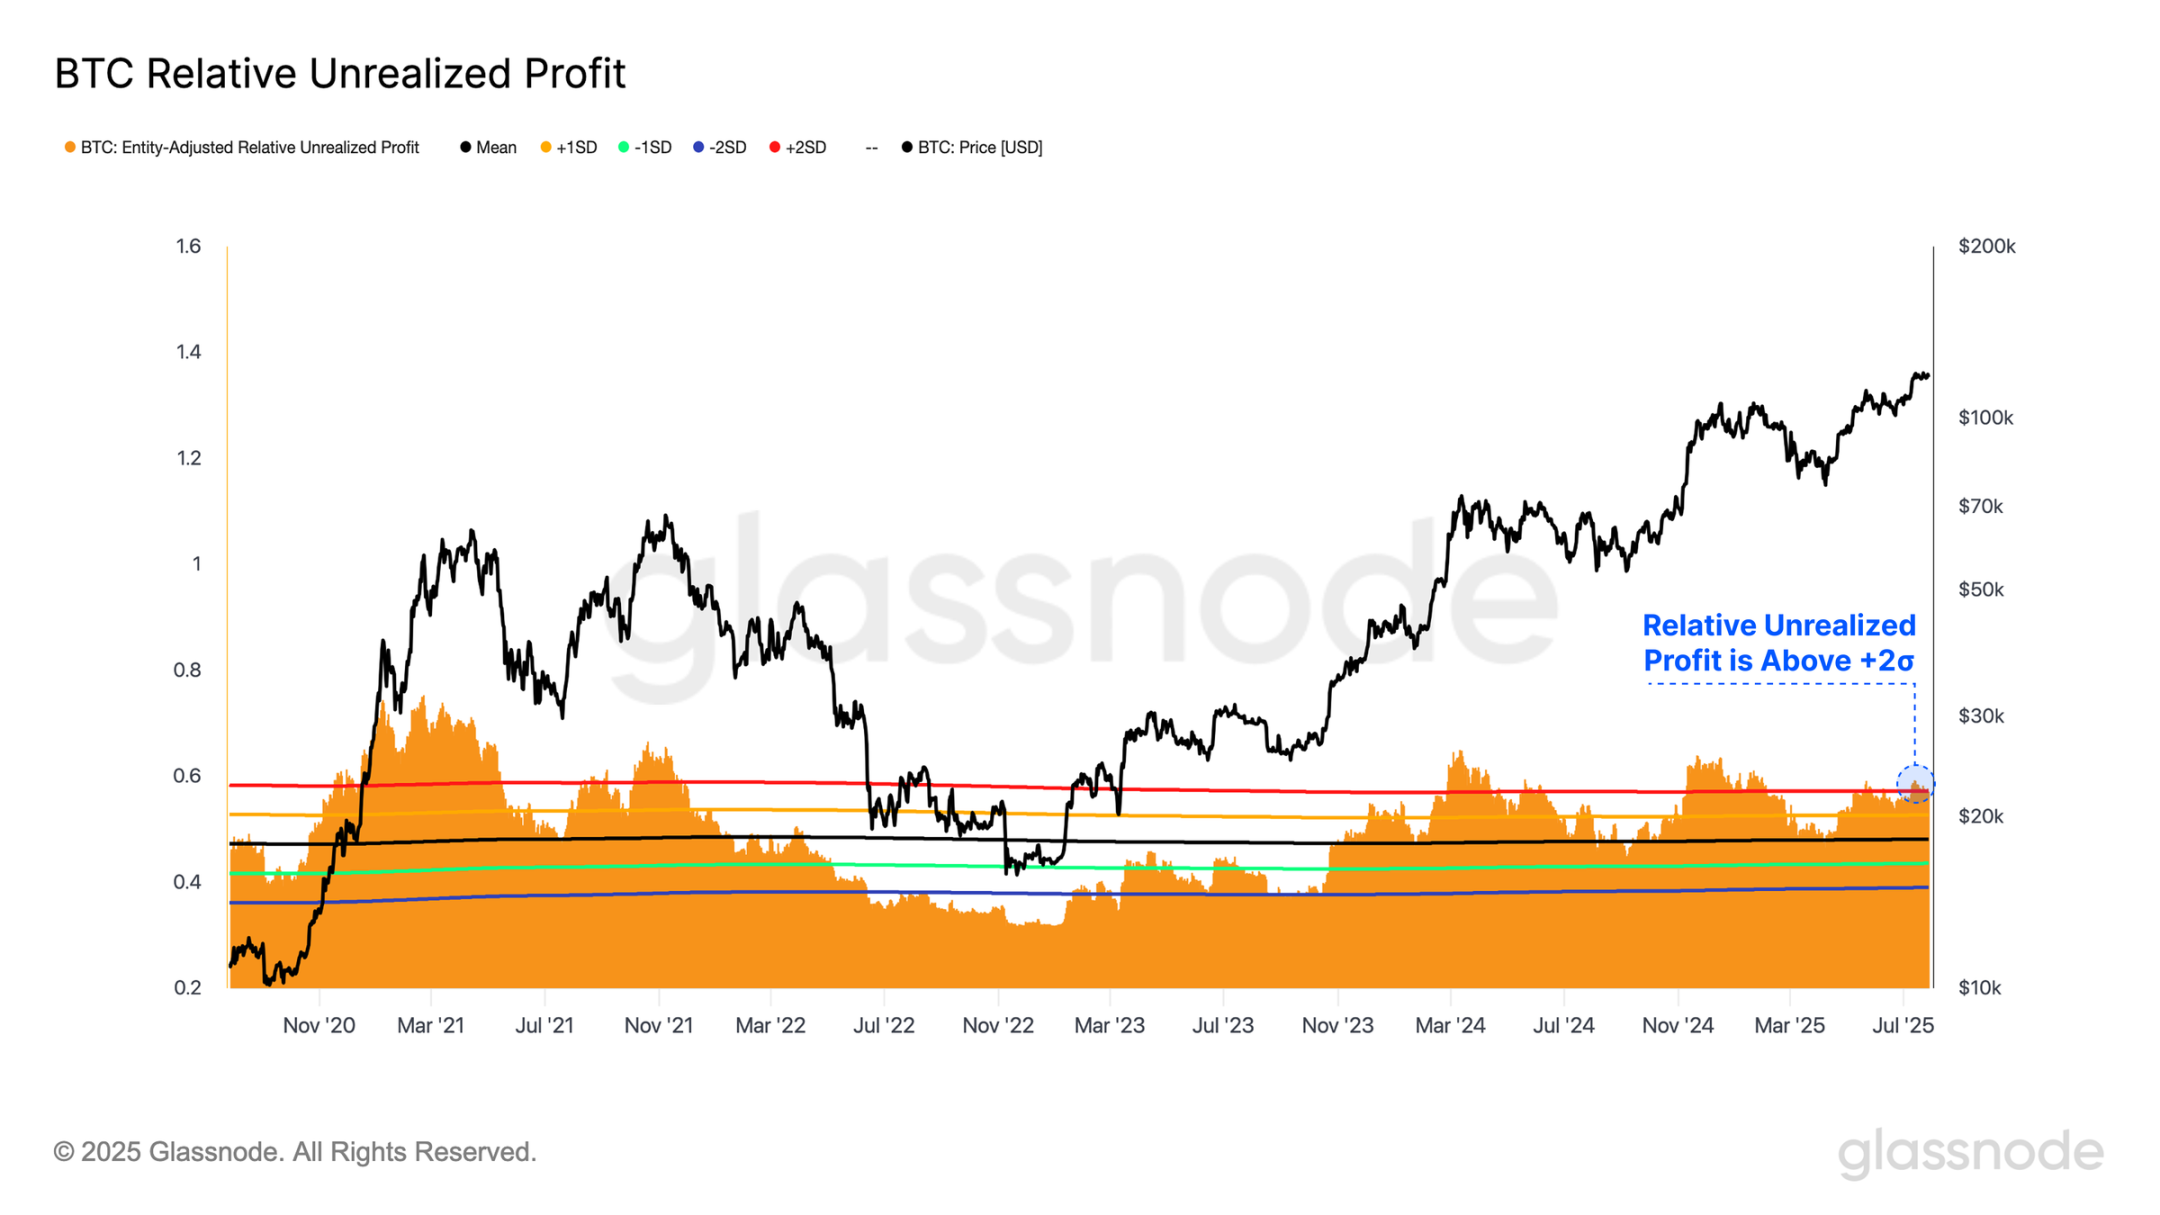
We can also observe the market capitalization ratio of unrealized profits as a standardized indicator. Currently, this indicator has once again broken through the +2σ range, a level that historically coincides with market euphorias and historical top formations. This, from a standardized perspective, further confirms the reality that participants are holding significant unrealized profits.
This suggests that many investors are optimistic about market conditions, which is both a sentiment booster and means that subsequent profit-taking motivation may increase.
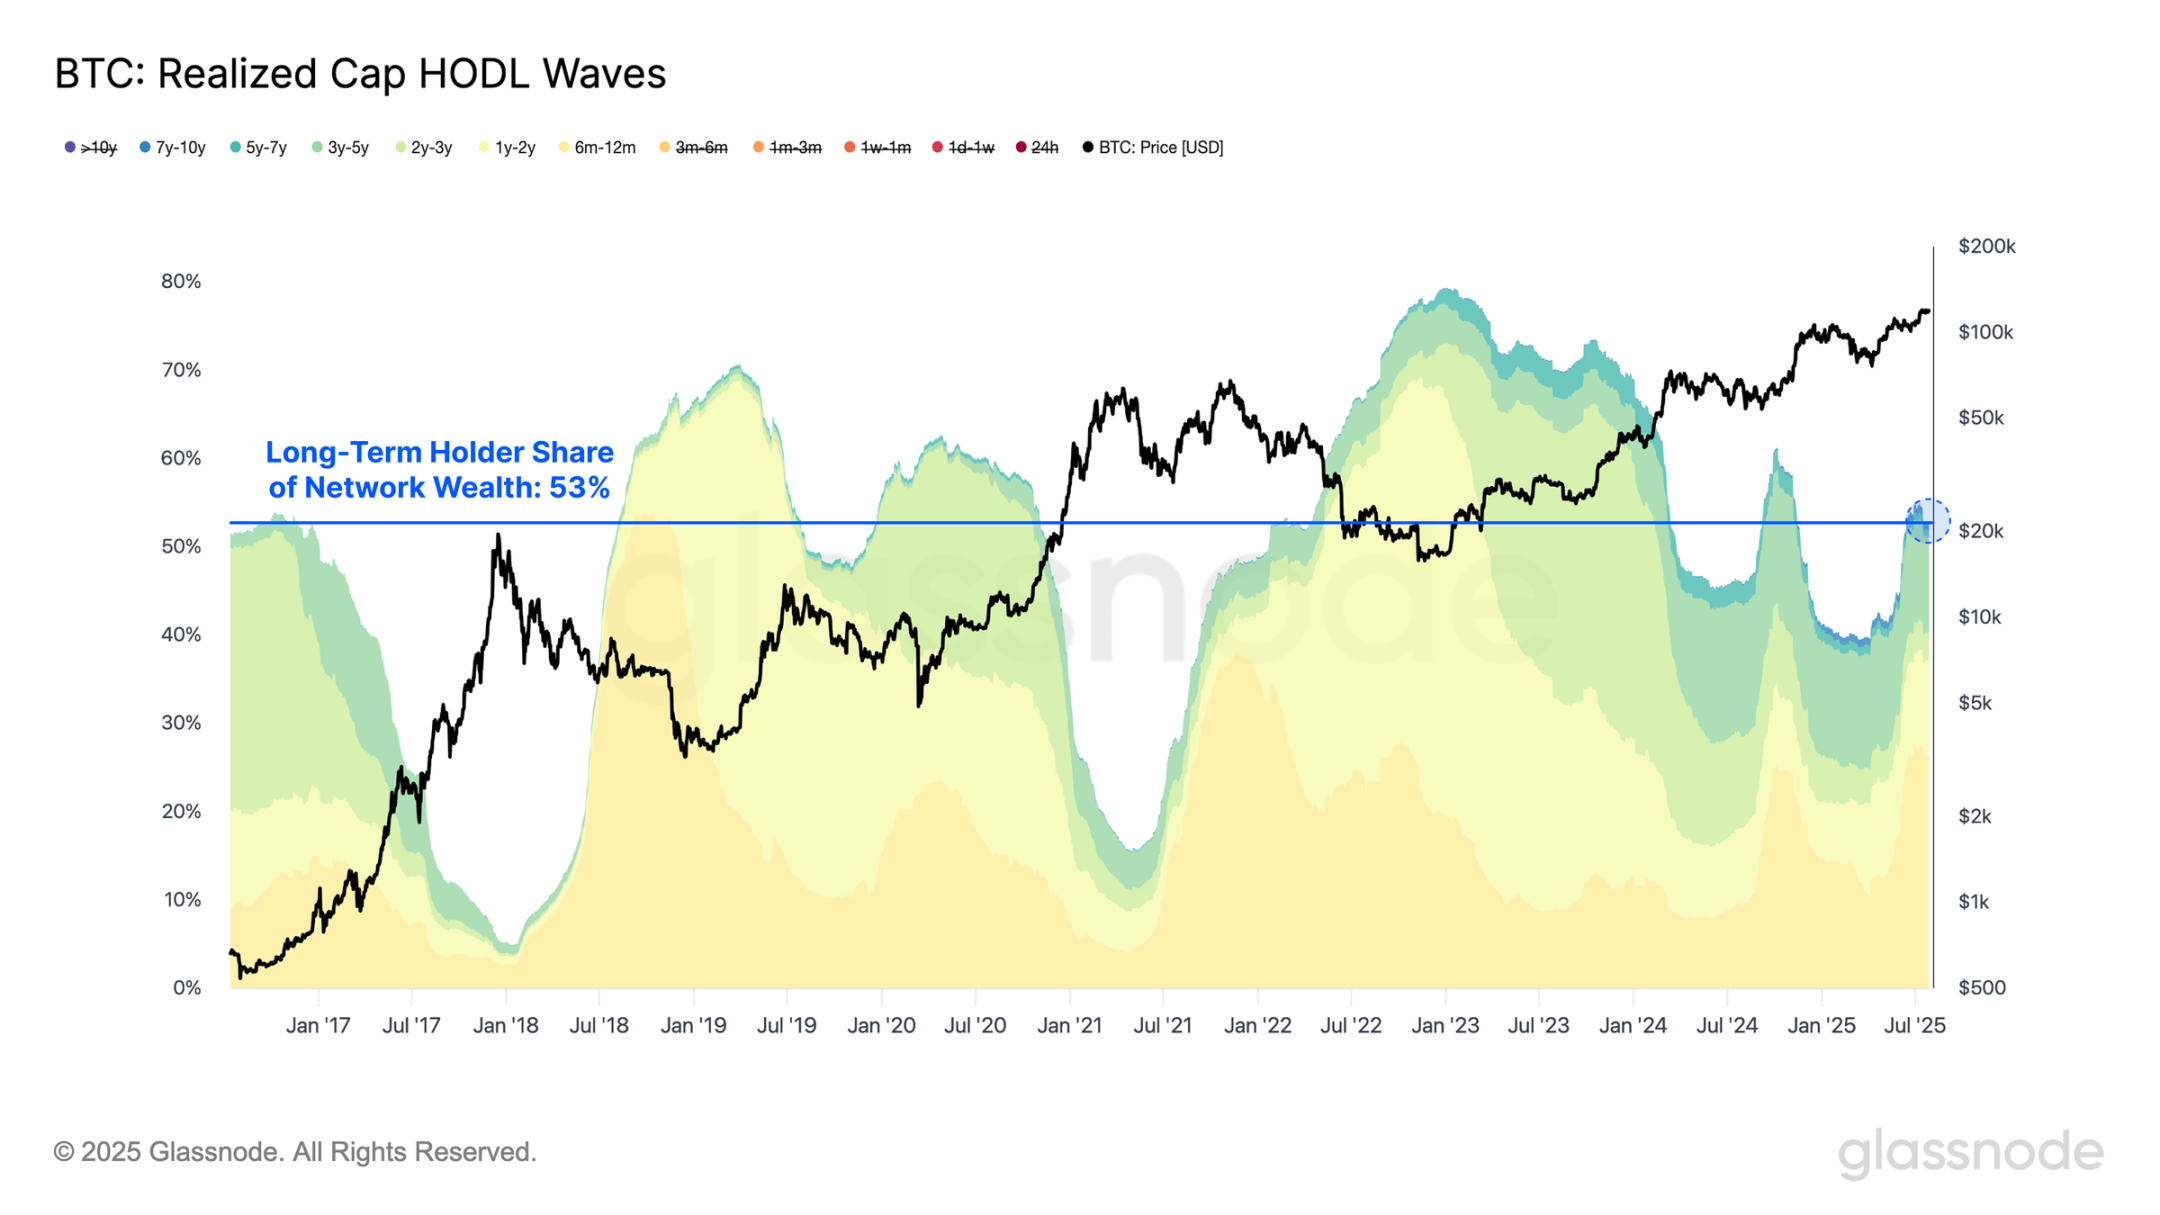
Unlike previous cycles, long-term holders still control 53% of the wealth. While this group has continued to distribute during this cycle, this proportion remains significant given the high level of unrealized profits.
The overall dynamics suggest that long-term holders may still have further to sell. As prices rise to levels that are attractive enough to activate deeply dormant whale tokens, the market needs more demand to absorb the selling pressure.
Market cost analysis
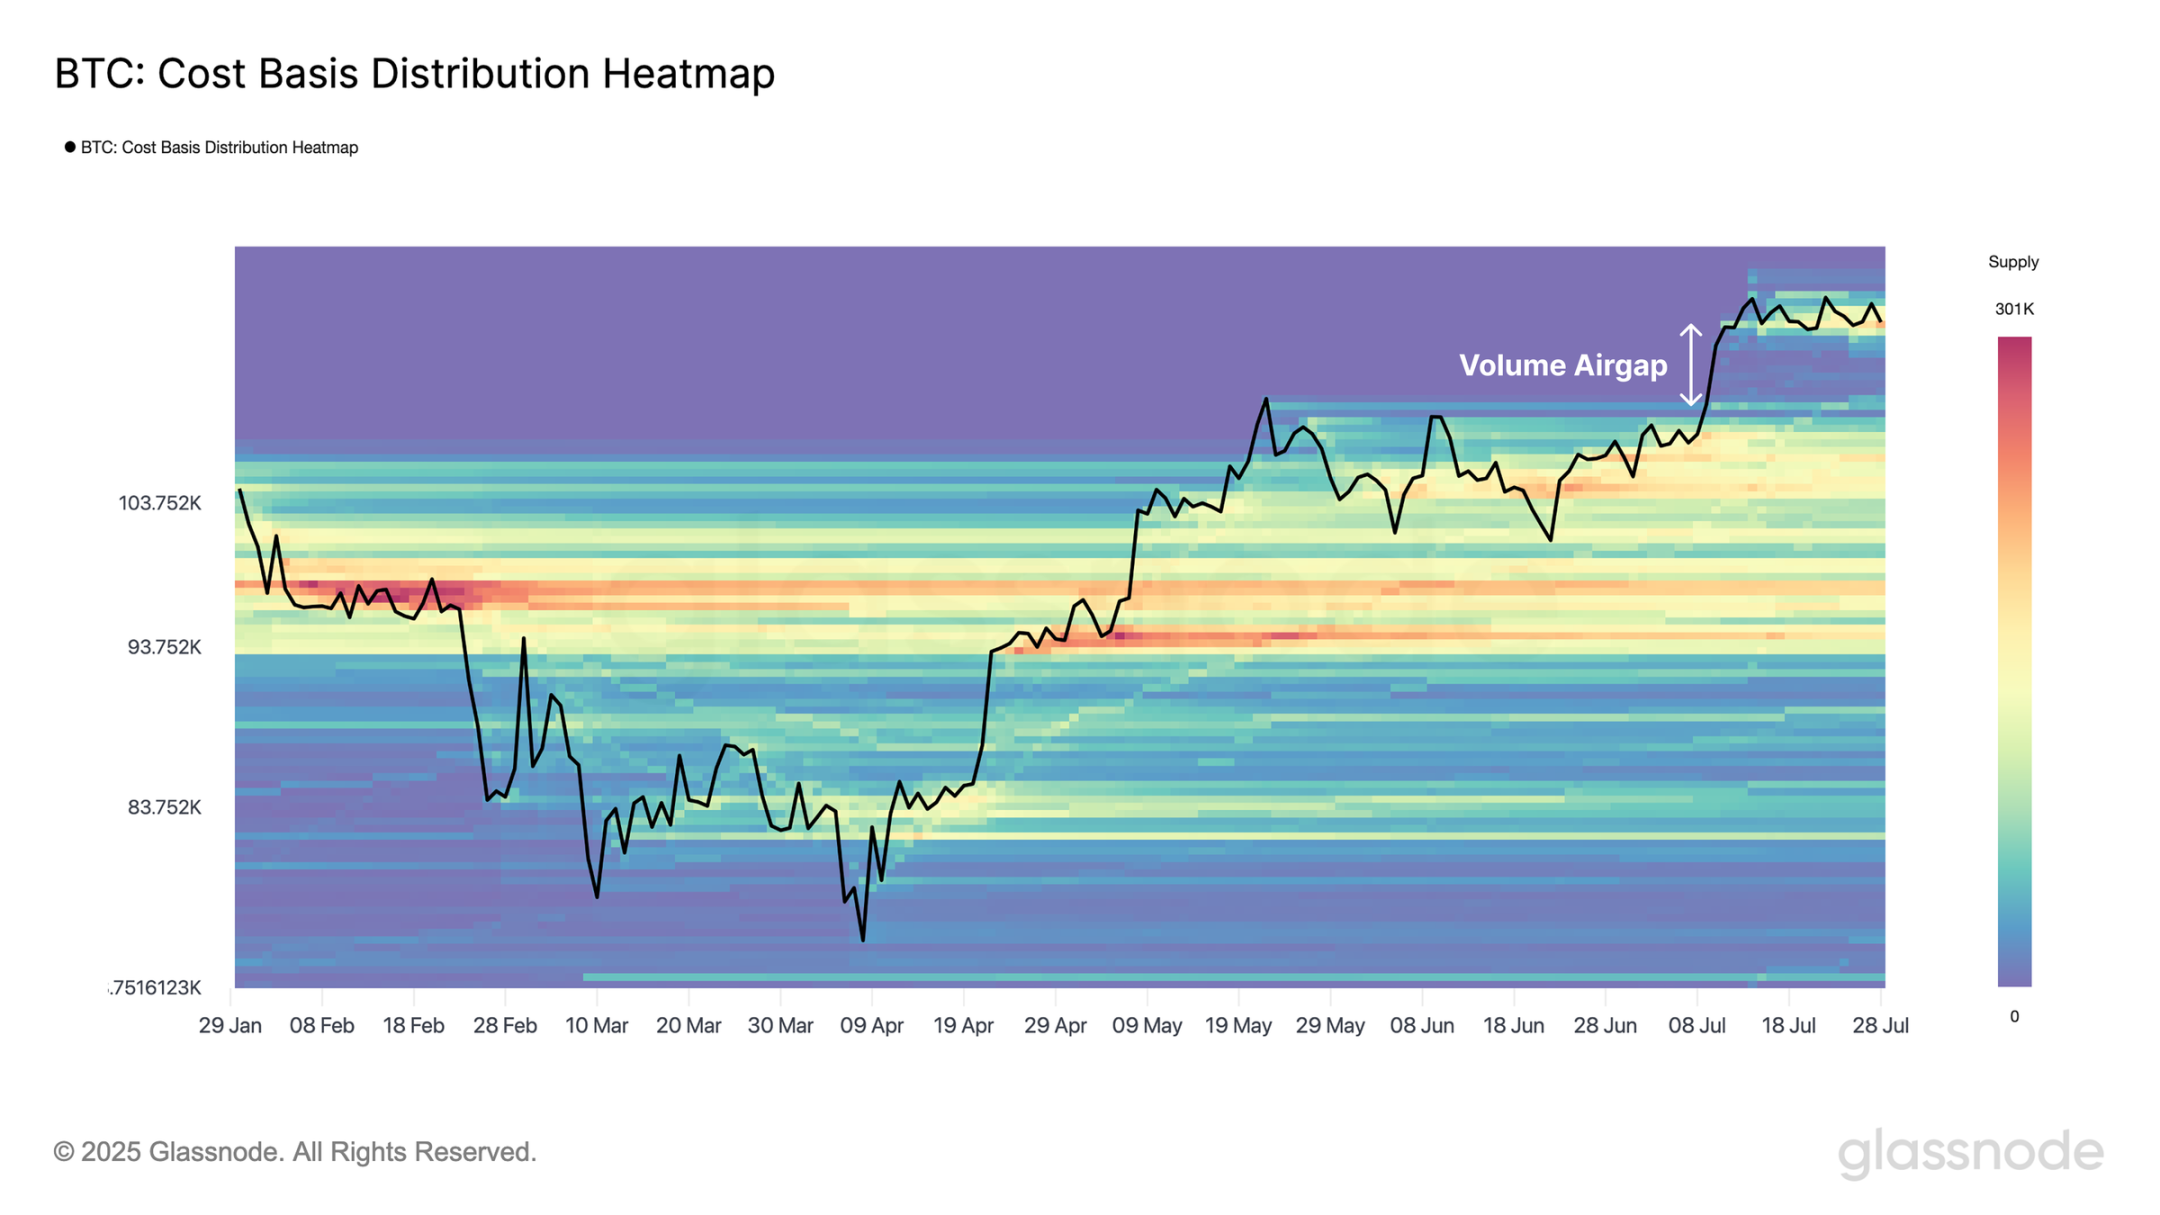
The Bitcoin cost basis distribution chart shows a significant concentration of cost basis in the $117,000-$122,000 range, indicating that a large number of investors have accumulated in this high price range.
It's worth noting that a volume vacuum exists below the spot price in the $110,000-115,000 range, a result of insufficient turnover during the rapid price advance. While not all volume vacuums require a retracement, the area holds price pull and the market may need to test the validity of this support, making it a key area to watch during pullbacks.
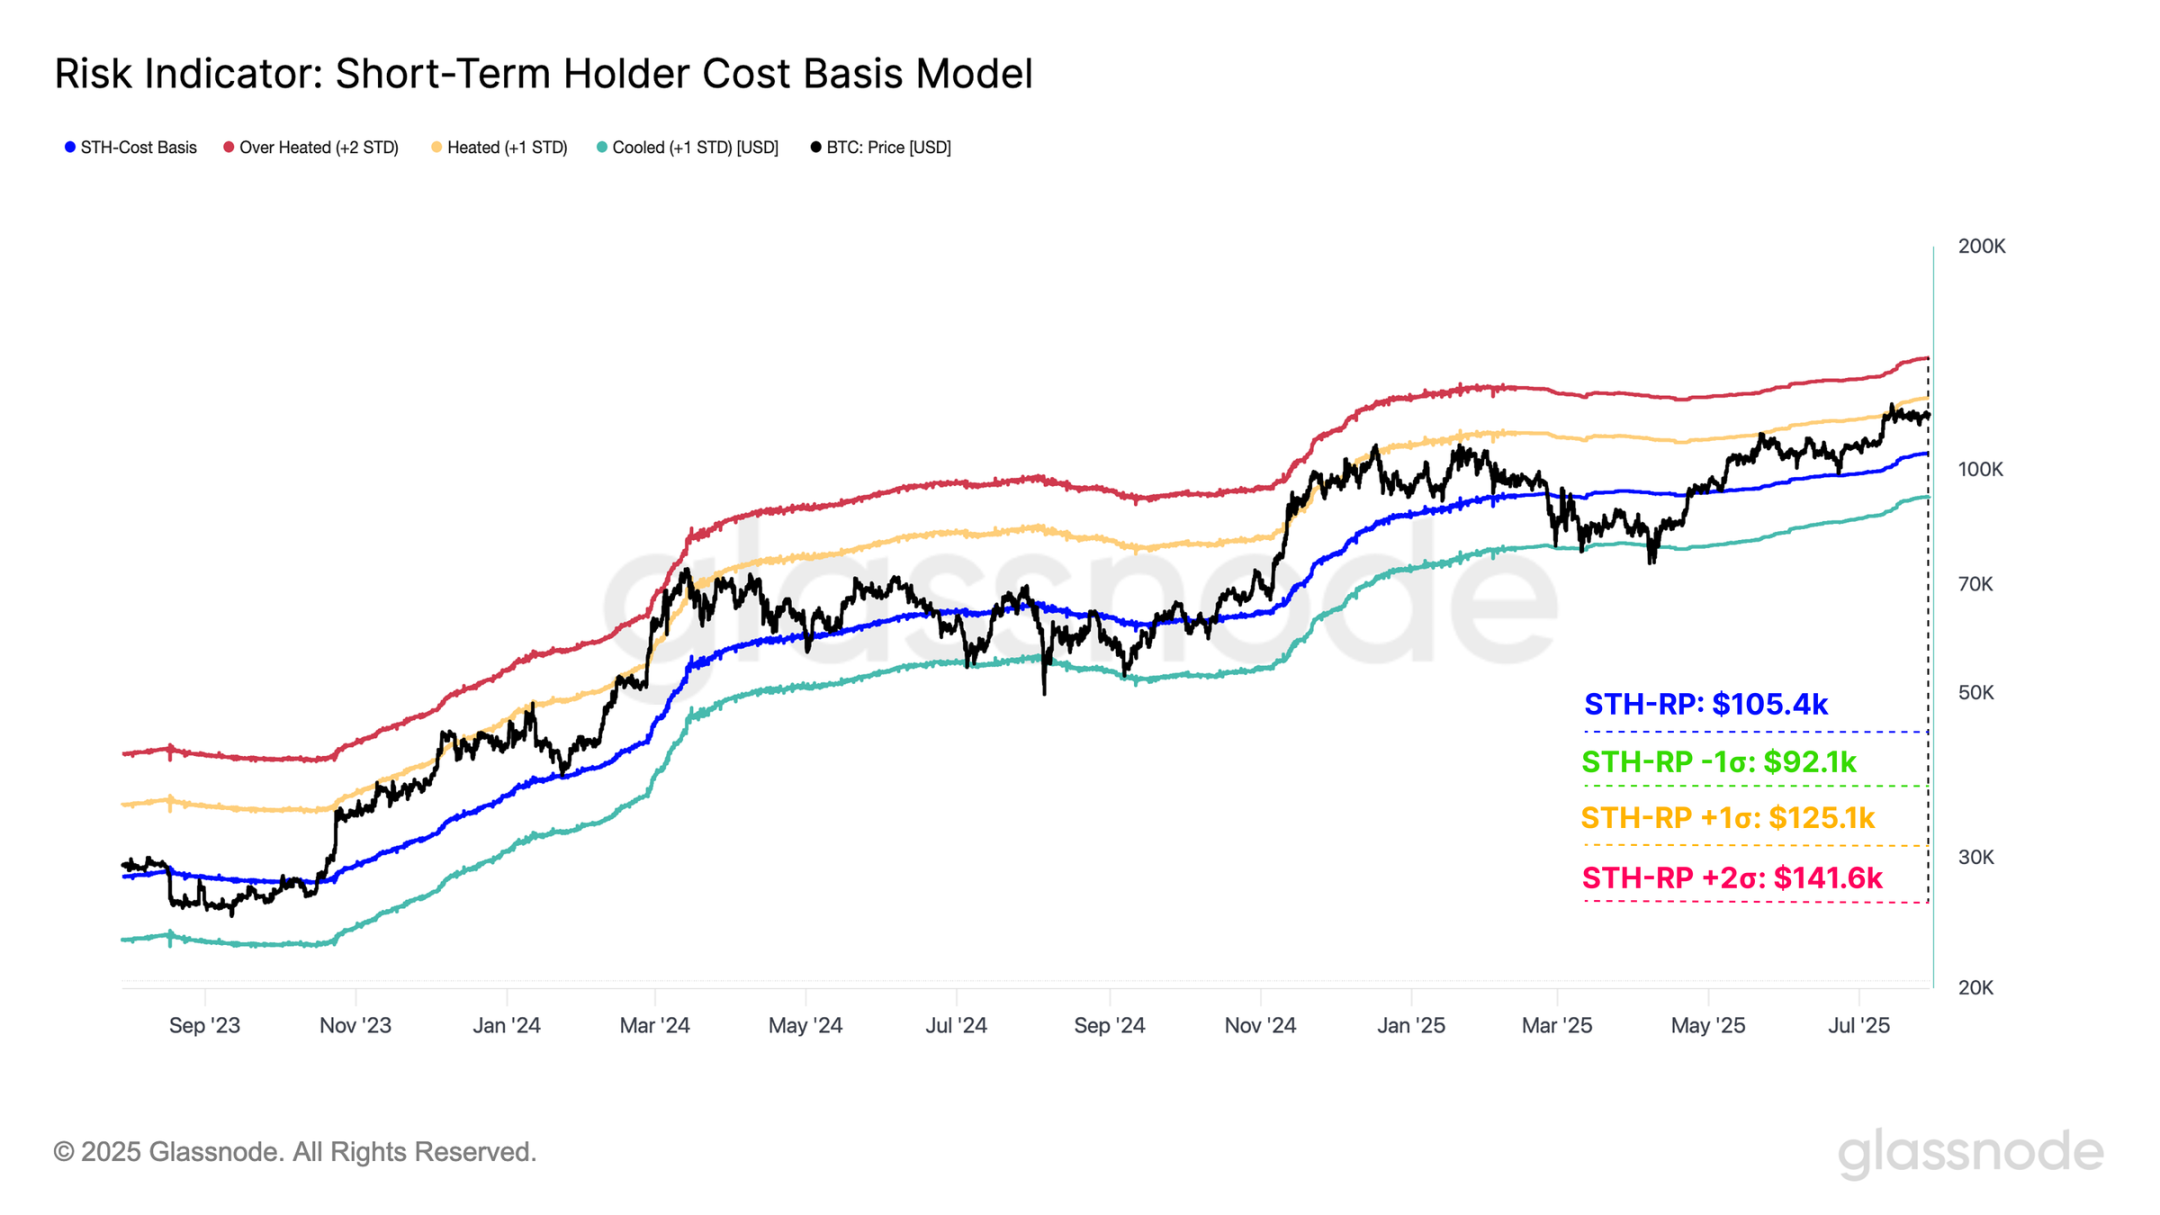
The short-term holder cost basis (representing the average holding cost of new investors) has always been a key threshold for demarcating local bull and bear markets. Overlaying the standard deviation range adds a statistical dimension:
- STH CB +2σ: $141,600
- STH CB +1σ: $125,100
- STH cost basis: $105,400
- STH CB -1σ: $92,100
The key observation is that Bitcoin's price remains above the cost basis of short-term holders, a positive sign for market strength. Furthermore, all major topping structures in this cycle have encountered resistance at the +1σ level, and the current pattern is no exception.
A macro perspective suggests that Bitcoin may remain range-bound between $105,000 and $125,000 before a decisive breakout. If a breakout is achieved, the $141,000 region (corresponding to the +2σ range) could become the next strong resistance level, where on-chain indicators suggest a sharp increase in selling pressure.
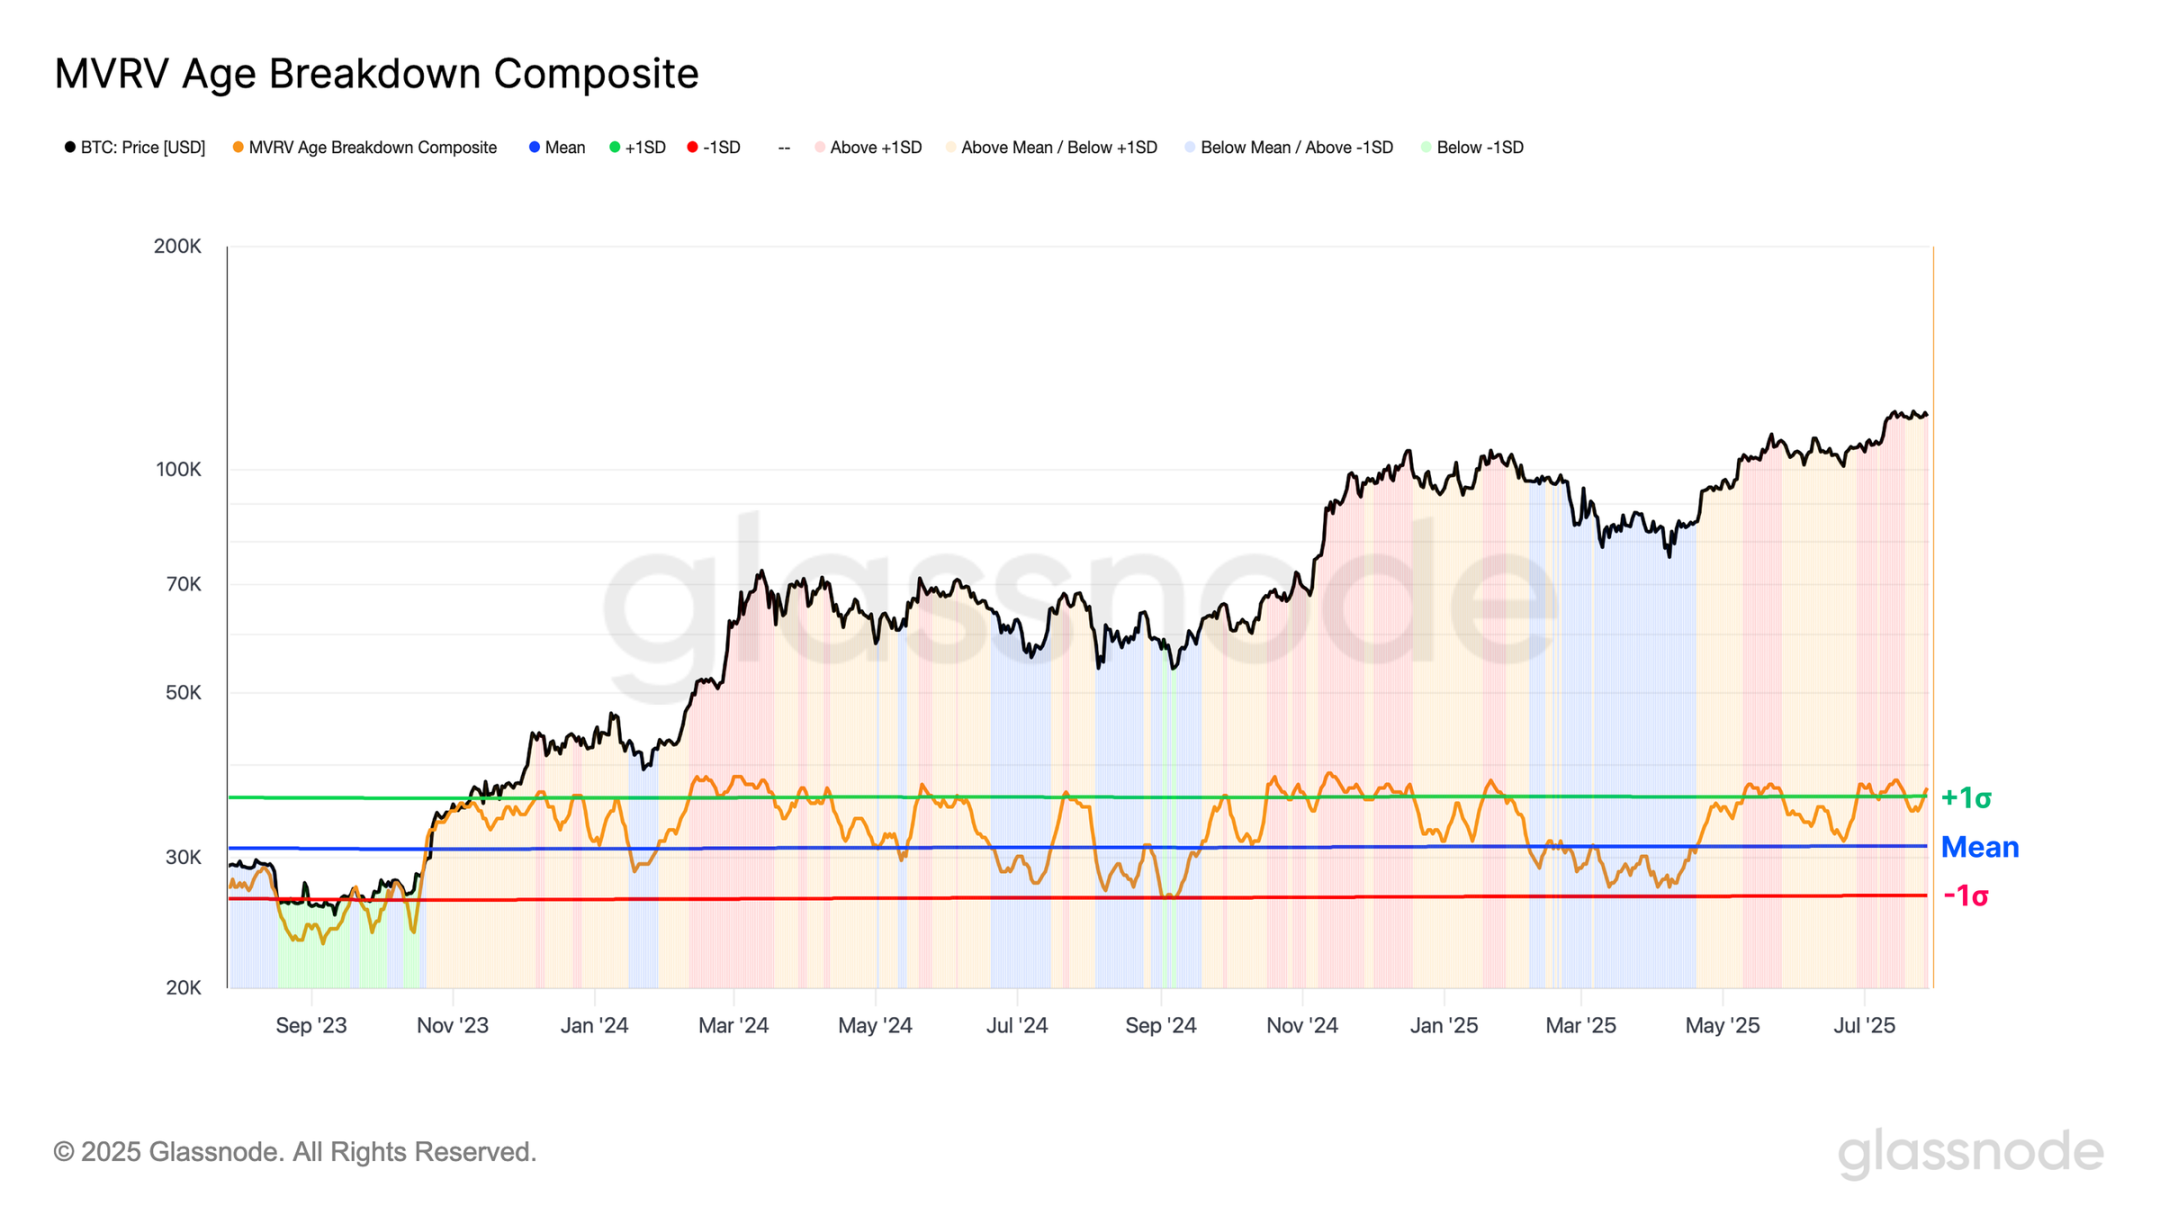
By analyzing the cost basis within subgroups of short-term holders, we construct a "fast and slow cost basis band" as a momentum indicator of short-term market sentiment. The current price remains above the cost basis of all short-term subgroups, indicating market strength. Notably, the cost basis band for holders between 24 hours and three months ($110,000 and $117,000) closely overlaps with the low-volume area of the cost basis distribution chart.
The convergence of multiple independent indicators reinforces the importance of this price area, suggesting it could become key support on a pullback.
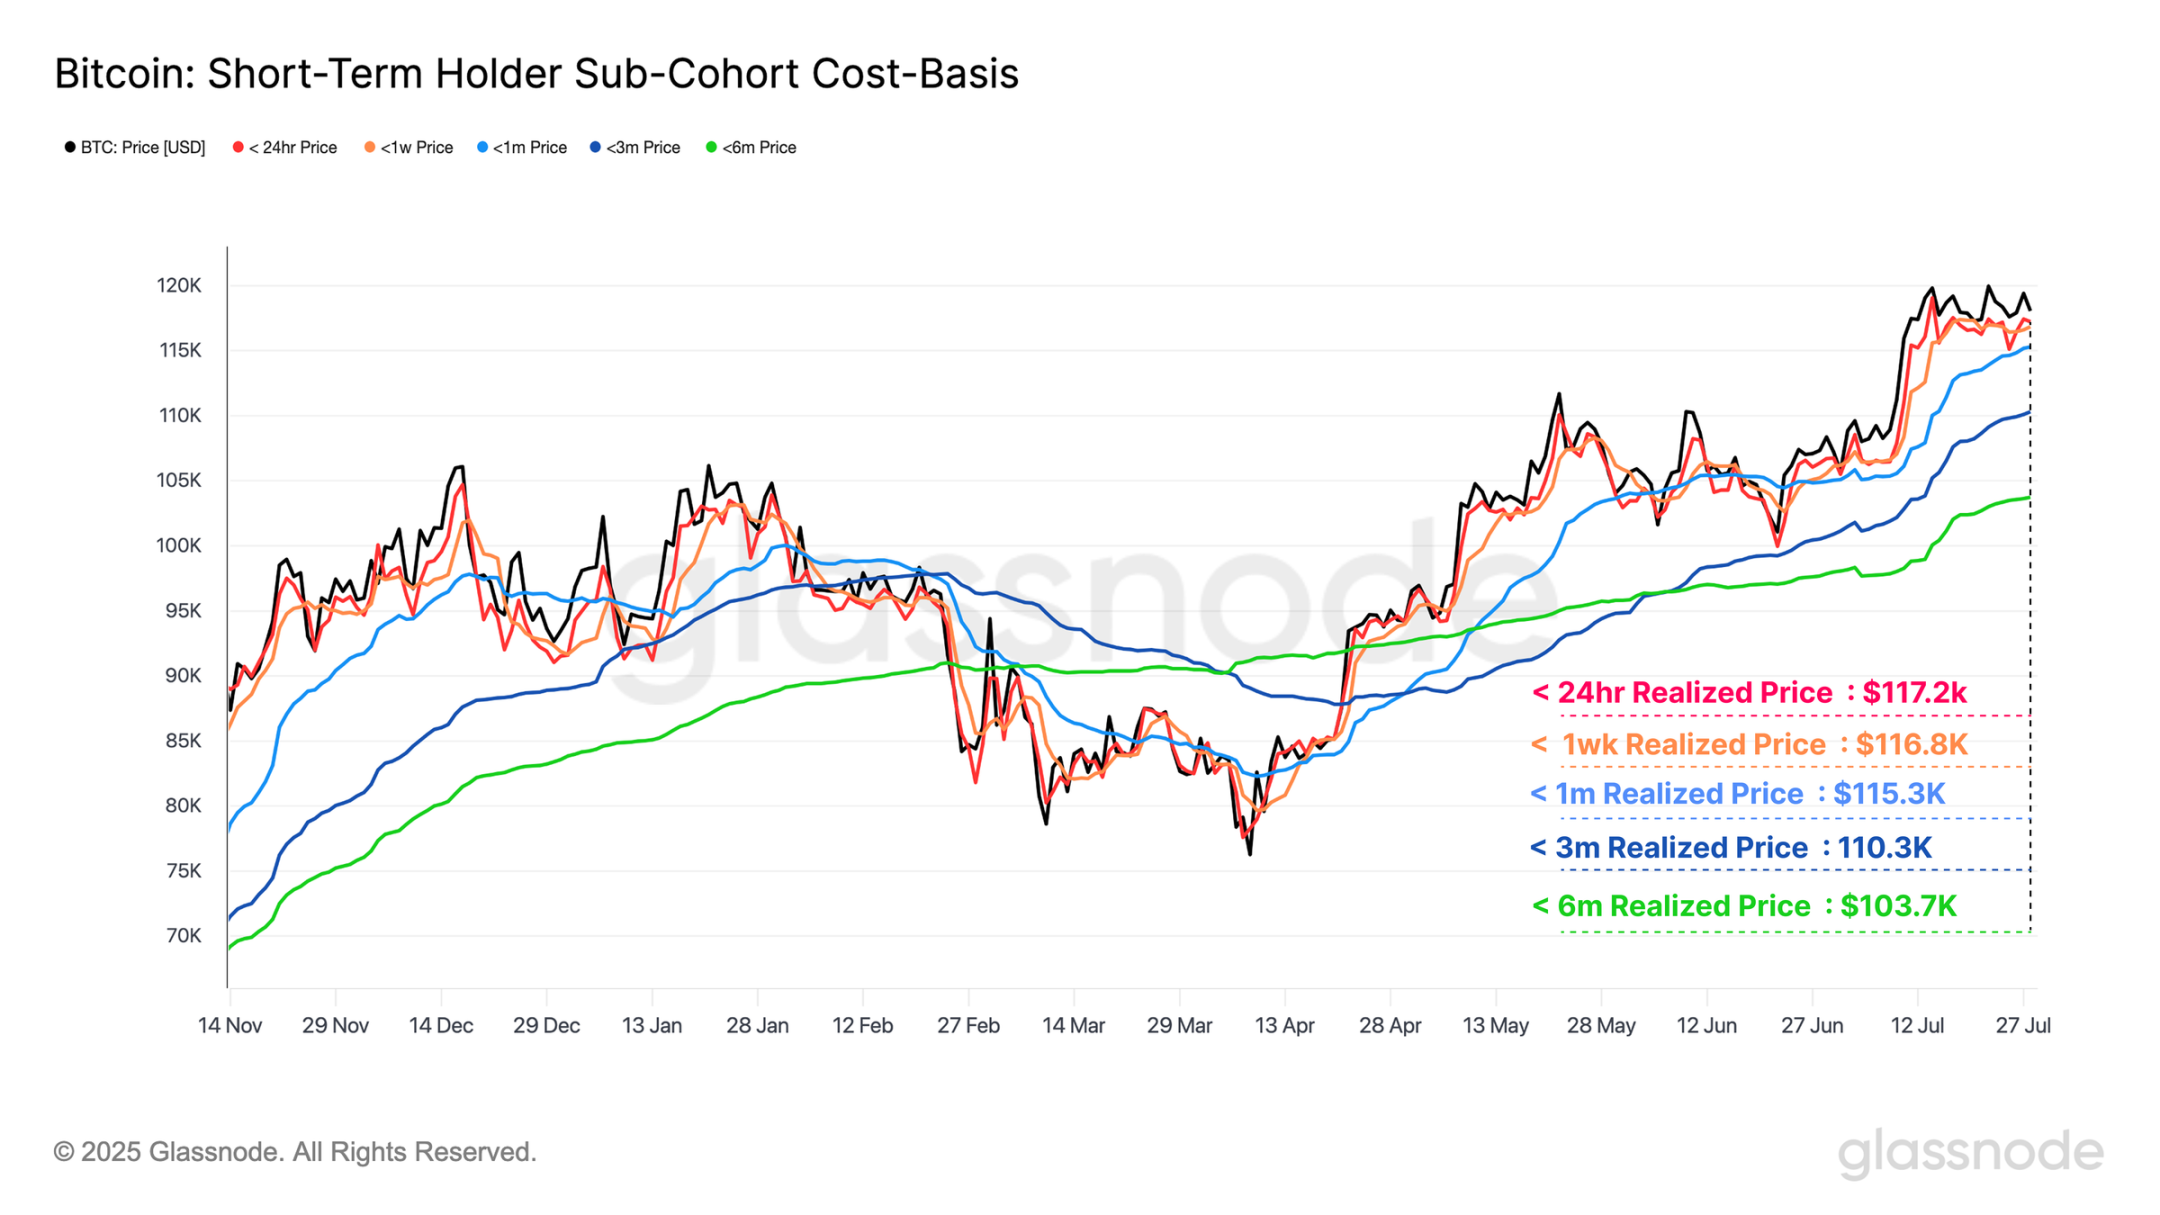
To better understand subgroup momentum, we use an equal-weighted composite index to measure the proportion of profitable subgroups. This index has consistently been above the mean and approaching +1σ, indicating robust market momentum and that most new investors are still profitable.
Summary and Conclusion
Bitcoin's resilience was severely tested last weekend, as the market efficiently absorbed the sell-off of 80,000 BTC (worth $9.6 billion), one of the largest profit-taking events in its history. Despite the staggering volume of trades, the price quickly stabilized near its all-time high, demonstrating the depth and maturity of current market liquidity.
Bitcoin is currently range-bound between $105,000 and $125,000. A breakout above this range could shift the market landscape, making $141,000 the next key target. On-chain indicators suggest significant profit-taking is possible in this area. Conversely, the low-volume zone below the current price, between $110,000 and $115,000, warrants close attention and will become a key area to watch in the event of a pullback.
- 核心观点:比特币市场展现强劲韧性,消化巨额抛压。
- 关键要素:
- 8万枚BTC抛售未显著压低价格。
- 未实现利润总额达1.4万亿美元。
- 市场流动性深度突破1.02万亿美元。
- 市场影响:增强市场信心,或推动价格上行。
- 时效性标注:短期影响。