Original author: Chloe, PANews
The price of Bitcoin broke through an all-time high (ATH) of $73,750.07 on March 14, becoming an important turning point in the current market and also marking the entry of Bitcoin price into a new unknown area, that is, the price discovery stage . Galaxy Digital founder and CEO Michael Novogratz said that the current market has attracted many new investors.
Increased market liquidity
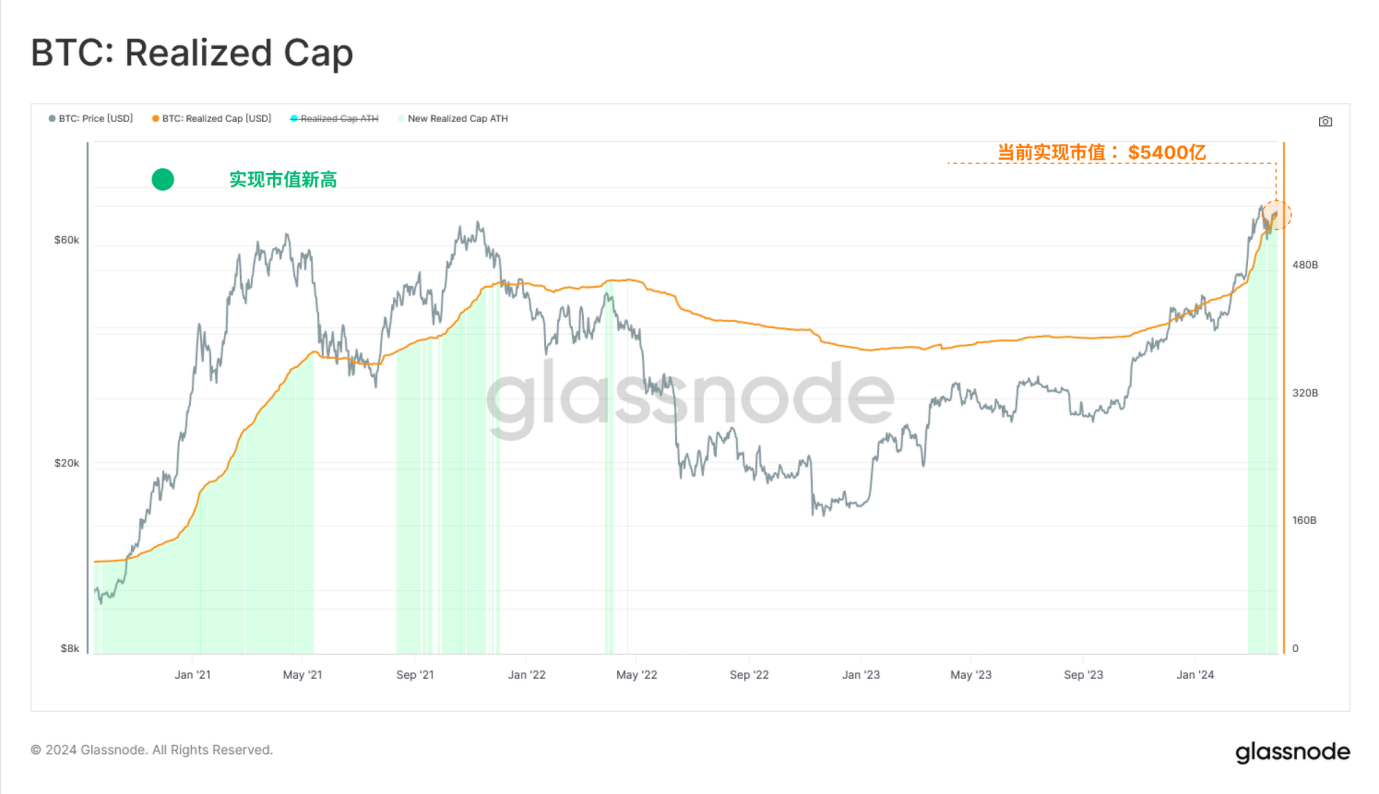
Glassnode recently wrote that at this stage, market prices prompt a large amount of supply to be used for cash out and profit, which causes the Bitcoin sold to be revalued, usually from a lower cost to a higher cost. That is, when these Bitcoins change hands, we can also think of it as an injection of new demand and liquidity into the asset class. This mechanism is highlighted by the implementation of the market capitalization indicator, which tracks the accumulated dollar liquidity stored in the asset class. The current realized market capitalization has reached a new all-time high of US$540 billion, and is growing at an unprecedented rate of more than US$79 billion per month.
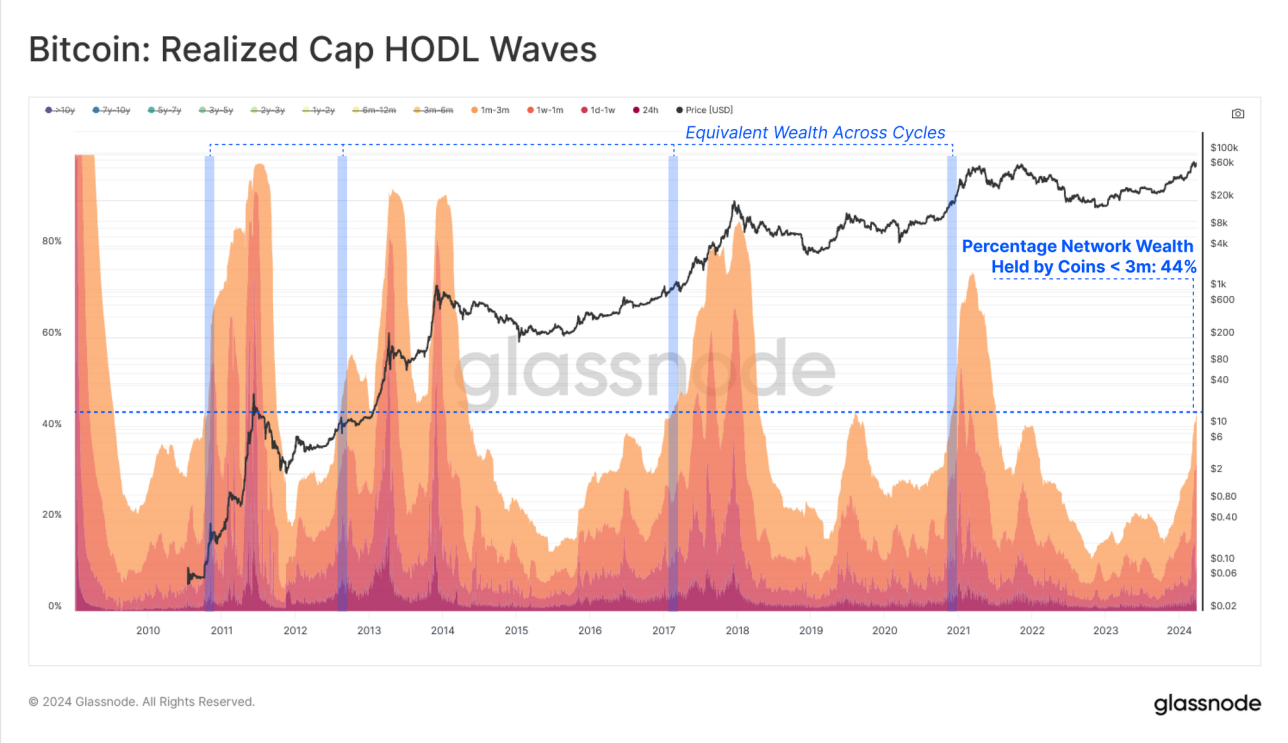
If we only consider holders who have held their coins for 3 months or less, we can see that the number has increased dramatically in recent months, implying that investors who have recently joined the Bitcoin market in recent months (i.e. those who buy and hold People who have been in Bitcoin for no more than three months now control approximately 44% of the total Bitcoin share. The increase in this ratio directly reflects long-term holders selling their Bitcoins when Bitcoin prices are higher to meet new demand fluctuations in the market. It also illustrates the changes in the distribution of wealth in the Bitcoin market and the significant growth of new investors’ share of the total wealth in the Bitcoin network.
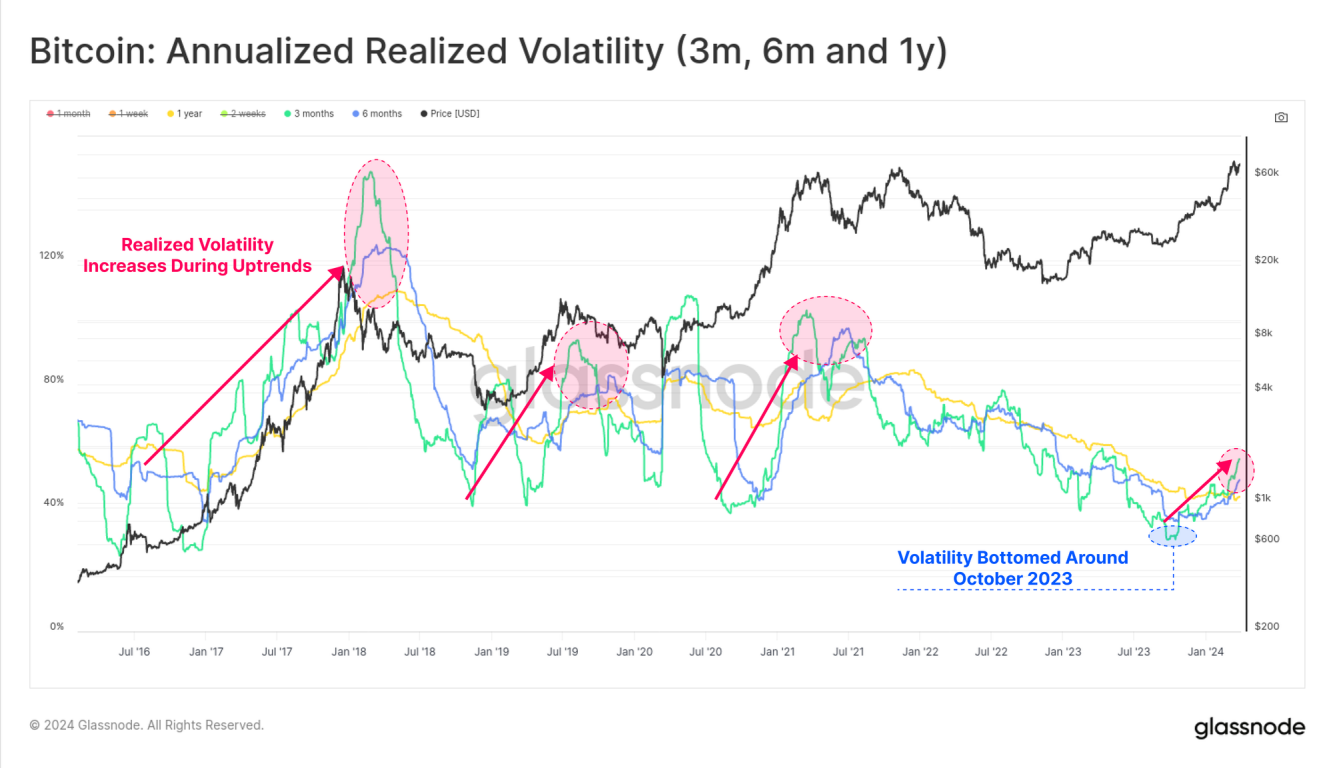
In past Bitcoin cycles, the injection of new demand into the market often revealed traders heightened interest in speculation and often resulted in greater market volatility, which was characteristic of macro uptrends in past Bitcoin cycles.
Since volatility bottomed in October 2023 (bottom right of the chart below), 90-day realized volatility has nearly doubled from 28% to 55%, a period that highlights the start of an acceleration in realized market capitalization inflows.
The market is beginning to recover
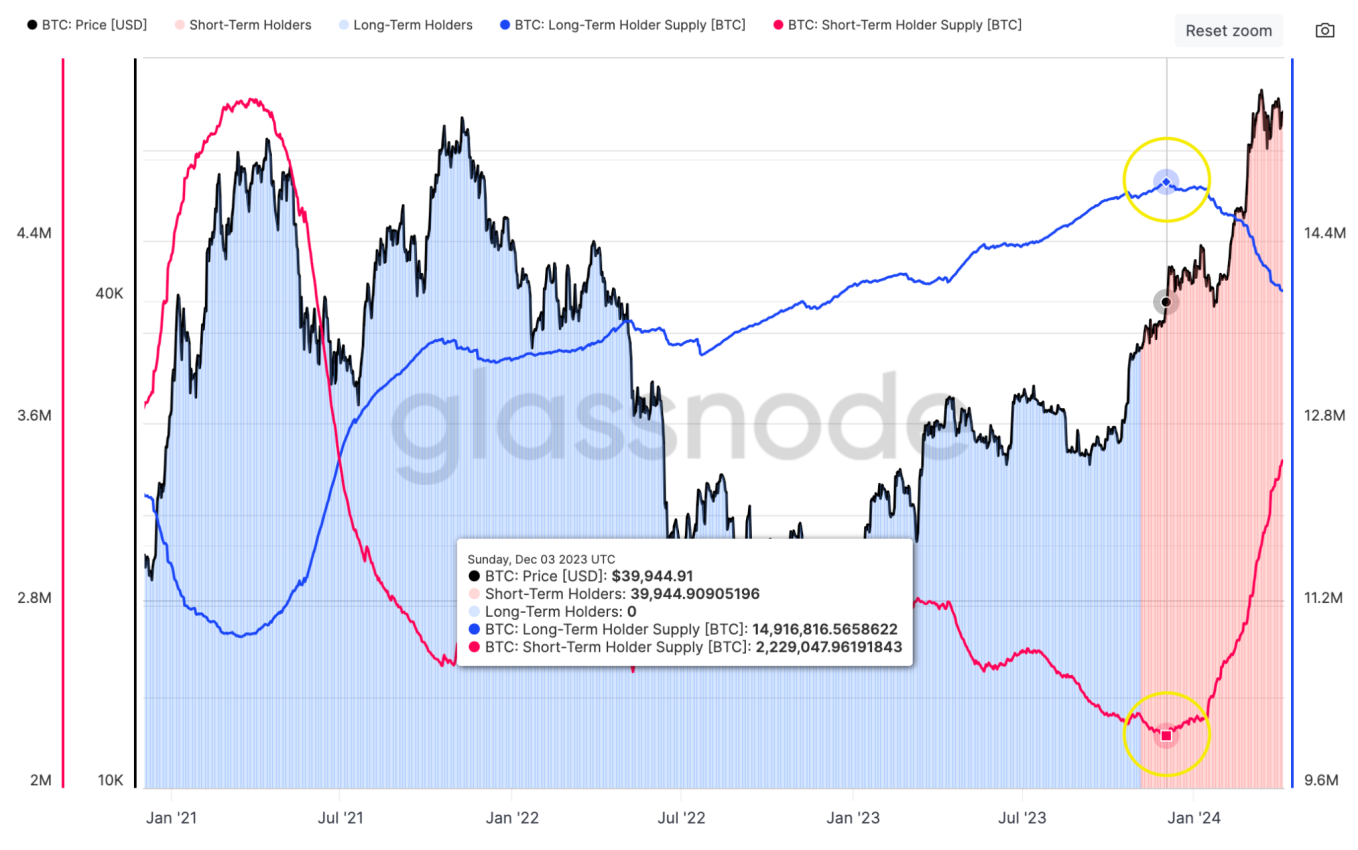
After the historic tightening of supply last year (see yellow area in the chart below), a strong divergence formed between the supply of long-term holders (blue line) and short-term holders (red line), with the supply of long-term holders close to historical highs, while supply to short-term holders is actually at an all-time low, highlighting the increasing tightening of BTC supply.
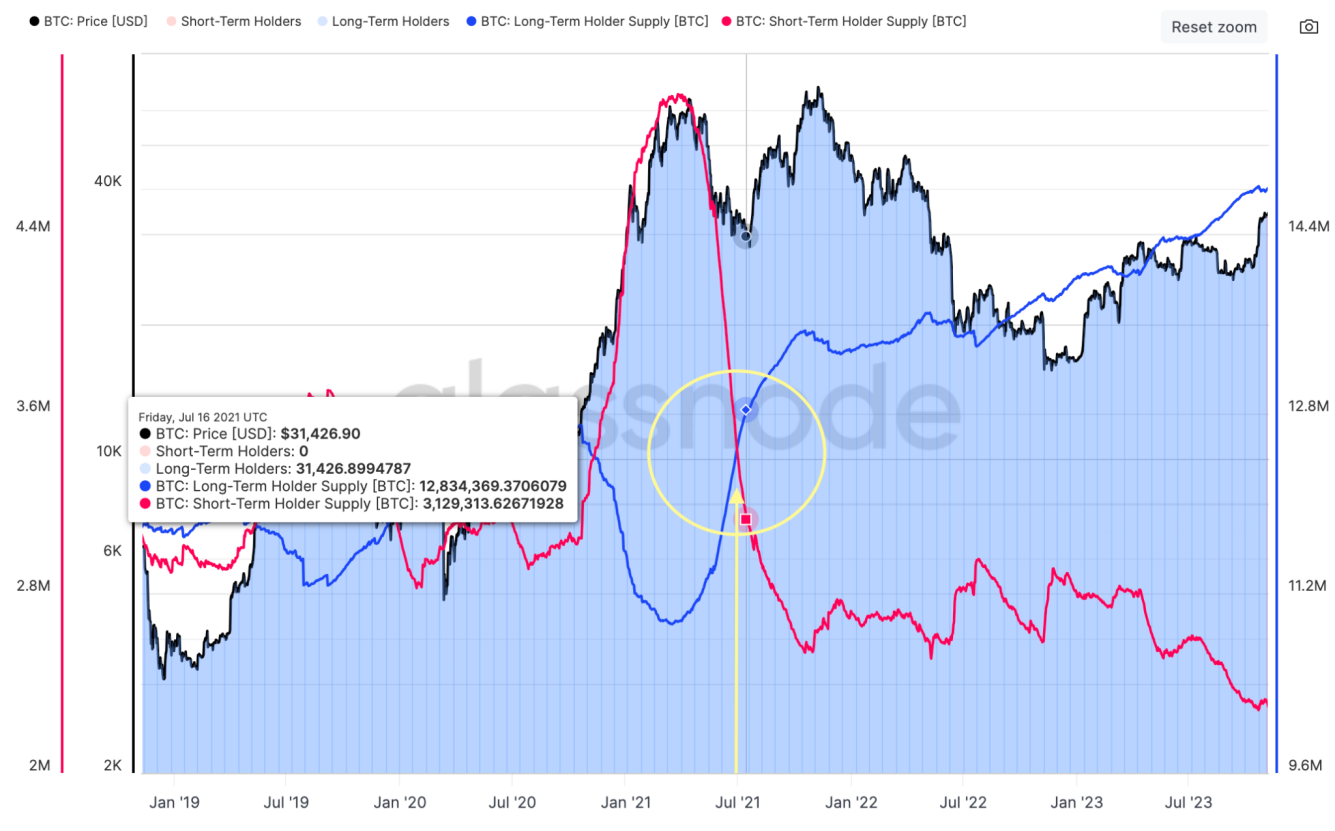
Today, the difference in supply between long-term and short-term holders has begun to narrow. As prices rise, investors hold more unrealized profits, which in turn entices long-term holders to sell their positions.
Glassnode data shows that since reaching a peak of 14.916 million BTC in December 2023, the supply to long-term holders has decreased by 900,000 BTC, indicating an important market shift. Among them, the proportion of GBTC outflows accounts for about one-third of this number (about -286,000 BTC).
PANews believes that this part of the outflow reflects a large outflow of funds from GBTC, which may cause long-term holders to increase market supply, especially when they choose to exchange their GBTC holdings for Bitcoin or cash. This partly explains why there has been a significant reduction in the supply of long-term holders, part of which is the outflow of GBTC.
Relatively, the supply of short-term holders increased by 1.121 million BTC, absorbing the selling pressure from long-term holders, and obtained an additional 121,000 BTC from the secondary market through exchanges. This change in supply and demand dynamics highlights shifts in market structure and the impact of different types of investor behavior on Bitcoin supply and price.
Based on the above information, it can be concluded that when the market reaches new highs, investors behavior patterns have obviously changed. As new demand builds, the pressure on long-term holders to sell at higher prices appears to be accelerating. While newly approved ETFs become an important new element in the market structure, these trends have been reflected in on-chain data for all previous cycles.
Glassnode then further analyzed the holdings of Bitcoin prices exceeding $60,000. From the figure below, you can see that there are approximately 1.875 million Bitcoins, accounting for 9.5% of the current circulation, all of which were purchased when the price exceeded $60,000. of.
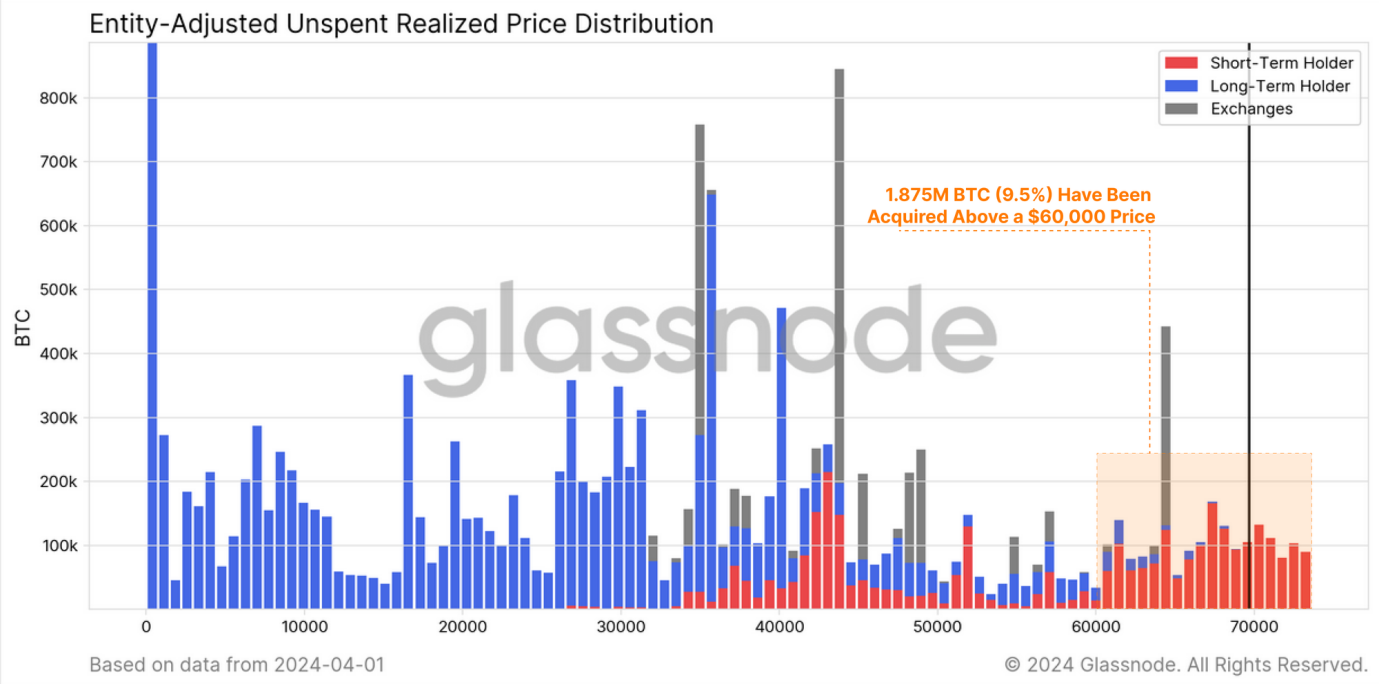
And as pointed out by the red ratio, most Bitcoins are currently controlled by short-term holders, which shows that a considerable part of Bitcoins have been purchased at high prices in the near future. In addition, approximately 508,000 Bitcoins are held in U.S. spot ETFs (excluding GBTC), which is also attributed to short-term holders, since ETF investors generally seek short-term profits rather than long-term holdings.
We can also correspond to the activity indicator in the figure below. Activity is an indicator that measures the overall balance of holding time in the Bitcoin supply. If activity continues to rise (orange line), it means that the number of Bitcoins being sold in the market (especially those that have been inactive for a long time) exceeds the number of new Bitcoins being purchased and held for the long term. This trend suggests that, overall, more Bitcoin in the market is being used for profit rather than being held for the long term (HODL).
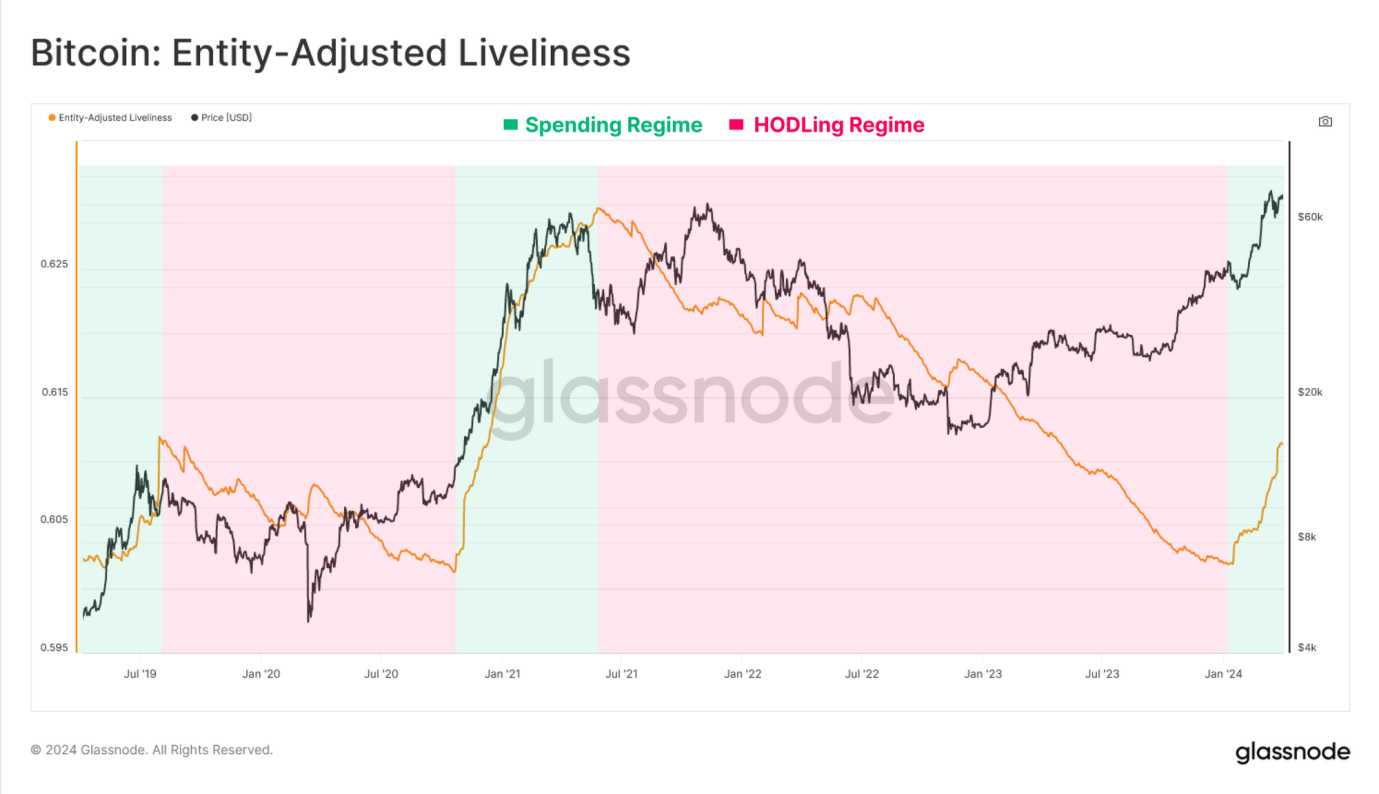
Taken together, the current state of the market quickly leads to the conclusion that the Bitcoin market has transformed into a stage mainly focused on selling and profit-making. PANews believes that this shift reflects the increase in short-term holders in the market and changes in Bitcoin trading behavior, especially when prices are high. This change in behavioral patterns is critical to understanding both short-term and long-term trends in the Bitcoin market. .
Indicators break down the market behavior of long-term and short-term holders
In the process of finding the balance between supply and demand, understanding the behavior of long-term and short-term holders is also important to capture market trends. Based on the on-chain indicators provided by Glassnode, readers will be led to explore how to analyze the application and value of the market through several indicators.
The first is the realized profit and loss ratio. This indicator is mainly used to find market turning points. That is to say, the realized profit and loss ratio fluctuates around the equilibrium value of 1 on a nonlinear measurement scale, which can provide us with an ideal tool for finding market turning points. . Particularly in an uptrend, when realized losses increase sharply, this may indicate that those buyers who bought at the top are beginning to panic sell, suggesting that the market may be reaching a turning point.
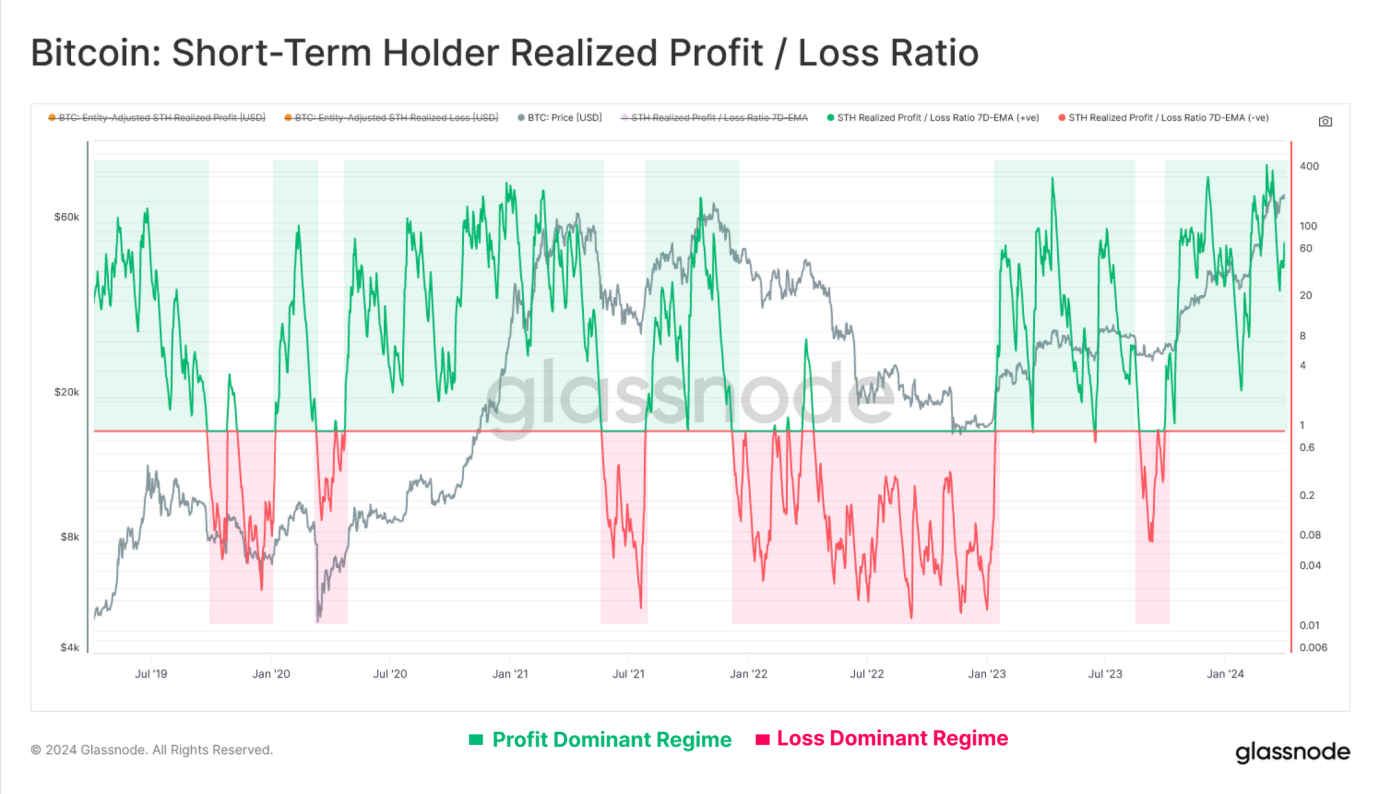
Lets start with the analysis of short-term holders, and we can see that their profit-loss ratio remains within a profit-dominated range, which means that their profits are about 50 times greater than their losses. This P/L ratio bounces back and forth from the equilibrium level of 1.0, showing that investors are generally able to absorb profits when market prices correct, and maintain their investment costs and avoid losses when prices fall.
Simply put, when this ratio is above 1, it means that short-term holders profits from selling Bitcoin are greater than their losses. If this ratio is high, say much more than 1, it means that there are many more people making profits than losing money in the market.
In the picture above, the green area shows that the profit situation is dominant, while the red area means that the loss situation is more significant. Generally speaking, when the price of Bitcoin goes through an upward trend and then pulls back, if this ratio can remain above 1, this is usually regarded as a sign of market health, indicating that even in the face of price fluctuations, most people are still making profits. status.
To gain a deeper understanding, we can compare this profit-to-loss ratio with Bitcoin’s market price trends to observe market sentiment and possible price movements. For example, if the price of Bitcoin hits new highs and the profit-to-loss ratio falls at the same time, this could signal an imminent market correction. Conversely, if prices fall and the profit-to-loss ratio rises, it could be a sign that the market is about to rebound.
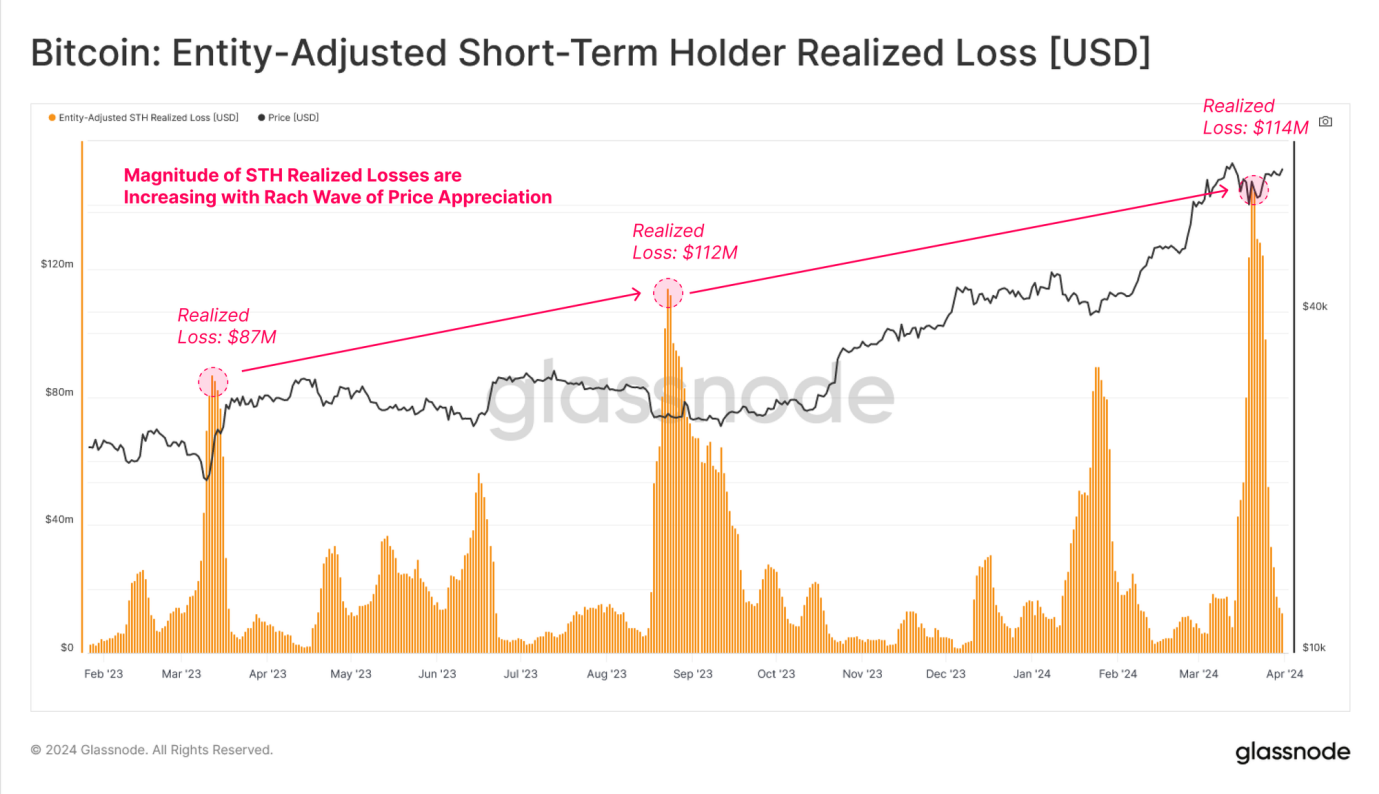
As we can see from the chart below, during the market price correction, the losses realized by short-term holders have a clear peak. We can speculate that the market will be eager to buy Bitcoin in the near future due to the expectation that the price may fall further. Sell to avoid greater losses (panic selling).
And after each market adjustment, the magnitude of realized losses has increased. This suggests that the number and size of top buyers attracted by each wave of price increases increases.
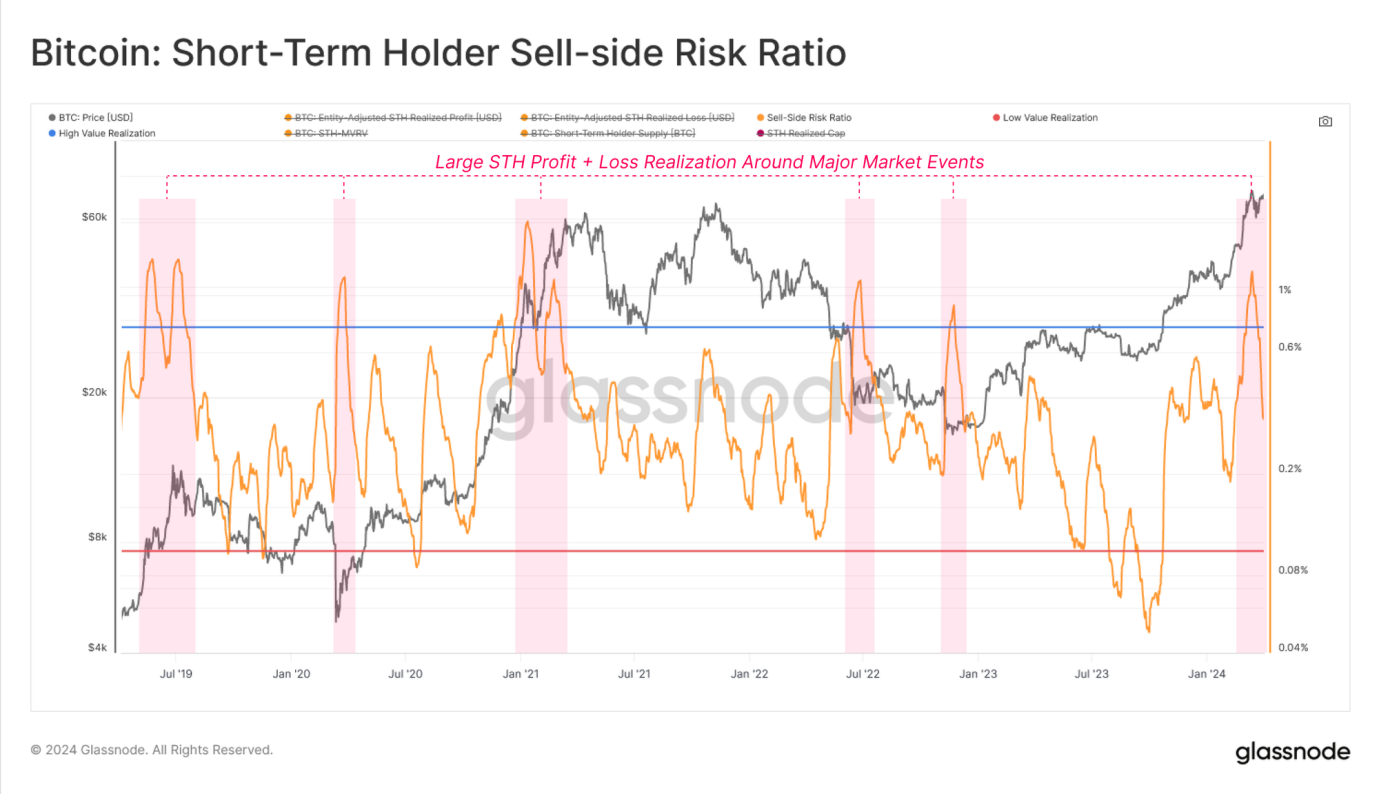
Then there is the Sell-side Risk Ratio indicator, which is mainly used to evaluate the relative size of its profit and loss events. This indicator can help understand the moving power of the market and its impact on the total market size, especially when the market is at or near a new all-time At high points.
High values indicate that short-term holders are buying and selling the cryptocurrency at prices well above or below its cost basis, meaning the market may need to re-find its balance (often accompanied by wild price swings). Conversely, low values indicate that the majority of Bitcoin being sold is close to its breakeven cost basis, suggesting that the market has reached some level of equilibrium and that “breakeven” has been exhausted within the current price range (usually when describing a low volatility sexual environment).
After the price of Bitcoin exceeded $70,000, the selling risk ratio of short-term holders increased significantly, which usually occurs near market turning points (both overall and local). It also usually indicates that a new balance has not yet been formed, and the indicator is correcting sharply as the market adjusts and consolidates.
In an assessment of long-term holders, you can see in the chart below that their realized profit/loss ratio has grown exponentially and vertically. By definition, this is because there were no long-term holders in the losses when the market had just broken out of the previous cycles top, which was further fueled by the aforementioned increase in profit-taking by long-term holders.
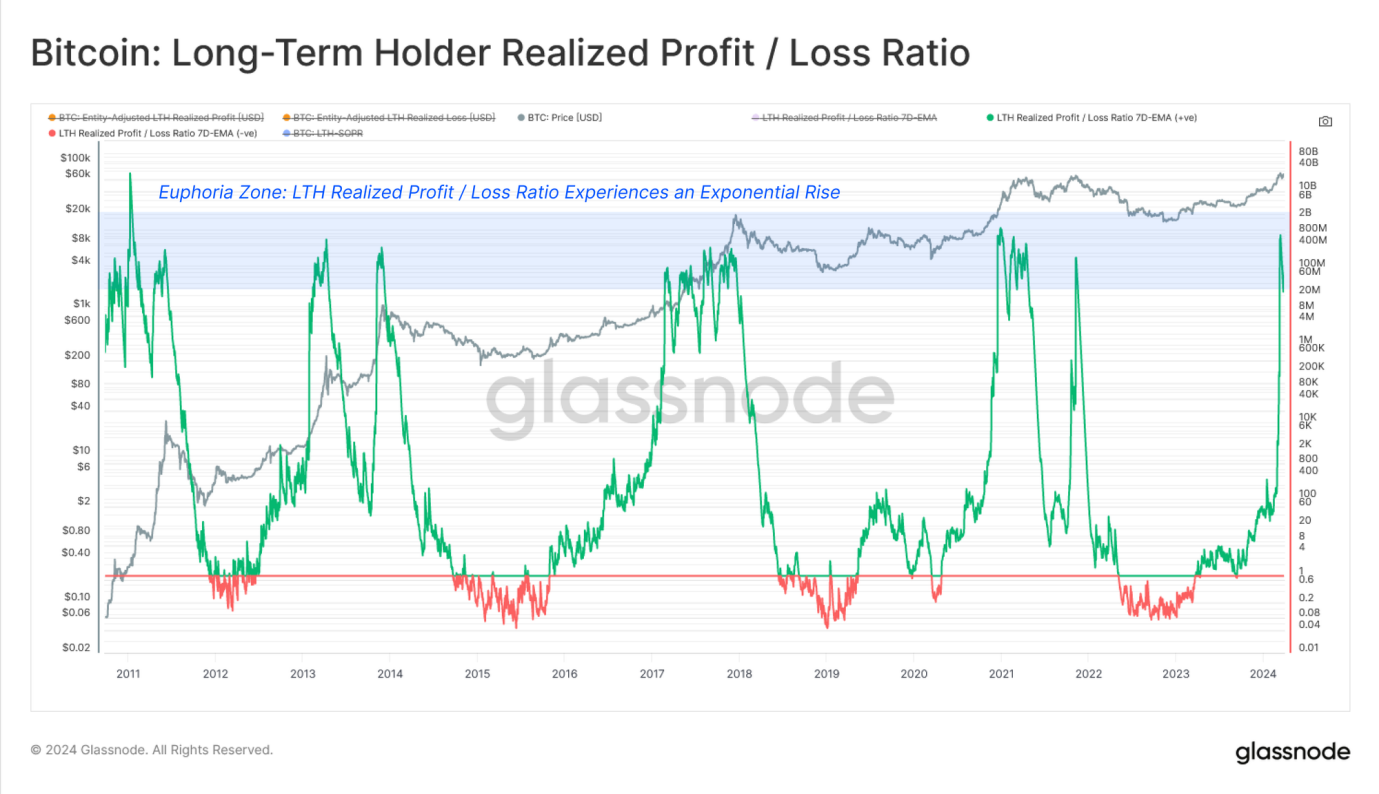
While we can track the realized losses of short-term holders in an uptrend, it is more important to monitor the realized profits of long-term holders, as this is a key component of selling pressure. PANews believes that the behavior of long-term holders is often viewed as a long-term indicator of market health. When their realized losses are low, it suggests they are in no rush to sell when prices fall, which may mean they are optimistic about the markets long-term outlook. Looking at the behavior of short-term holders, high realized losses reflect market volatility and investor panic.
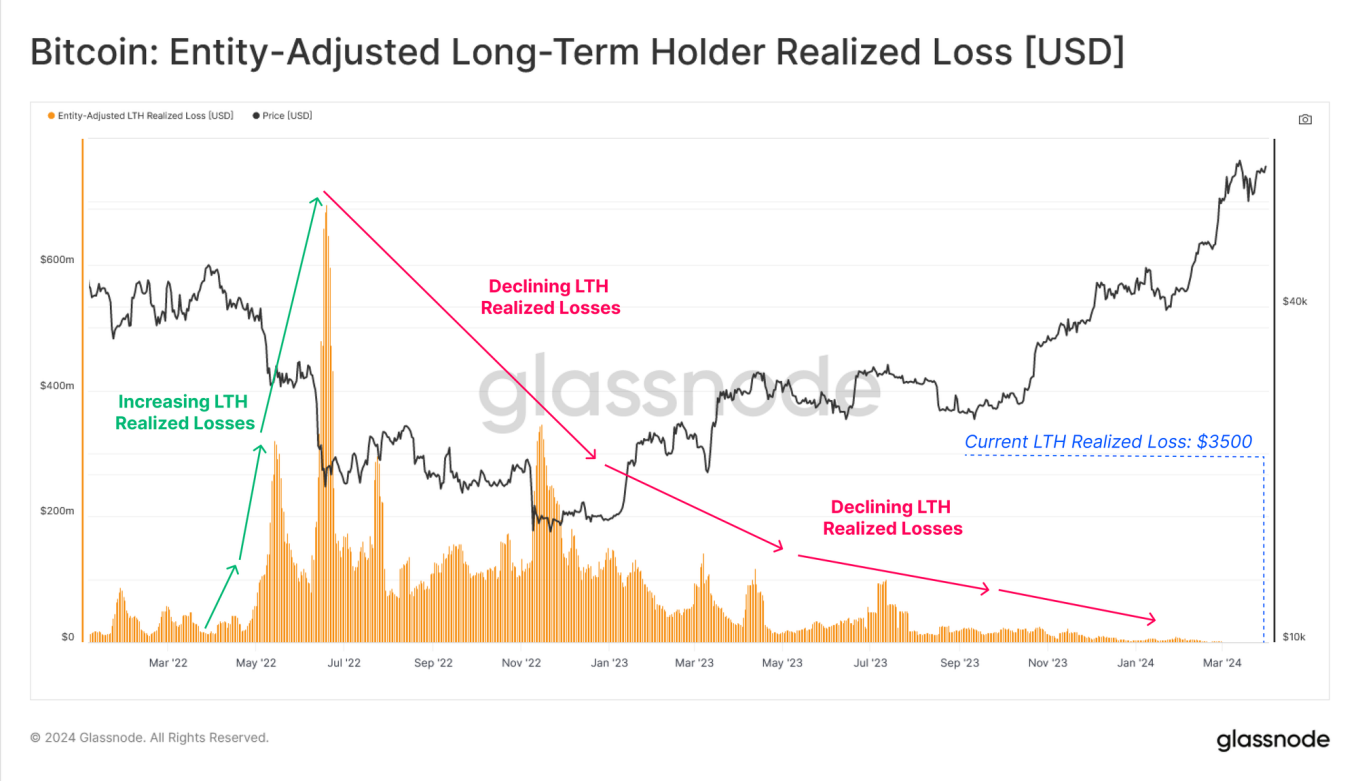
To illustrate this point, we can see that in the recent correction, long-term holders realized losses have reduced to just $3,500 per day compared to short-term holders $114 million.
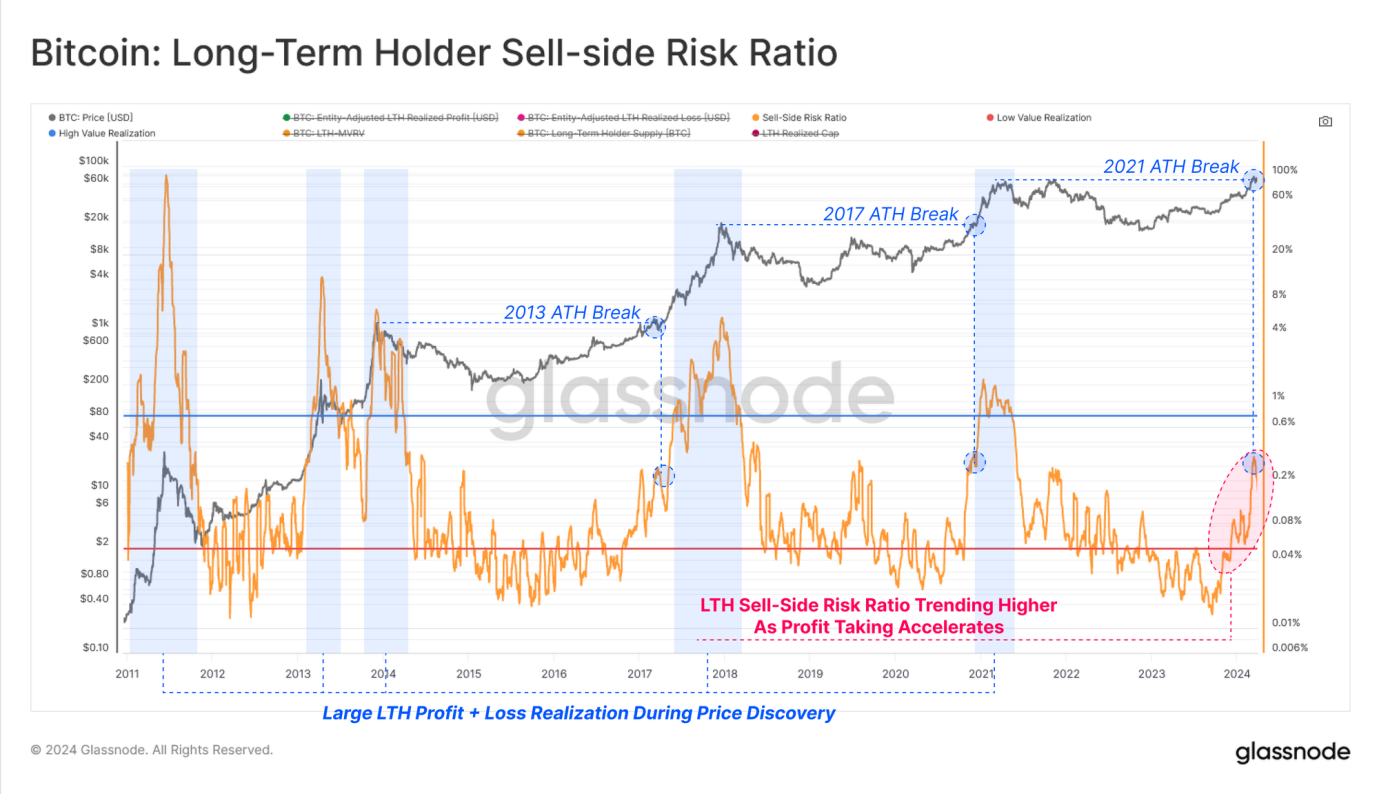
Finally, Glassnode noted an acceleration in profits realized by long-term holders, causing their sell-side risk ratio to trend upward since October 2023. The good growth in this indicator along with the all-time high breakout suggests that distribution pressure and profit-taking among the long-term holder group is similar on a relative basis to previous cycles.
All in all, by analyzing the combination of long-term holder and short-term holder groups, as well as their profit and loss behavior, it provides multiple perspectives on investor psychology and capital flows.
Through Glassnodes various on-chain tools and indicators, we can also observe that the current investor behavior pattern in the Bitcoin market is changing significantly. Long-term holders have been deep into their selling cycles, realizing profits and awakening dormant supply to meet new demand at higher prices. Then using the analysis of different holders on the chain, we can use these indicators to identify turning points in local and global markets, especially using profit and loss indicators.
Finally, the combination of long-term and short-term holder groups, and their profit and loss behavior, also indicates potential shifts in market trends. Changes in these behavioral patterns, especially profit realization and loss taking at key price points, provide a new way to predict market fluctuations and top opportunities.
By comprehensively considering the above indicators, we can understand the market dynamics more comprehensively and make more careful plans for future investment strategies.