
Evaluating ETH with P/E Ratio: The More Expensive, the More Counterintuitive to Buy
Original Author: SAM ANDREW
Original Translation: Deep Tide TechFlow
Ethereum has the characteristic of being a productive asset, capable of generating profits that accrue to token holders. But is it considered a productive asset like stocks? Does the valuation multiple of Ethereum affect the price of ETH?
Valuation multiple is a heuristic method for evaluating the value of an asset. Google's price-to-earnings ratio is 30x. NVIDIA's price-to-earnings ratio is 230x. If Google's current earnings are sustained for 30 years, it would take 30 years to recoup the investment in Google. If Google's earnings grow, the required number of years would be less. In comparison to NVIDIA, Google has a lower valuation. Price valuation, such as the difference between 30x and 230x, is not the sole driving factor of investment returns, but it is an important one. Expensive assets like NVIDIA include high growth expectations in their current valuation multiples. If they fail to meet these high expectations, the price will plummet.
Similar valuation multiples can also be applied to cryptocurrencies. Market capitalization divided by total fees is a valuation multiple of a cryptocurrency. Market capitalization represents the current perception of asset value in the market. Fees are the total income generated by the protocol. Blockchain revenue is similar to the profits distributed across the entire network. Therefore, blockchain revenue and earnings multiples are the same.
What is the valuation multiple of Ethereum?
The current transaction valuation of Ethereum is 100x its seven-day annualized fees. Since the summer of 2022, Ethereum's fee multiples have fluctuated between 25x and 235x (see chart below: ETH price and market cap/fees since the 2022 low point).
Unexpected Relationship
The above chart illustrates the inverse relationship between Ethereum price and valuation multiples. The best time to buy Ethereum was at the end of 2022 when its price was around $1200. However, at that time, Ethereum had a higher valuation multiple, reaching 200x fees. By the spring of 2023, Ethereum's price approached $2000, but its fee multiples dropped to 50-100x.
The inverse relationship between price and valuation multiples is unexpected. Typically, assets are more attractive for investment when their valuation multiples are lower. Multiples are usually lower before assets reach a turning point. The market recognizes the undervaluation of the asset. Prices start to rise, and valuation multiples also increase accordingly.
The chart below (2010s Bull Market: S&P 500 Index and P/E Ratio) illustrates the general relationship between price and multiples. It describes the bull market of the US stock market in the 2010s before the outbreak of the COVID-19 pandemic. In the early years of this decade, the P/E ratio of the S&P 500 Index was around 15x. The average P/E ratio of the S&P 500 Index since 1928 is 18x, and since 2000 it is 26x. In 2011, the US emerged from the global financial crisis, and interest rates reached historically low levels, marking a turning point. Since then, prices and multiples have been steadily rising.
So, what can we infer from the multiples of Ethereum?
Do the multiples of Ethereum indicate whether ETH is "cheap" or "expensive"?
How does "cheap" or "expensive" translate into price performance for ETH? Is it a good indicator for a buying opportunity, similar to the stock market?
These questions can be answered by analyzing historical data.
In the past five years, the price of ETH has risen from $10 to over $4000. This 400x price movement makes it difficult to observe the relationship in a single chart. Instead, we can highlight different periods to illustrate the trends.
The bull market in 2017 highlighted the inverse relationship between multiples and prices. In early 2017, the multiples of Ethereum reached an astonishing 7700x cost (see the chart below: 2017 Bull Market: ETH Price and Market Cap/Premium). However, from the perspective of price movement, that was a good time to buy Ethereum, with prices around $10. Subsequently, the price of Ethereum increased 10 times, and the multiples dropped to 100x.
The bull market in 2021 also exhibited a similar trend. Buying Ethereum in early 2020 at a price of approximately $200, the multiples of Ethereum reached a cost of 650x (see the chart below: 2021 Bull Market: ETH Price and Market Cap/Premium). The price of Ethereum grew 24 times, while its cost multiples compressed to 22x.
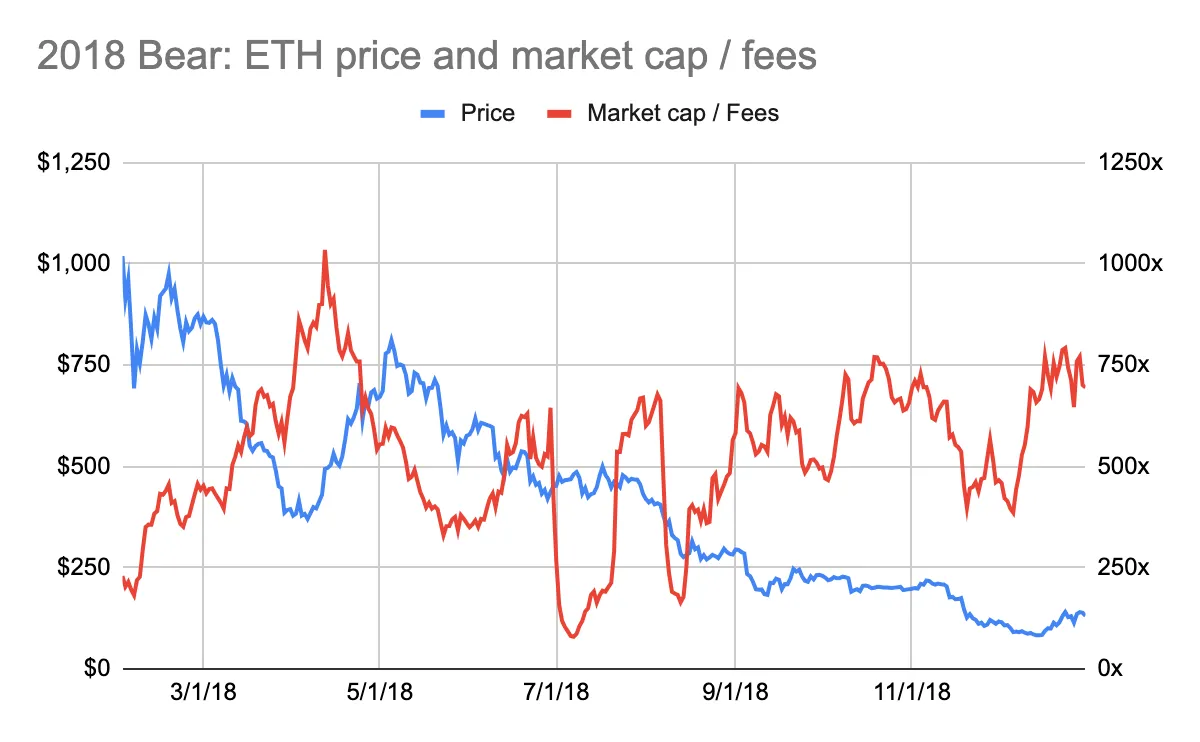
The bear market of Ethereum also showed the same inverse relationship. In early 2018, Ethereum's price reached a peak of nearly $1000, while the multiple of Ethereum dropped to 200 times the cost (see below: 2018 Bear Market: ETH Price and Market Cap/Cost). A few months ago, the multiple of Ethereum exceeded 3000 times the cost (see above: 2017 Bull Market: ETH Price and Market Cap/Cost). This indicates that selling Ethereum at that time was a good opportunity.
Similarly, at the end of 2021, Ethereum's price reached a historical high of over $4000, while the multiple of Ethereum dropped to 25 times the cost (see below: 2022 Bear Market: ETH Price and Market Cap/Cost). This indicates that selling Ethereum at that time was a good opportunity.
Multiple Conclusions
ETH price and multiple are inversely proportional. History shows that it is best to buy Ethereum when its P/E ratio is at its peak and sell when it is at its lowest. Buy at the highest valuation multiples and sell at the lowest valuation in ETH trading.
This conclusion is indeed counterintuitive.
This is different from trading productive assets like stocks.
How to explain this peculiar relationship?
This counterintuitive conclusion can be explained by the following:
The market is forward-looking.
The value of Ethereum is not based on the multiple of cost.
1. The market is forward-looking
Whether it is the stock market, commodity market, or cryptocurrency market, they are all forward-looking. Prices reflect expectations of the future, not what has already happened. It can be understood in this way: the value of a company is based on its future cash flow.
Market cap/cost ratio reflects the cost of Ethereum at a specific point in time. The cost data used to calculate the ratio is the sum of costs over the past seven days multiplied by 52 weeks. It does not reflect Ethereum's future cost potential. This cost data is not a forward-looking indicator.
Analysis of historical data confirms the forward-looking nature of the Ethereum market. In the bull market of 2017, the price of Ethereum had already risen before Ethereum costs (priced in Ethereum) (see the chart below: 2017 Bull Market: ETH Price and Costs). Please note that the decline in price at the beginning of 2018 did not decrease as quickly as the cost did.
In the bull market of 2021, a similar but weaker trend emerged. As of May 2021, the price began to rise before the corresponding increase in costs (see the chart below: 2021 Bull Market: ETH Price and Costs). However, in the summer of 2020, costs nearly doubled, but Ethereum's price did not change accordingly. Additionally, at the beginning of 2021, the growth in costs triggered a rise in Ethereum's price. This reversal of the sequence can be explained by the COVID-19 pandemic. In the summer of 2020, people were locked down at home. DeFi applications experienced explosive growth, resulting in more spending on Ethereum costs by users. However, the investment community did not pay attention to cryptocurrencies.
The volatility of ETH prices during anticipated Ethereum fee growth is most pronounced in bull markets. This relationship is neither negated nor confirmed during a decline or sideways trading of ETH prices.
2. ETH is not valued based on cost ratios
The market may not value Ethereum based on cost ratios. If it did, ETH prices and cost ratios should somewhat synchronize. The logic should be that lower price-to-earnings ratios often imply a more attractive entry price, rather than the opposite.
The cost ratio of Ethereum fluctuates dramatically and tends to be overvalued. Since 2016, Ethereum's transaction price has fluctuated between 10 times and 8,800 times its fees. Since 2021, this range has compressed to 20 times to 235 times. Valuation ratios remain relatively high.
Ethereum has characteristics of productive assets, commodities, and stores of value. The valuation of productive assets is based on multiples of income, while commodities and stores of value are not. The difficulty in explaining the valuation of ETH as a multiple of fees may suggest that ETH is seen more as a store of value rather than a productive asset.
However, there is a question here...
If ETH is not seen as a productive asset, then why does its price fluctuate when expected fees increase?
The price should not fluctuate. After all, if ETH is a store of value, then the growth of Ethereum fees should not have a significant impact on its valuation.
But fees do indeed affect the price.
How much of an impact is it?
It is difficult to say. The price of ETH is influenced by multiple variables, including macro factors, regulations, and competition. It is impossible to determine which variable has the greatest impact on price.
In the cryptocurrency field, especially in Ethereum, fundamental factors such as fees are important. Fundamentals determine the health and prospects of the network. For Layer 1 blockchains, fundamentals can only play a certain role in valuation networks. The value of a blockchain largely lies in its monetary properties, i.e., its ability to store and transfer value, as well as its ability to maintain the network. Protocols and applications built on top of Layer 1 blockchains rely more on their attributes as productive assets.
Therefore, you cannot derive the price of ETH based on multiples of transactions. The multiples of "cheap" or "expensive" for Ethereum do not explain much. But Ethereum's metric, namely its fees, drives price fluctuations.


