
Data Interpretation of the Current Status of Cross-Chain Bridges: LI.FI and Stargate have the highest retention rates
Original author:Tide
Original Compilation: Felix, PANews
Original author:
Original Compilation: Felix, PANews
Cross-chain bridges are one of the most competitive tracks in Web3. Cross-chain bridges hope to attract new users and convert them into old users, but do these cross-chain bridge projects know how to compete? This article takes a look at the data and insights from the head cross-chain bridge.
Why is it difficult for cross-chain bridges to compete with other Web3 tracks?
Cross-chain bridges are very complex. There is no clear formula (such as DEX's AMM). This complexity can make it difficult for the average user to understand.
Users need fast and cheap bridging services, but security is difficult to form a selling point.
Network effects are not as obvious as DeFi dApps, and providing liquidity for cross-chain bridges is a complex operation for ordinary Web3 users.
In order to become a leading protocol, the cross-chain bridge needs to make a choice in the following aspects:
B2B cooperation and integration: LI.FI is a good example, focusing on integration, many users are willing to pay extra transaction fees for a better user experience.
B2C campaigns (missions, airdrops, community engagement) can create brand differentiation: Stargate is first-rate at this.
There is little data available to inform the development strategy of cross-chain bridges. This article lists the necessary data indicators by looking at the data on the chain:
Trends in the number of cross-chain bridges
return on investment
customer lifetime value
Cross-chain bridge market share
The average daily trading volume in the first quarter of 2023 is about $200 million. The market is still dominated by Arbitrum, Optimism, and Polygon bridges, but "brand name" bridges such as Stargate, Multichain, Synapse Protocol, and CelerNetwork are eating away at established bridges, a trend likely to continue over time go down.
first level title
Active Users and Retention Trends
This article will focus on Across, Stargate, LI.FI, AnySwap, and Hop. Stargate currently leads in terms of active users, but LI.FI and Stargate have the highest retention rates.
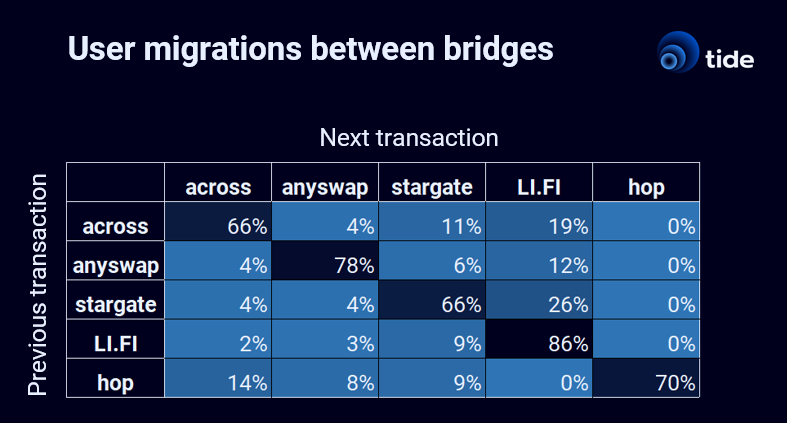
Migration between cross-chain bridges
Migration rate is a better indicator of how many users are switching to other cross-chain bridges. The table below shows the migration of users between cross-chain bridges.
Dismantling the growth data of cross-chain bridges: LI.FI and Stargate have the highest retention rates, and the impact of activity tasks on indicators is very short-lived
first level title
Marketing strategy
Despite these efforts, it is important to ask whether these activities will generate protocol revenue and significant increases in activity. In other words, what is the ROI of the marketing budget for protocol growth?
Let's take a look at a few cases.
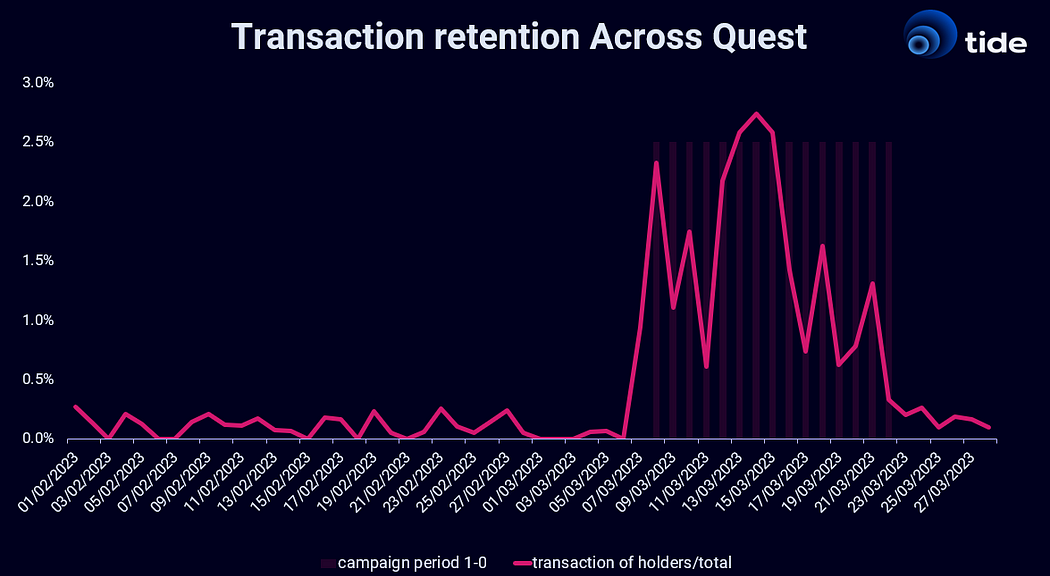
Across Galxe QuestAcrossDismantling the growth data of cross-chain bridges: LI.FI and Stargate have the highest retention rates, and the impact of activity tasks on indicators is very short-lived
Apes are minted into Arbitrum NFTs for user's share of transactions. As an event reward, users will be eligible to receive transaction fee cashback for a period of time after the event ends.
Polygon Degen
Transaction volumes for holders spiked during this period, however then dropped abruptly to pre-event levels, indicating a negligible impact on new users and transactions.
secondary title
Interestingly, the share of users was also high during the period leading up to the event. This could be due to other quests that took place during that period (for example, about 75% of Polygon Degens also hold the Galxe OP quest badge).
As in other cases, the event tasks have a very short-lived impact on the protocol metrics, and there is considerable overlap of wallets participating in the event tasks.
first level title
customer lifetime value model
Customer lifetime value (CLV) represents the total amount a customer is expected to spend on a company's products or services during their relationship with the company. CLV is a useful tool that allows protocols to effectively manage their marketing budgets and set a cap on customer acquisition costs (CAC).
Calculate it on the Stargate data using this simple formula
Volume: Bridge transaction volume in the first year, aggregate all user wallets
fee: protocol fee, 6 basis points
r: annual retention rate
By averaging over users and chains, we get:
image description
Stargate's CLV model
This is a very rough measure to help protocols effectively manage their marketing budgets and put a cap on CAC (Customer Acquisition Cost).
Here are three main aspects to consider:
CLV is fairly low - it will likely increase in the coming years as the average transaction on chain increases. Most users bridge very low amounts (see histogram below)
The most important variable under protocol control is retention, and CLV grows exponentially with retention.
Protocols should differentiate CLVs by user clusters, as average CLVs are not ideal in this case.
What should cross-chain bridges do to grow?
First, one must start measuring the important things: protocol activity, revenue, active users, etc.


