
DApp Annual Report: DeFi is no longer the dominant application type on Ethereum
With the development of DeFi and NFT, DApp has taken a big step on the road to successfully landing the C-end of the blockchain, and the outline of Web3.0 is faintly visible. However, in 2022, affected by changes in the overall market environment, the development of DApps has not experienced the same rapid growth as in the previous two years, and is generally relatively stable. In addition to the upsurge of M2E at the beginning of the year, there are also storage and social media DApps that have attracted a lot of attention. However, these new changes are still in the accumulation of quantitative changes, and have not yet formed a force to promote qualitative changes in the industry.
The importance of DApp to the development of the industry is self-evident. In this article, the data news column PAData under PANews will review its development in the past year, and will discuss the eight articles of Ethereum, EOS, Tron, Solana, Avalanche, BNB Chain, Polygon, and Optimism. The current situation of all 4464 DApps on the public chain will be analyzed, and at the same time, the top 10 DApps with the highest user activity among the five major DApp types, namely Games (games), DeFi, Marketplace (trading market), Collectibles (NFT collections), and Social&Media (social media), will be analyzed. 50 DApps are analyzed, trying to fully display the 2022 of DApps from the cross-perspective of "public chain x type x user".
Summary:
1) DApps on BNB Chain and Ethereum are mainly composed of 3 types, and all types are fully covered, but the ecologies on the other 6 public chains are only composed of 1-2 types, and some types are missing. Collectibles on Ethereum have surpassed DeFi to become the dominant type, accounting for about 50% of the total.
2) According to the average number of daily active addresses of each active DApp in the last 30 days to estimate the number of active addresses for the whole year, the estimated total number of active addresses for 4464 active DApps in 8 public chains is about 113 million. Among them, BNB Chain has the most active users, followed by Polygon, Ethereum, and Optimism.
3) This year, only the active addresses of Social&Media head applications showed an upward trend, and the cumulative active addresses increased by 1583.75% from January to December. The decline of DApps in the other 4 categories is between 50% and 80%.
4) This year, only the number of transactions of the head application of Social&Media has increased, and the cumulative number of transactions from January to December has increased by 715.26%. The other 4 categories have declined to varying degrees, of which Games has dropped by 17.47%, which is a small decline.
first level title
4,464 DApps have an estimated annual active address of 113 million, and DeFi is no longer the dominant application type on Ethereum
The major public chains have long regarded the construction of DApp ecology as the primary development strategy. According to the monitoring of DappRadar, at present, the public chains with a large number of DApps and many active addresses mainly include Ethereum, EOS, Tron, Solana, Avalanche, BNB Chain, Polygon, and Optimism. PAData captures the DApps whose number of active addresses is not zero in the last 30 days on these 8 public chains, and obtains a total of 4464 active DApps.
According to statistics, from the perspective of "public chain x type", BNB Chain has surpassed Ethereum to become the public chain with the largest number of active DApps, with a total of 1,779 observed. Among them, in terms of quantity, DeFi is the dominant type on BNB Chain, with a total of 709, accounting for about 40% of the total. Secondly, HighRisk (high risk) and Games are also the main types on BNB Chain, with 456 and 346 respectively, accounting for about 26% and 20% respectively.
Secondly, the number of active DApps on Ethereum also exceeded 1,000, reaching 1,259. Among them, Collectibles surpassed DeFi to become the dominant type, with a total of 625 observed, accounting for about 50% of the total. DeFi and Games have become the main types, with 304 and 160 respectively, accounting for about 24% and 13% respectively.
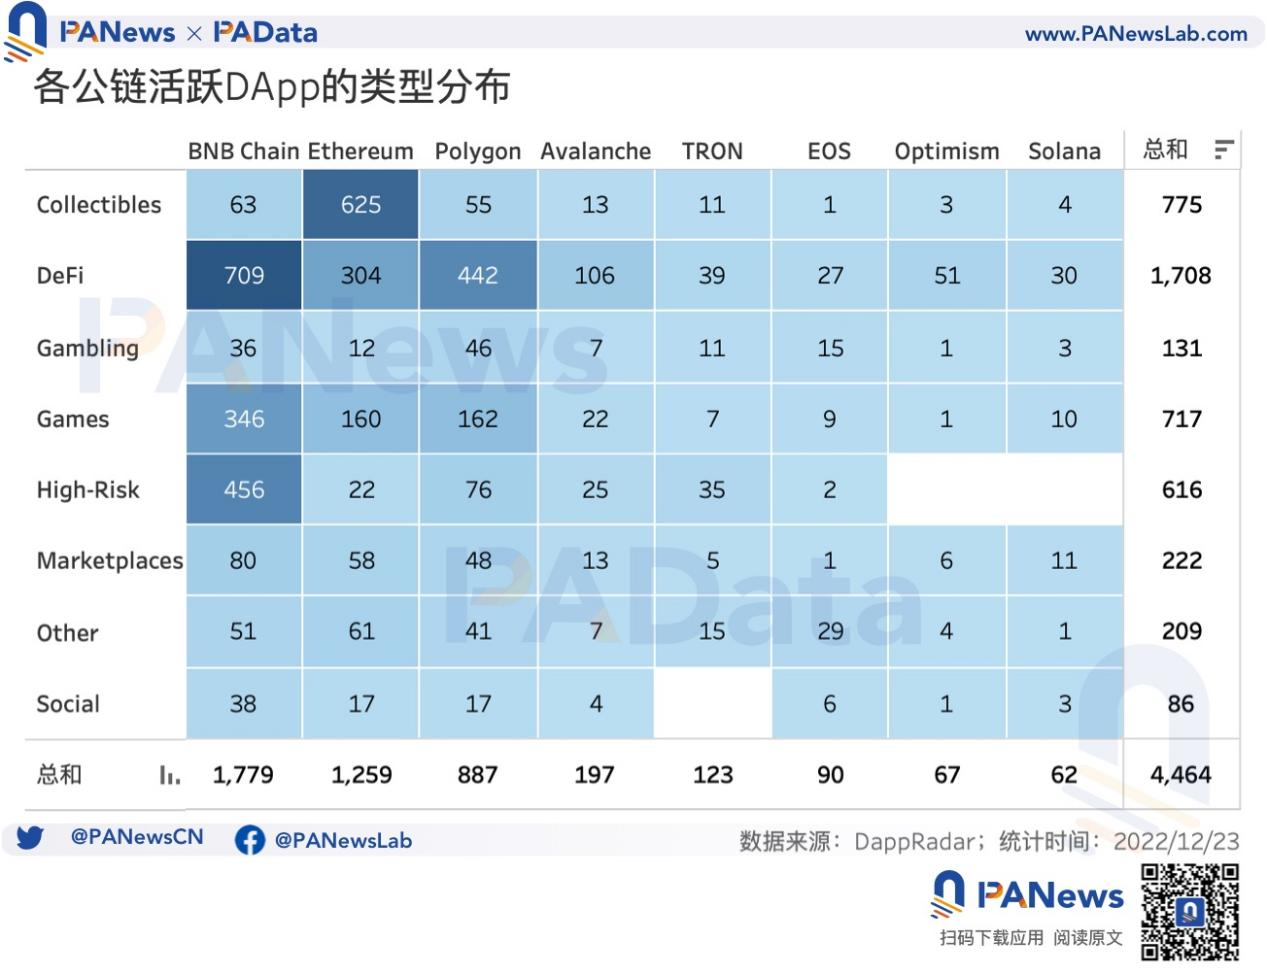
In general, the DApps on BNB Chain and Ethereum are mainly composed of 3 types, and all types are fully covered, but the ecologies on the other 6 public chains are only composed of 1-2 types, and some types are missing. For example, Polygon ranks third in the number of active DApps. Among the 887 active DApps, there are 442 DeFi DApps, accounting for about 50%, and 162 Games, accounting for about 18%. Avalanche ranks fourth in the number of active DApps. 106 of the 197 active DApps are DeFi, accounting for about 54%. The number of active DApps on TRON, EOS, Optimism, and Solana is relatively small, mainly based on DeFi.
From the perspective of "public chain x users", the number of active addresses for the year is estimated based on the average number of daily active addresses of each active DApp in the last 30 days. billion. Among them, BNB Chain has the most active users, followed by Polygon, Ethereum, and Optimism. The total number of estimated annual active addresses of 1779 active DApps on BNB Chain is 53.02 million, which is much higher than that of the other 7 public chains. Secondly, the total number of estimated annual active addresses of the 887 active DApps on Polygon is 24.65 million, and the estimated total number of annual active addresses of all active DApps on Ethereum and Optimism is also more than 10 million. The remaining 4 public chains are affected by the small number of active DApps, and the estimated total number of annual active addresses is also small.
However, it should be pointed out that in the last 30 days, affected by the overall downturn in the market atmosphere, the number of active addresses has also decreased, so it is estimated that the number of active addresses for the whole year may be relatively small. But as a unified cut, it does not affect the comparison of the active addresses of each public chain.
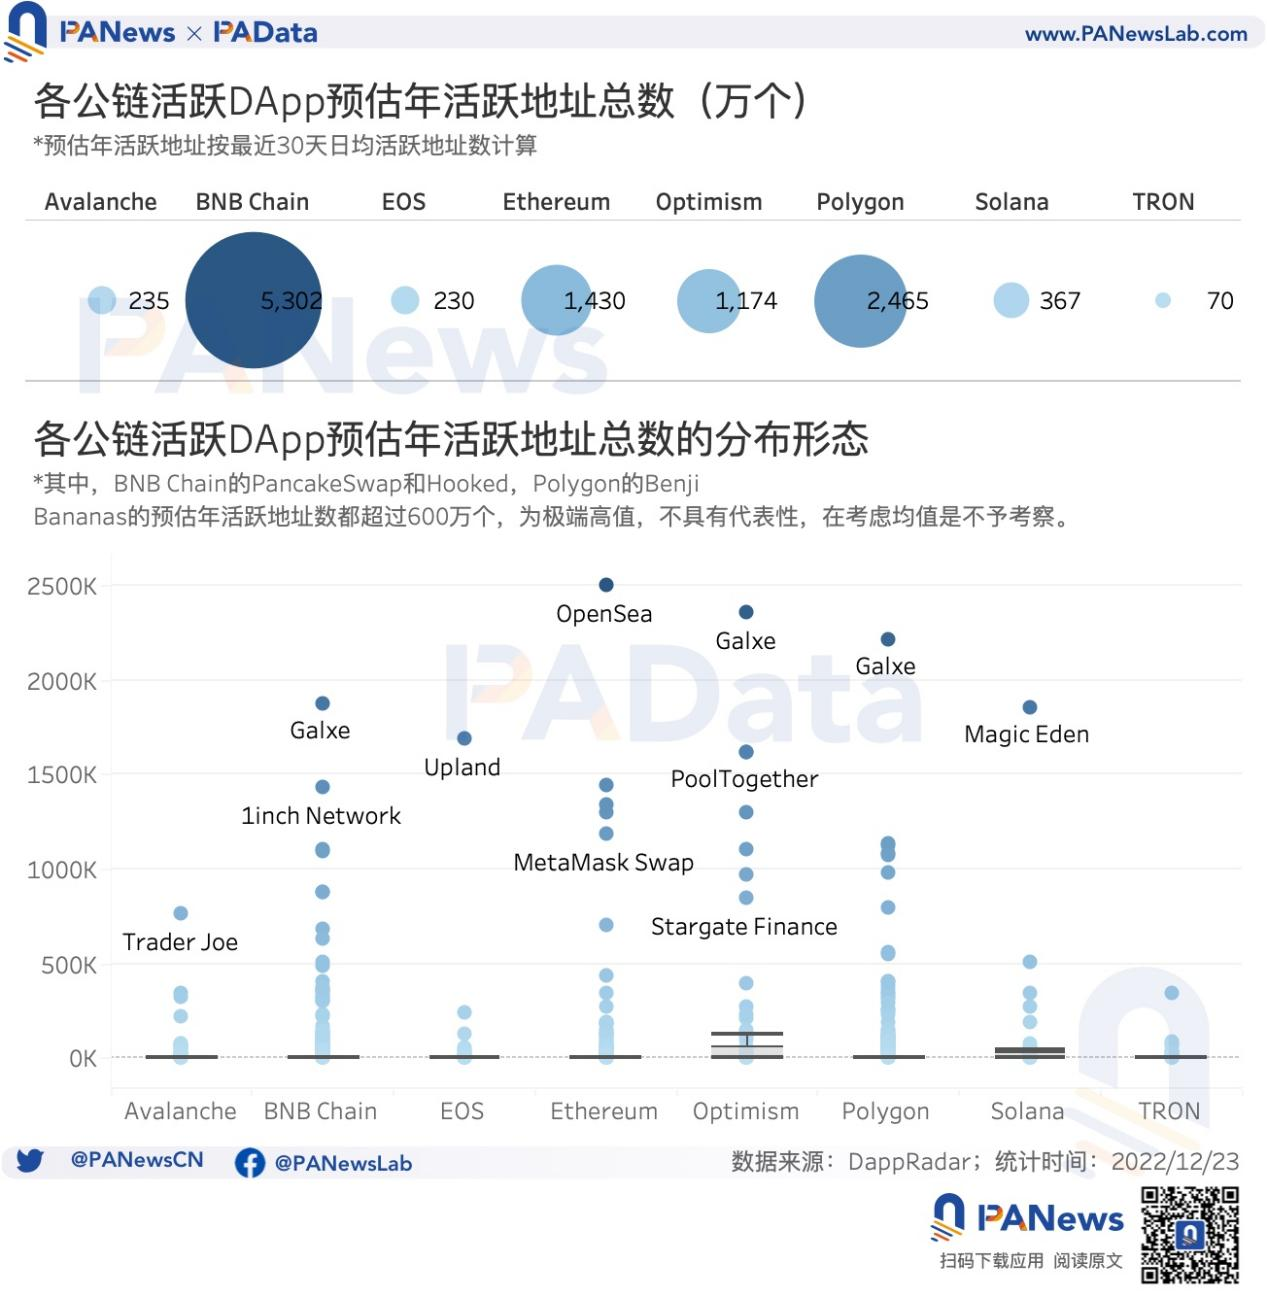
In order to eliminate the influence of the total number of active DApps on the observation of the number of active addresses of DApps in each public chain, PAData also calculated the average value of the estimated annual active addresses of a single DApp in each public chain. After removing the extreme high values, Solana has the highest estimated median annual active addresses of a single DApp, which is about 1782, followed by Optimism, which is about 1387. It is estimated that the median annual active address of a single DApp on other public chains is basically around 100-300.
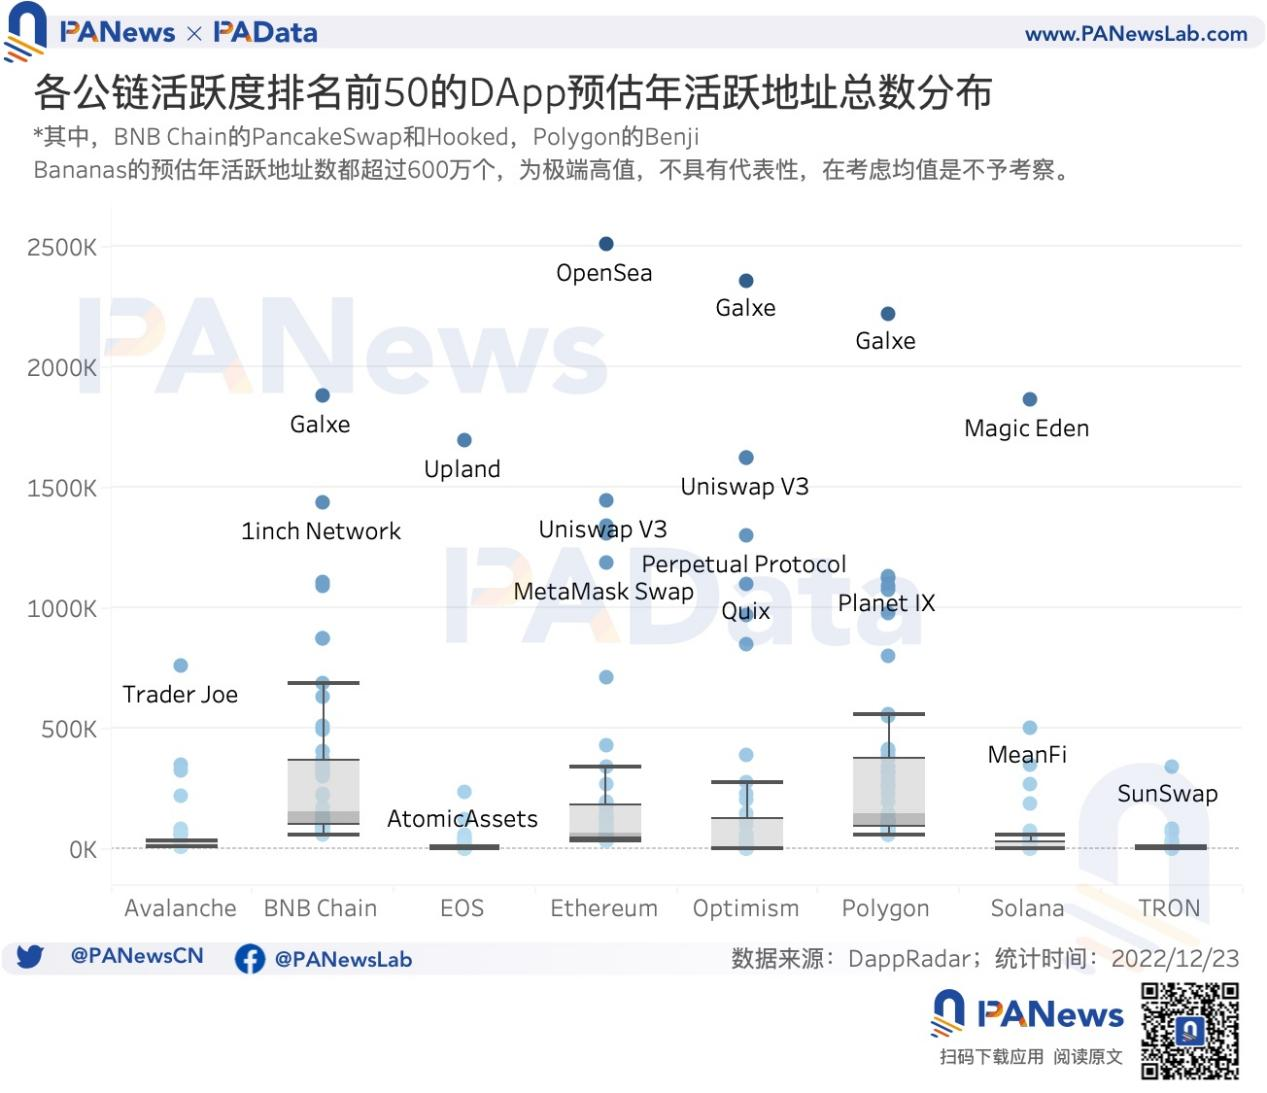
From the morphological distribution, it can be seen that the estimated annual active address distribution of a single active DApp in each public chain is very discrete, and is generally affected by long-tail DApps with low activity. In order to correct this effect, on this basis (excluding extreme values), PAData focused on observing the estimated annual active addresses of the top 50 public chains (top 50 average daily active addresses in the last 30 days) of DApps.
first level title
The annual active addresses of top games are 245 million, and the number of active addresses and transactions of social media has increased significantly
Different types of DApps show obvious differences in the scale and behavior patterns of users. At present, there are a large number of DApp types that have attracted much attention, mainly including Games, DeFi, Marketplace, Collectibles, Social&Media. It is considered to be a key area for the future development of DApp, and this category will not be further observed.
PAData selected the top 10 active DApps in each category with the highest number of active addresses in the last 30 days as analysis objects (hereinafter referred to as top DApps), among which SimpleFX in the DeFi category, Collect Trump Cards, Valhalla, Art Blocks Experimental and LaLiga Golazos, Blur in Marketplaces has a high number of active addresses in the last 30 days, but the data collection time is less than 3 months, which is not conducive to observing the annual data, so it is not considered. Up to 10 pieces. In addition, the focus here is on the differences in user scale and behavior patterns of different types of DApps. Therefore, although the selection of specific DApps has a certain degree of contingency, it does not affect the validity of the assumption that the performance of top applications has overall representativeness. .
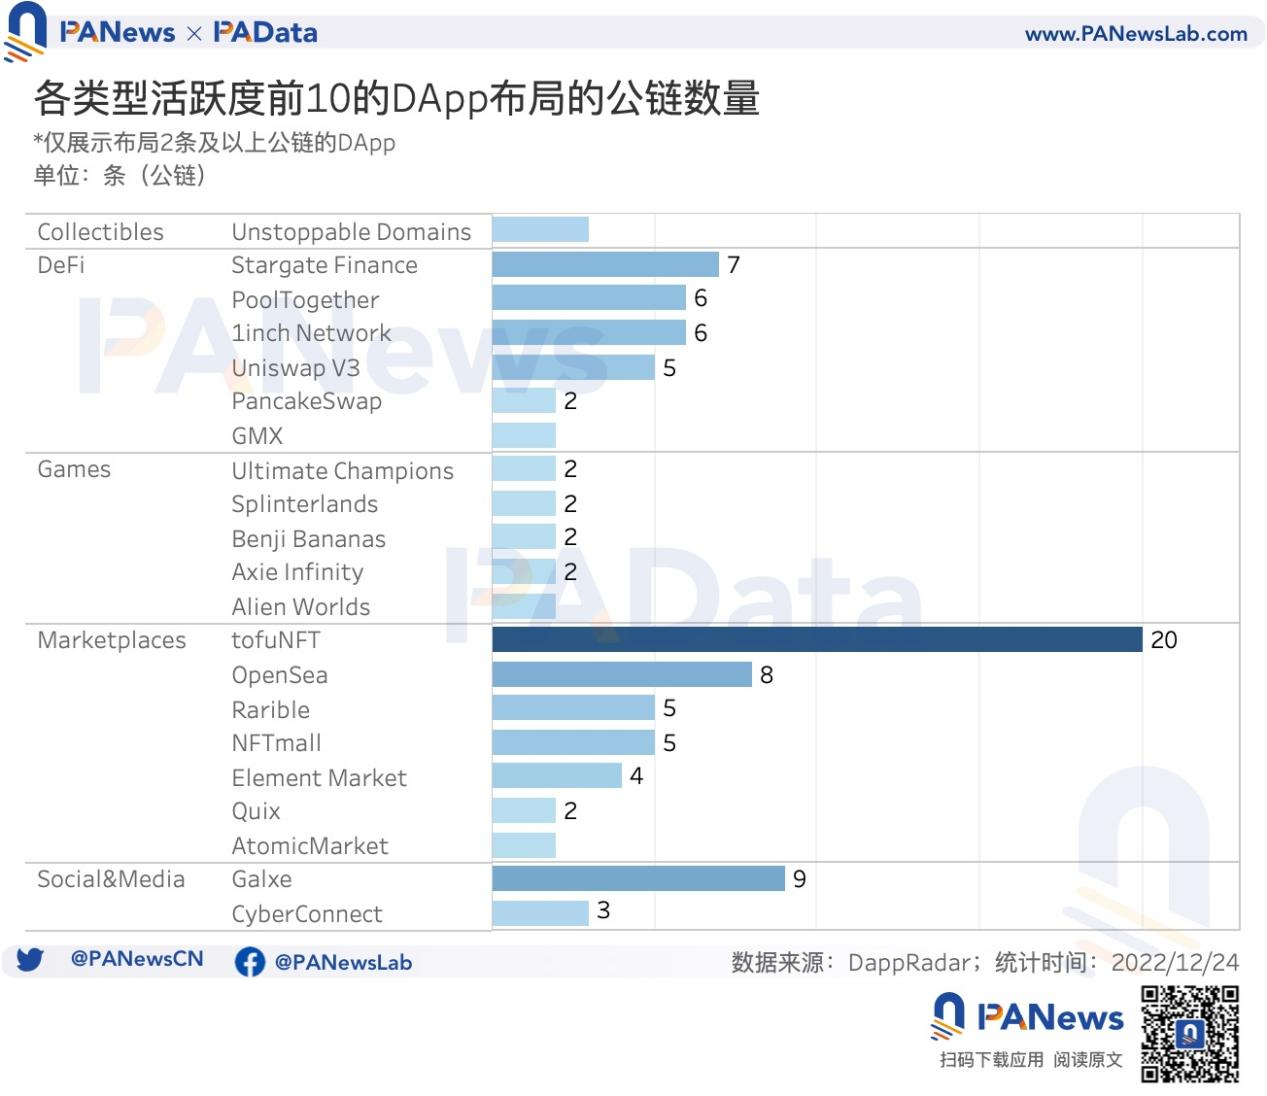
From the perspective of multi-chain layout, Marketplaces and DeFi top DApps have 6-7 multi-chain layouts with more than 2 public chains, and 4-5 of them have realized multi-chains with 5 or more public chains Layout form. There are also 5 DApps in Games that have completed the multi-chain layout of 2 public chains, but only 1-2 DApps in Collectibles and Social&Media have achieved multi-chain layout. In general, the multi-chain layout of various DApps is the general trend, but there is still room for further expansion of the multi-chain layout for multiple types including Games. The increase in cross-chain circulation is conducive to enhancing the usability of DApps.
From the perspective of "type x users", the total annual active addresses of 50 top DApps in 5 categories are about 455 million. Among them, Games' head DApp has a total of 245 million active addresses throughout the year, the highest among all types. Followed by DeFi, the total number of active addresses of the top DApps throughout the year is 114 million, the lowest is Collectibles, the total number of active addresses of the top DApps is only 5.67 million throughout the year.
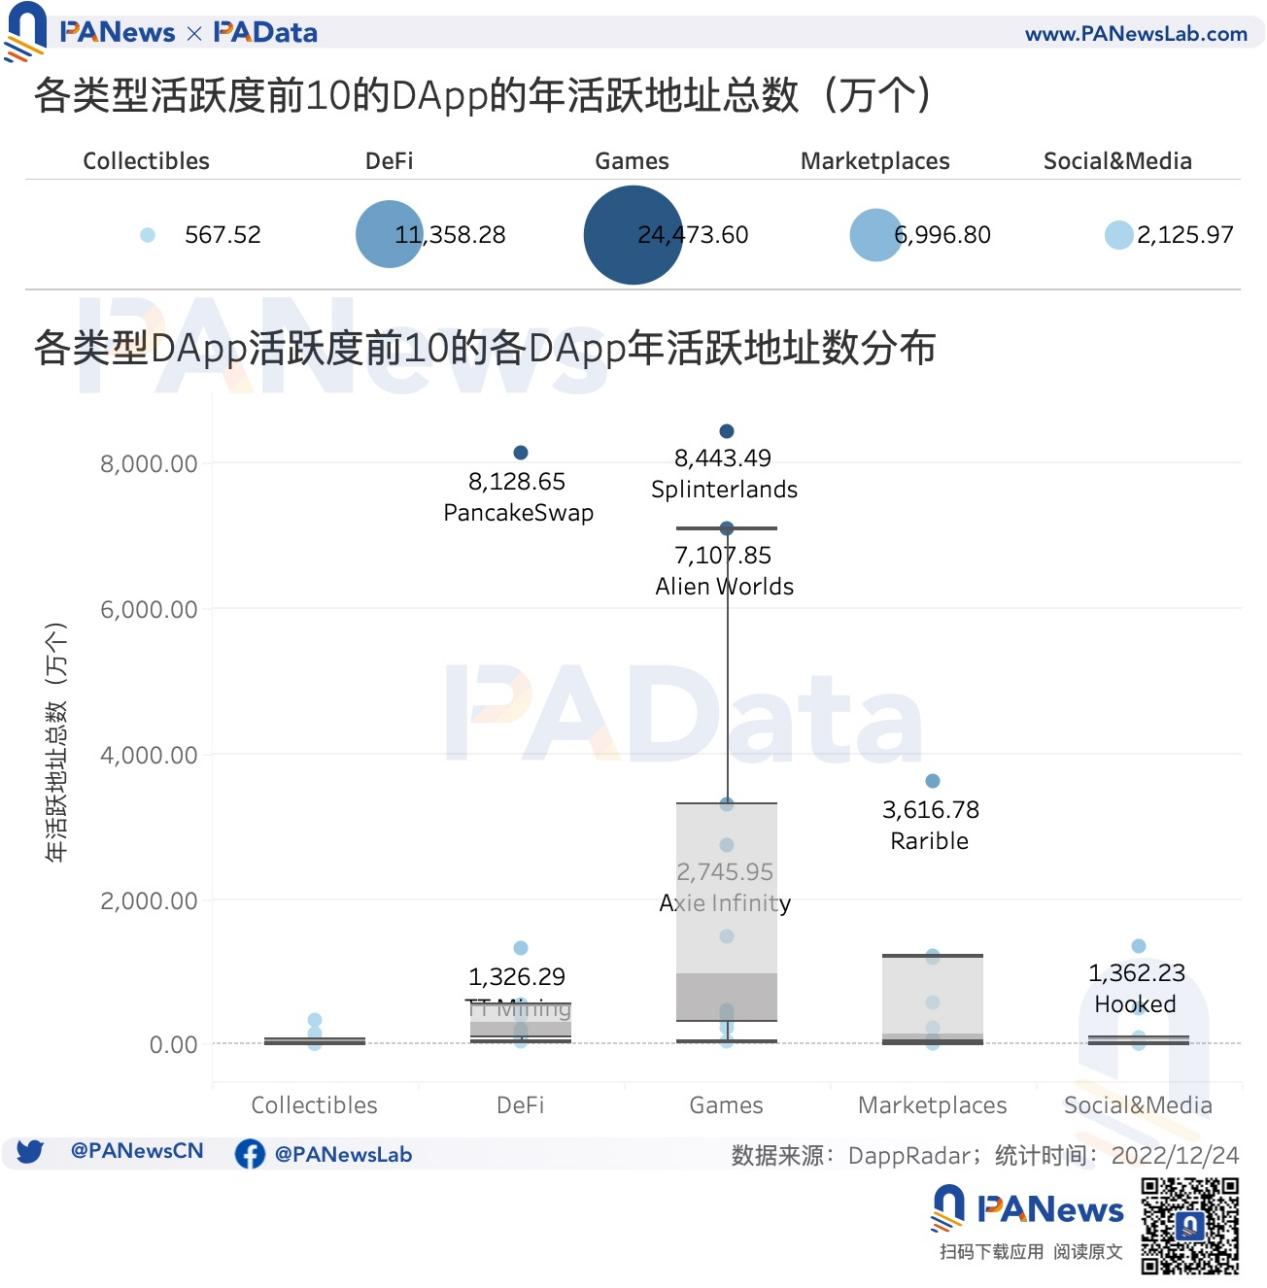
Moreover, the active addresses of Collectibles head applications are not much different, and the distribution is relatively concentrated. The median number of active addresses of a single head DApp is only 81,300, and the highest is only 3.2 million. Similarly, Social&Media has a lower annual active address of a single top DApp, with a median of about 271,900. On the contrary, the annual active addresses of Games and DeFi head applications are much more, with a median of 9,744,300 and 2,984,300, and a maximum of 80 million. The characteristic of Marketplaces is that there are great differences between top applications, so although the maximum number of annual active sites exceeds 36 million, the median number is only 1,446,100.
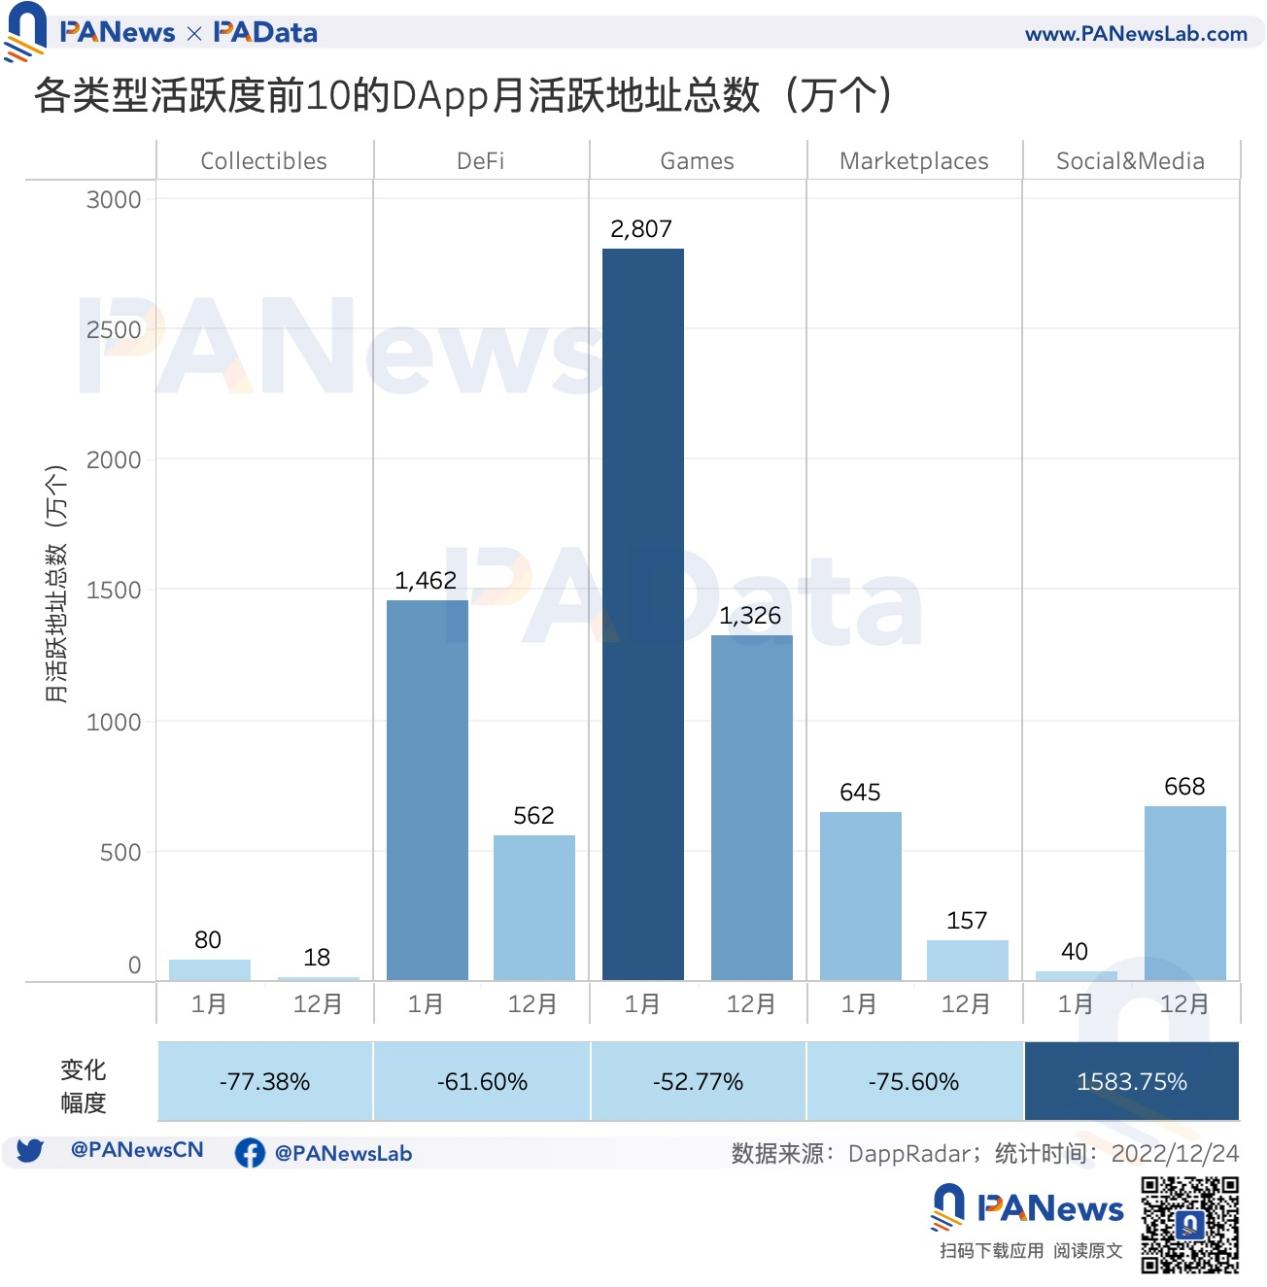
In addition, judging from the changes in the active addresses of various types of head applications, there is one point that deserves special attention. That is to say, only the active addresses of Social&Media head applications showed an upward trend this year, from 400,000 active addresses in January to 6.68 million active addresses in December, an increase of 1583.75% for the whole year. However, the annual active addresses of the other four categories of DApps showed a downward trend, and the cumulative active addresses from January to December decreased between 50% and 80%.
In addition, the number of transactions and the transaction amount are also an aspect of user behavior patterns. From the perspective of the number of transactions, the total number of transactions for the 5 major categories of 50 top DApps in the whole year is about 8.275 billion times. Among them, the top DApp of Games has the highest total number of transactions in the whole year, about 7.14 billion times, about 86% of the total. Followed by Marketplaces, the total number of transactions of the top DApps in the whole year is about 777 million times. Collectibles and Social&Mediia’s top DApps had a relatively low total number of annual transactions, only 30.26 million and 56.82 million, respectively. This is related to the characteristics of the application type itself. Games have ultra-high frequency interaction characteristics, while Collectibles and Social&Media usually require interaction when casting NFT, and the interaction frequency is low.
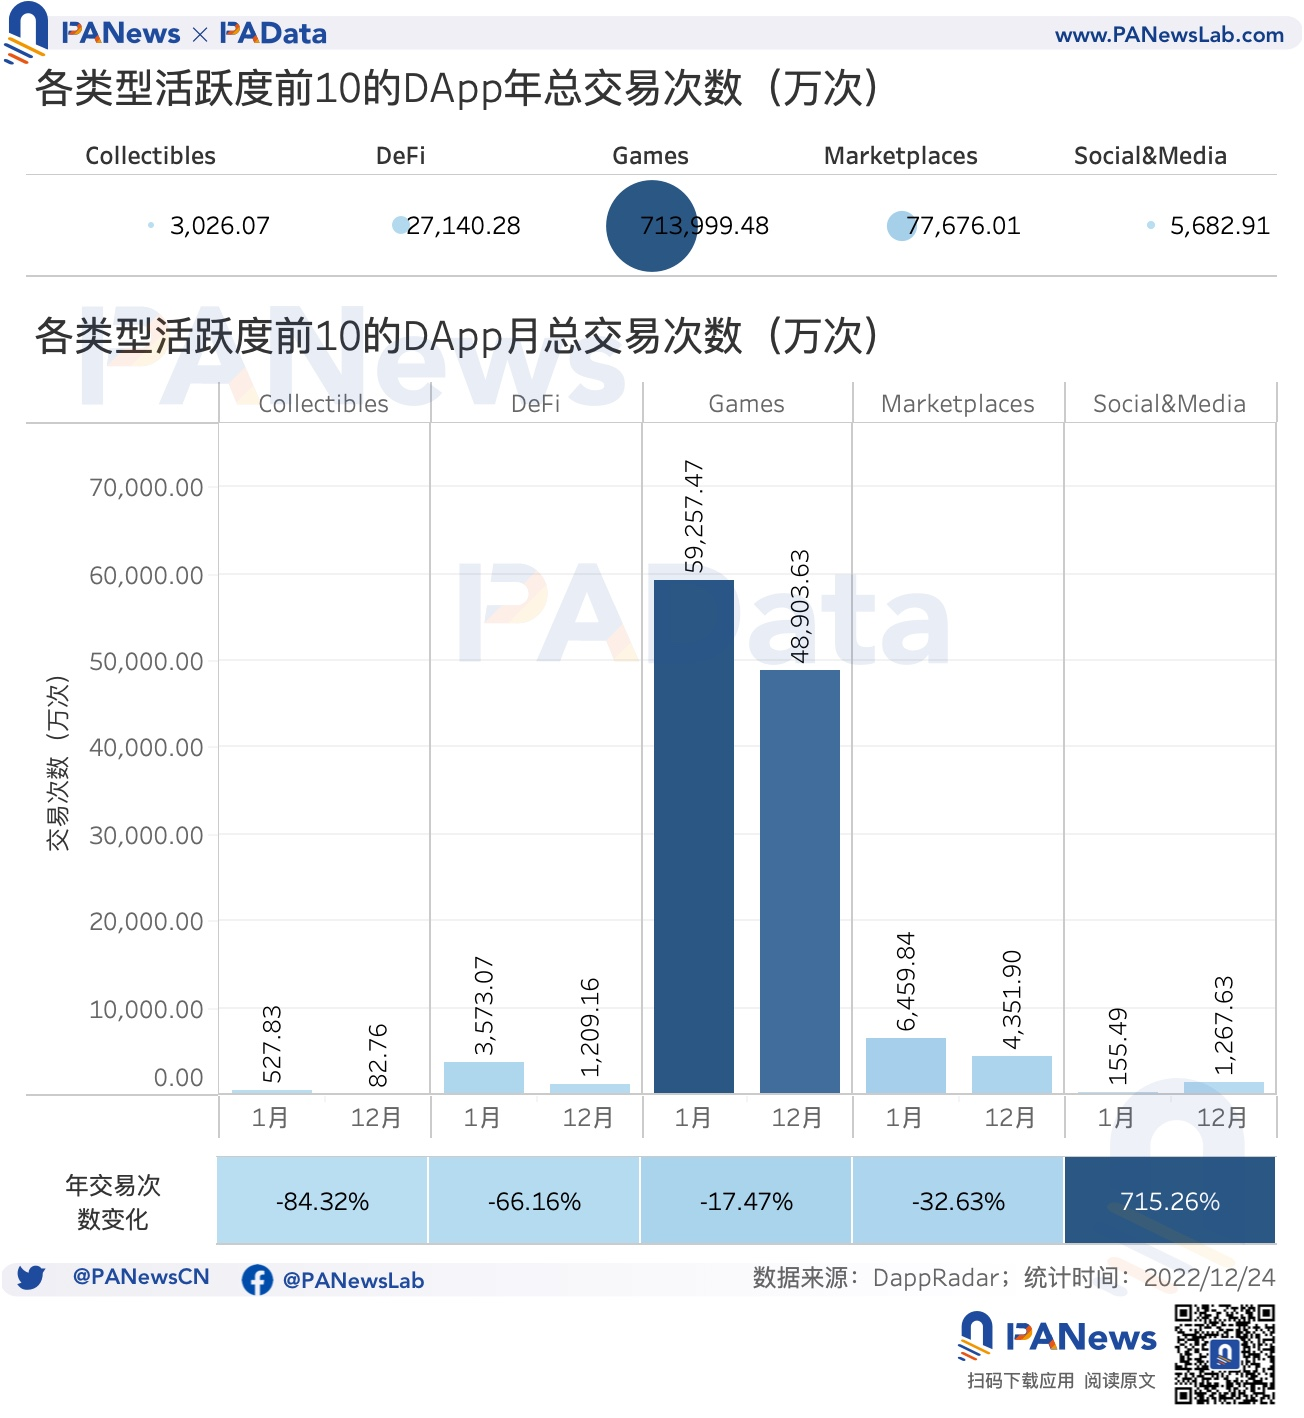
From the perspective of the annual changes in the number of transactions, only Social&Media is growing. The total number of transactions of its top DApp rose from 1.5549 million in January to 12.6763 million in December, an annual increase of 715.26%. The other 4 categories have declined to varying degrees. Among them, the total number of transactions of the top DApp of Games has dropped by 17.47% from January to December, which is a small decline. The total number of transactions of Collectibles has dropped by more than 84% in the same period. .
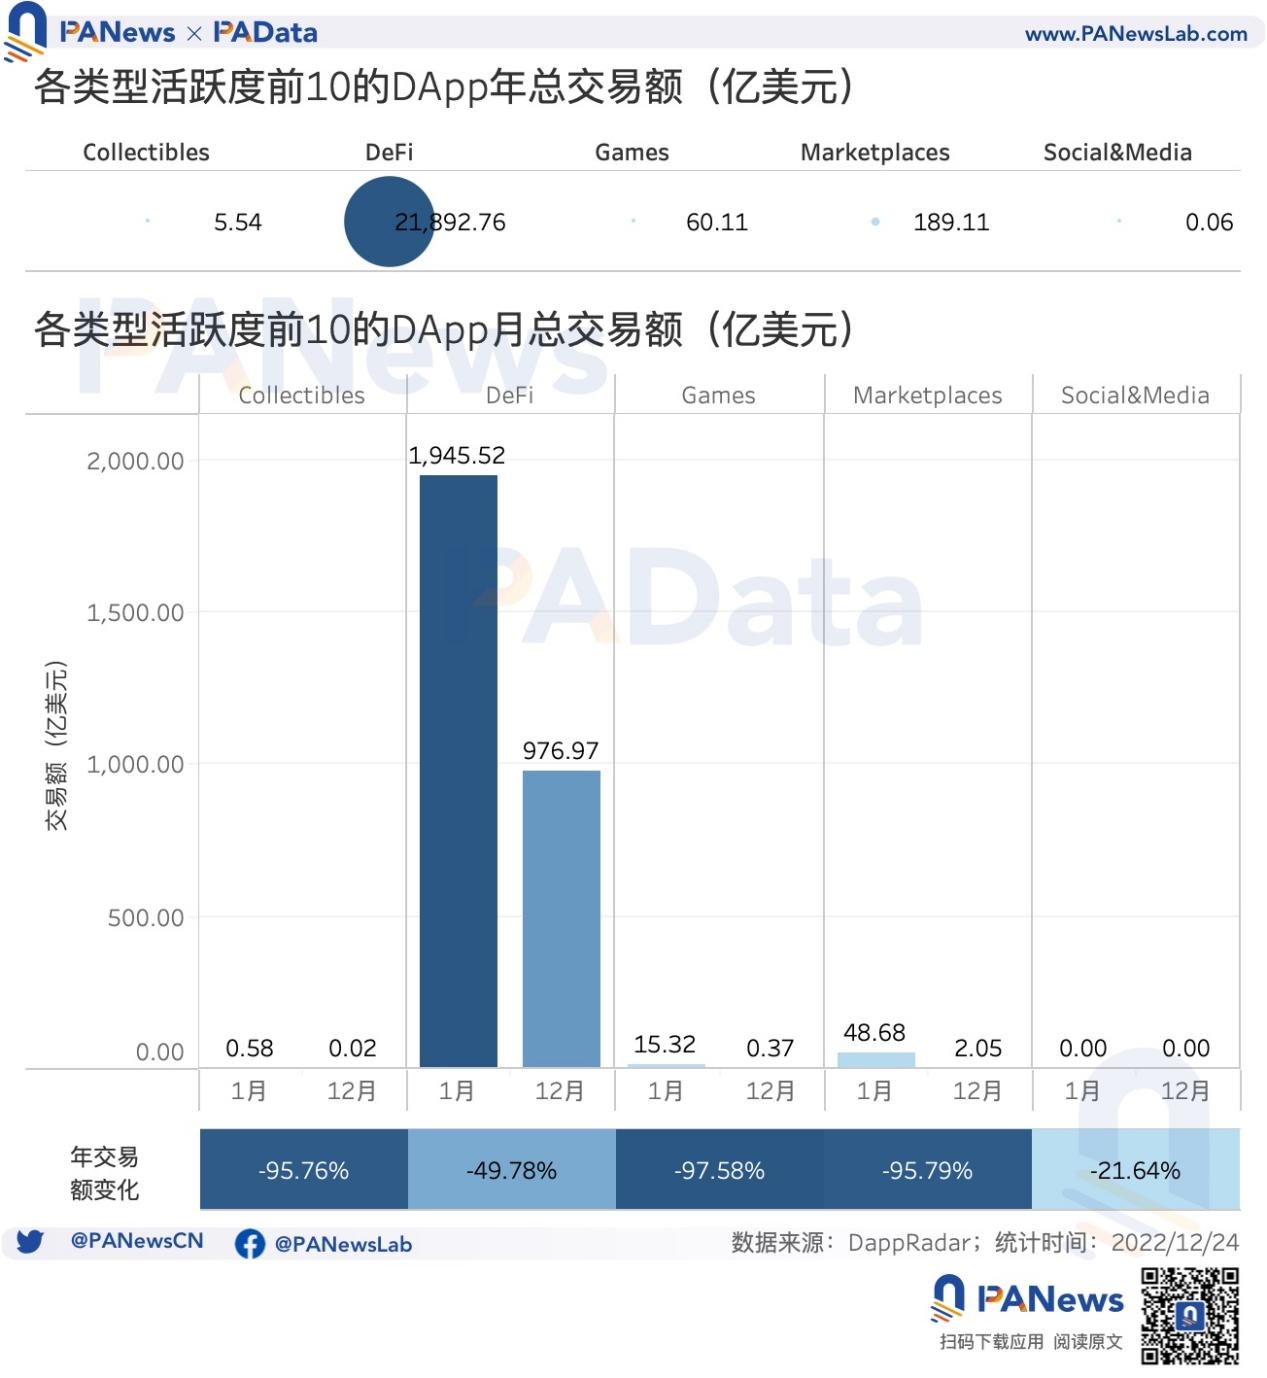
From the perspective of transaction amount (transaction amount that occurs when interacting with DApp contracts), the total annual transaction amount of the 5 major categories of 50 top DApps is about 2.21 trillion US dollars. Among them, the total annual transaction volume of DeFi top DApps is about 2.19 trillion, accounting for about 99% of the total. The transaction volume of other types of DApps is very small. Among them, the total transaction volume of the smallest Social&Meida top DApp in the whole year is only about 6 million US dollars.
Combined with the number of transactions, it can be seen that the user behavior characteristics of Games are obvious small-amount ultra-high-frequency interactions, DeFi is ultra-high-amount medium-frequency interactions, and Collectibles and Socia&Media are both ultra-small and ultra-low-frequency interactions.
first level title
The average monthly number of developers for top apps is 437, and the average monthly total revenue has dropped sharply to 24 million US dollars
Finally, PAData also counts the development and revenue of top applications. According to TokenTerminal data, the 15 DApps with a large number of developers include Chainlink, yearn.Finance, The Graph, MakerDAO, Uniswap, Lido Finance, Rarible, Synthetix, Balancer, Trader Joe, Livepeer, UMA, Aave, Opensea, SushiSwap.
The average monthly total number of developers of the 15 DApps is about 437, of which the total number of monthly developers in the first half of the year is higher than that in the second half of the year. In other words, the development activity in the first half of the year is higher than that in the second half of the year. Overall, the annual development activity showed a downward trend. Among them, March, April, and June are the time periods with high development activity throughout the year, and the total number of developers every month is more than 480. On the other hand, October and December are periods of low development activity throughout the year, and the total number of developers per month is below 400.
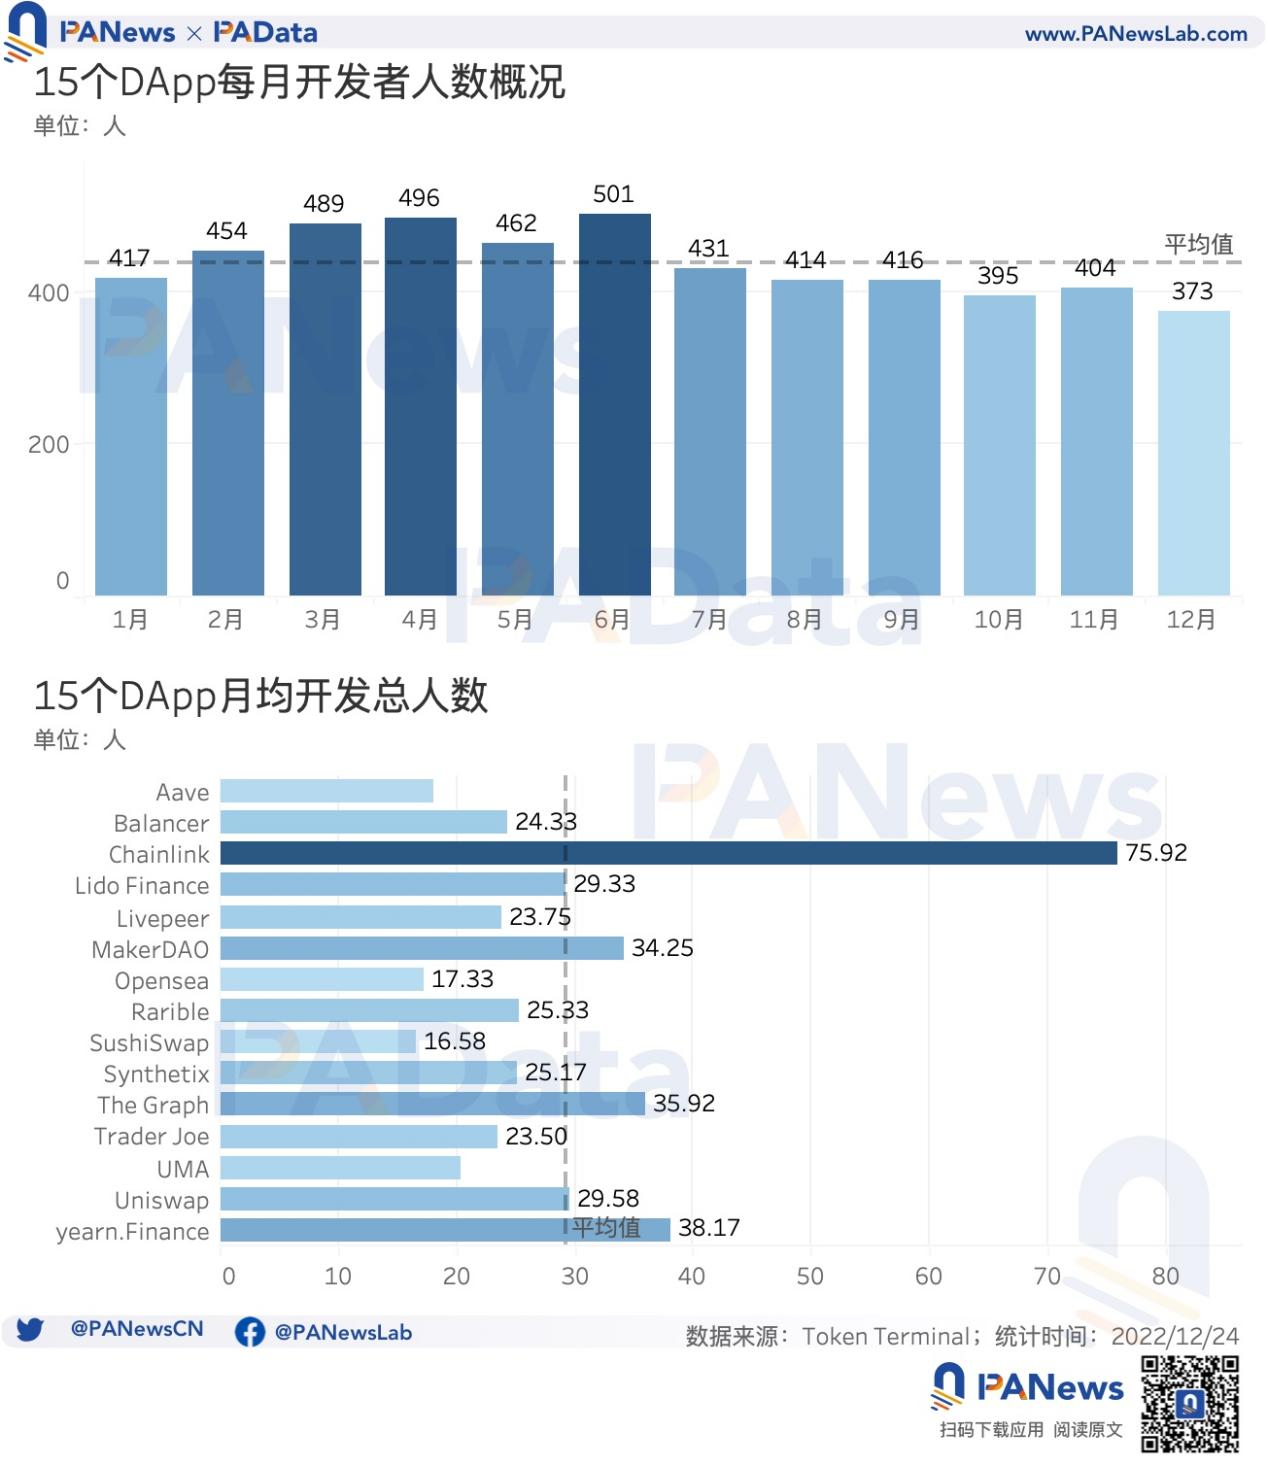
From the perspective of a single DApp, the average monthly total number of people per DApp throughout the year is about 29. Among them, Chainlink is the highest, with a total monthly average of 75 developers. Secondly, MakerDAO, The Graph, and yearn.Finance also have relatively high monthly developers, all exceeding 30.
Also according to the data from TokenTerminal, the 20 DApps with higher cumulative total revenue (total transaction fees received) include LooksRare, Opensea, dYdX, PancakeSwap, Convex Finance, Ethereum Name Service, MakerDAO, Decentral Games, Axie Infinity, Synthetix, GMX, Lido Finance, 1inch, yearn.finance, SushiSwap, Aave, Trader Joe, X2Y2, Tornado Cash, SpookySwap.
The combined average monthly revenue of the 20 DApps is about $152 million and shows a significant downward trend throughout the year. The total revenue in January was as high as 515 million US dollars, but the total revenue in December has dropped to 24 million US dollars, a 95.34% decline for the whole year. After June, the total monthly revenue of 20 DApps has never exceeded 70 million US dollars. It can be seen that the revenue of DApps is greatly affected by the overall market environment.
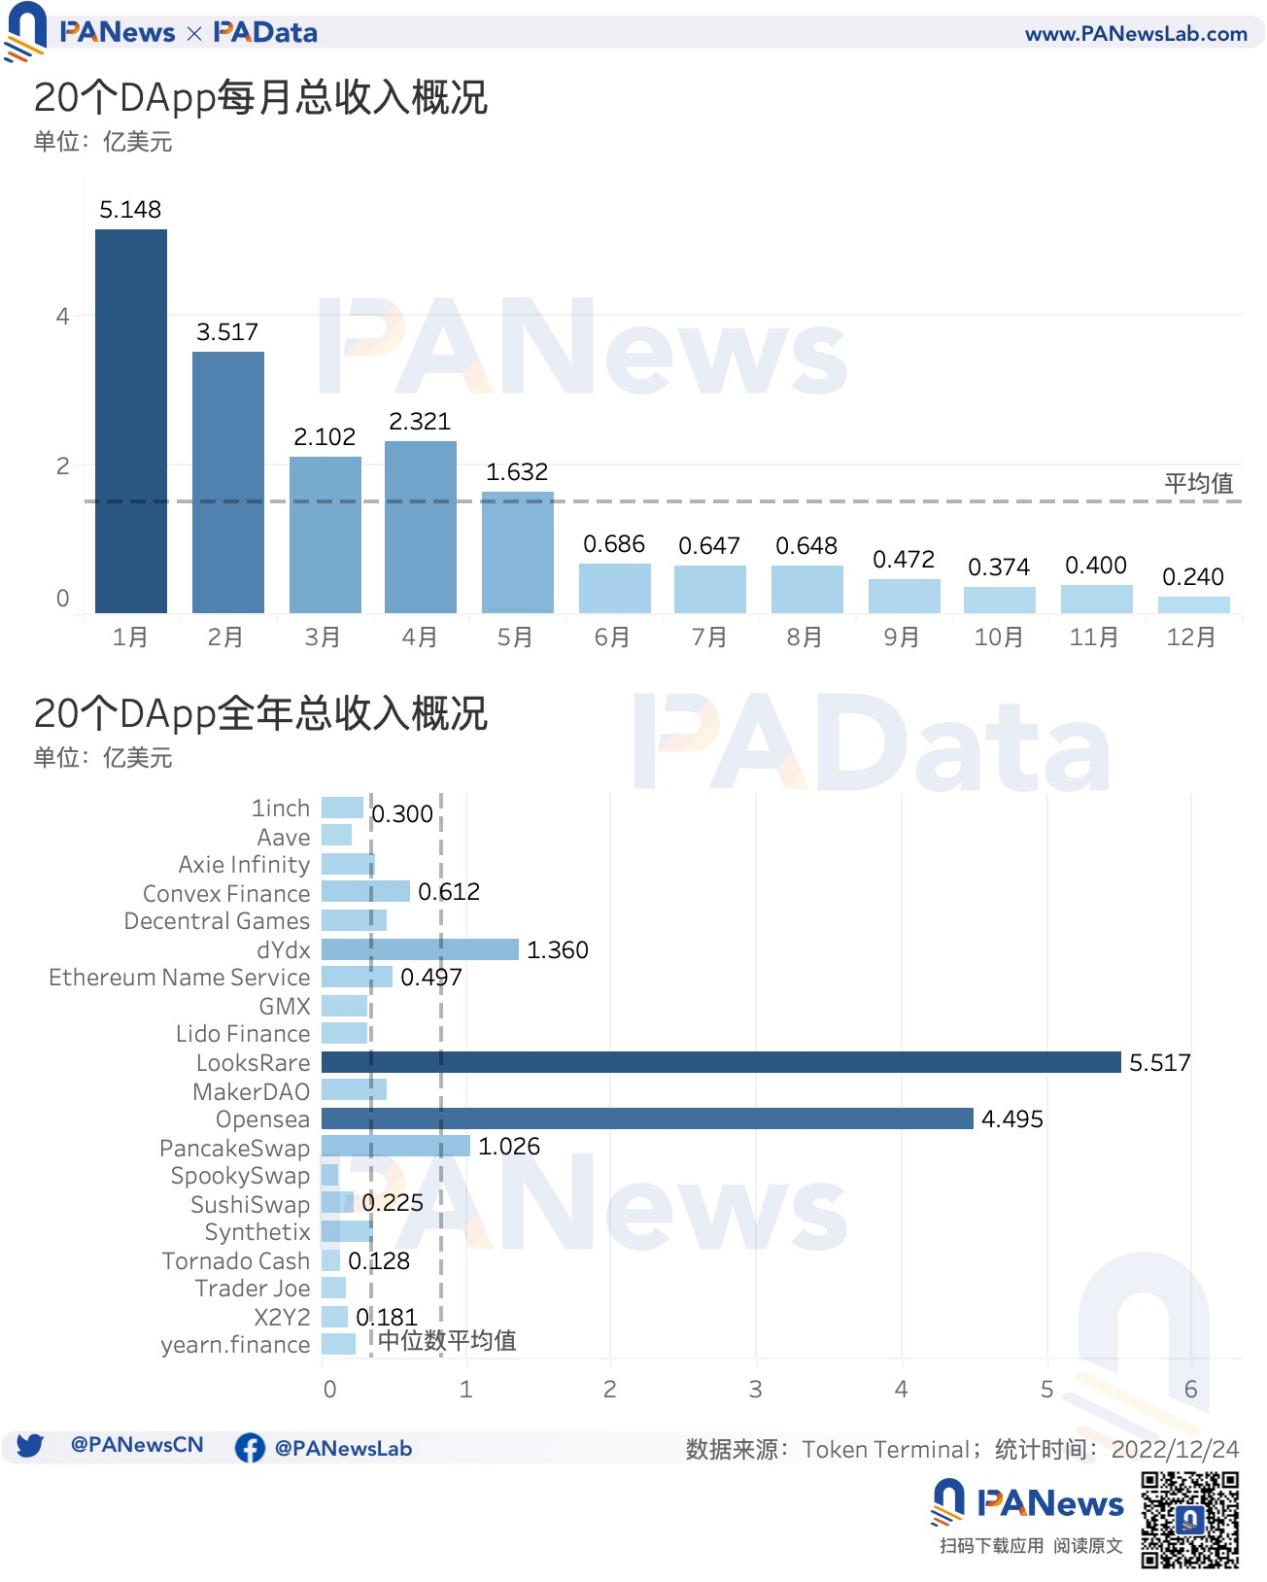
From the perspective of a single DApp, the two NFT trading markets, LooksRare and Opensea, are the DApps with the highest total revenue for the year, reaching US$552 million and US$450 million respectively. But other than that, the total annual revenue of other DApps is much lower, with only two DeFi DApps, dYdX and PancakeSwap, exceeding US$100 million. The average annual total revenue of the 20 DApps is about US$83 million, but if the impact of extreme high values is excluded, the median is only US$35 million. In general, the revenue performance of top DApps is relatively good.


