
One article summarizes the third-party data platform on the chain
first level title
I. Overview
As of June 30, the total number of transactions on Ethereum was 1.6 billion, processing 12 transactions per second, and the total number of transactions on Binance was 3.1 billion, processing 40 transactions per second. Contains the investment analysis logic and arbitrage psychology of investors in the market. We can understand the behavior of investors by looking at the transaction data on the chain, such as well-known public figures, giant whales or institutions. The behavior of buying or selling will cause market fluctuations, which in turn will affect the decisions of other users.
On the one hand, facing so much data on the chain, as institutional investors and retail investors, if there is a ready-made data aggregator that provides data integration on the chain, timely data update and classification, and provides corresponding visual charts, then It will greatly improve the efficiency of on-chain investment.
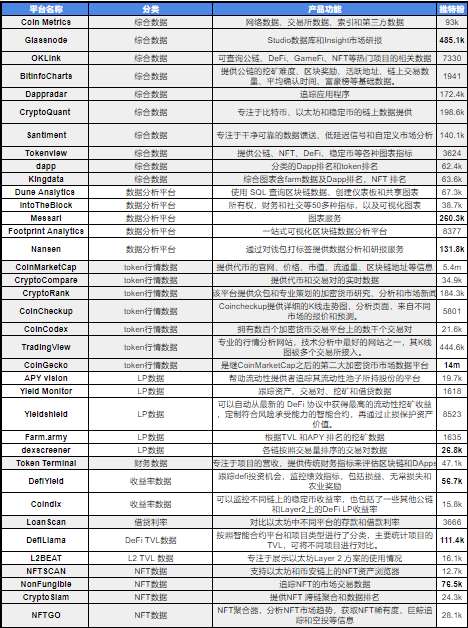
There are many such platforms in the market. This article counts 37 data platforms according to different functions in the following table, and conducts a detailed analysis on the four dimensions of token market data, data analysis platform, LP data and NFT data later.
Glassnode
The comprehensive data platform can provide data analysis based on information. Compared with the blockchain browser, it reflects the functionality of the tool, and most platforms set fees. There are 10 comprehensive data platforms listed in the table above, and we briefly introduce the top four media attention: Glassnode, CryptoQuant, Dappradar and Santiment.
Glassnode is a blockchain data and information provider that provides on-chain data while capturing transaction signals to make objective investment decisions. Well-known investment institutions, professional quantitative trading teams, and blockchain consulting platforms are all using the data information provided by glassnode. At present, glassnode mainly has two major sections: the Studio database and the Insight market research report derived from it. Additionally, users can learn about different on-chain analytics concepts and metrics in Glassnode’s free «Academy».
CryptoQuant
CryptoQuant is a blockchain data solutions provider based in Seoul, focusing on Bitcoin, Ethereum and stablecoins. Its data, available through an API or directly in Python, R, and Excel, can be divided into four subsets:
1) Data on the chain
1) Data on the chain
2) exchange data
3) Miner data
4) Network data
Dappradar
Premium starts at $29, Professional starts at $99, and Essentials starts at $699. It also has a free plan to view all metrics.
Santiment
Santiment is a comprehensive cryptocurrency market intelligence platform focusing on clean and reliable data feeds, low latency signals and custom market analysis utilizing on-chain, social, development and other data sources. Santiment has three different plans, Free, Pro $49, and Pro+ $249, billed monthly. With the Pro+ plan, users also get exclusive features like customized education and onboarding, and closed chats with Santiment market analysts.
first level title
2. Token market data platform
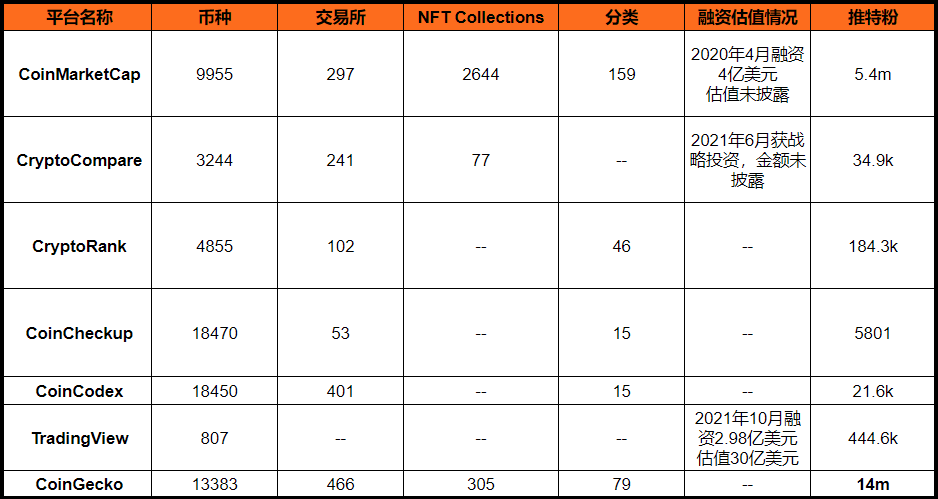
The Token market data platform represented by CoinGecko mainly provides token price query services. We can see the market value, transaction volume, circulation and historical data of tokens on the page. Some platforms can also check the price of tokens. Holder data, investment profit and loss data, etc.
This paper does not analyze representative projects for the time being.
3. Data analysis platform
secondary title
1. Function introduction
As shown above, it can be seen that the data on the chain is massive. Although there is a comprehensive data platform that provides data services to users, it is also necessary to classify and analyze data on the basis of data aggregation. For example, many addresses will conduct frequent token transactions, or participate in some unheard of new projects. If these historical data are counted, you can roughly judge the historical income of an address, or know what may be in the market. A new project that has been ignored by everyone. Of course, there are risks in simply tracking a single address. We don’t know whether the holder of this historically excellent address has another address for hedging operations.
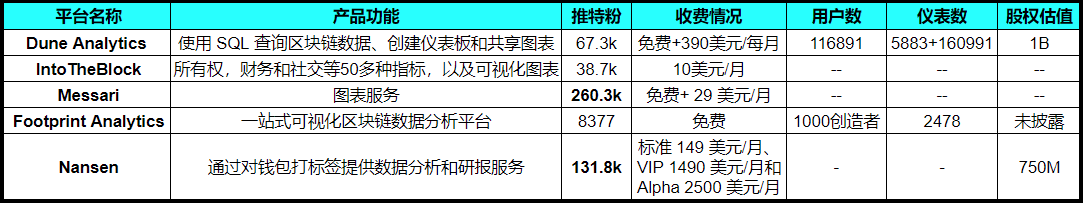
The following will introduce two representative projects of data analysis in detail: Nansen and Dune Analytics.
secondary title
2. Representative project of data analysis platform——Nansen
Founded in 2020, Nansen combines on-chain data with a proprietary activity database of over 100 million blockchain wallets to provide investors and financial institutions with real-time and actionable insights into the ever-expanding blockchain ecosystem insights.
In addition, the Nansen platform is used by leading cryptocurrency teams such as Axie Infinity, Polygon, and Lido, and has achieved more than 20 times user growth in the past year. In order to cover all kinds of users, Nansen has launched three levels of service, which are $150 per month (standard level), $1500 (VIP level) and $2500 (alpha level) per month. On March 25 this year, Nansen announced the opening of free version registration, and all users can view various data analysis results of the Nansen platform for free.
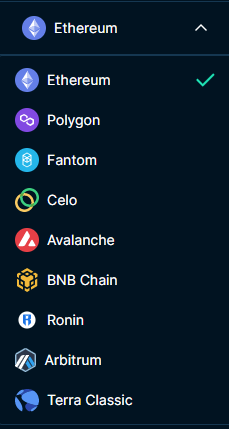
image description
The platform has now aggregated data from 9 chains
2.1 Platform functions
2.1.1 Classification labels
Nansen marks the addresses of investment institutions and KOLs, and also puts some special "classification tags" on the addresses by automatic identification based on algorithm methods (mainly relying on three methods: algorithms, manual investigations, and community submissions). The amount of funds and historical achievements are labeled with "Smart Money" (smart money) or "Giant Whale". Although it is impossible to know who the specific user behind the label is, such labels can be used to mark user portraits.
For those specific addresses, Nansen's team can locate them based on the user's or institution's own disclosure, ENS, or combined with the position data of investment institutions to lock specific addresses.
2.1.2 Data analysis, aggregation dashboard and other tools
For these labeled addresses, Nansen conducts further data tracking and sorting. The simplest thing is to pay attention to the position data of certain projects and tokens, which well-known institutions are the core participants, and their recent trends in increasing and decreasing positions, etc. In fact, these relevant data can also be obtained in Etherscan, but in terms of address labels, Nansen will be more comprehensive.
In addition, Nansen will aggregate the transaction data multiple times to provide more high-latitude trend data, such as the transaction volume data of tokens on different decentralized exchanges, the average holding time, the number of token holders, or It is possible to cross-contrast the coincidence degree of two token holders and so on.
2.1.3 Custom Functions
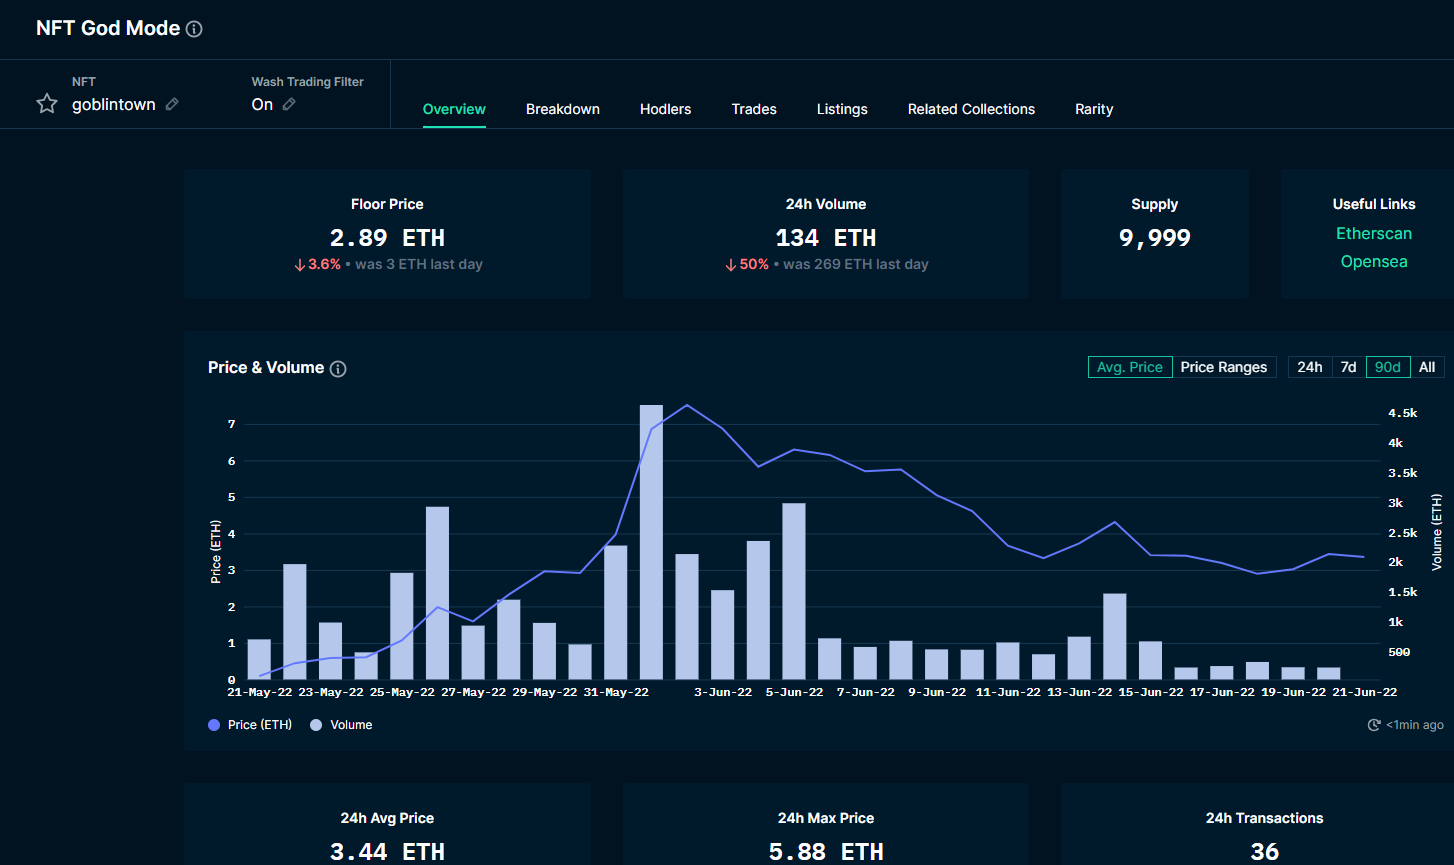
In addition to these built-in dashboard functions, Nansen also opens up some other custom and customized functions for users, which can further expand the tool attributes of the platform. Nansen's NFT God mode evaluates the rarity of its NFTs. Nansen provides rarity information, allowing users to view details such as characteristic type, rarity level, sales history, and last transaction price of individual NFTs in the collection (such as goblintown below), and can also obtain information on the number of NFTs with specific characteristics and relative to the entire collection. information about the appearance of the features.
2.2 Financing Data
Seed wheel
October 2020
Funding size: $1.2 million
A round
July 2021
Funding scale: $12 million
B round
December 2021
On May 18, 2022, Nansen, a blockchain data analysis platform, acquired Ape Board, a DeFi portfolio tracker.
secondary title
3. Representative project of data analysis platform - Dune Analytics
Dune Analytics is a blockchain research platform for querying and organizing Ethereum data through SQL, which can query, extract and visualize large amounts of data from the blockchain. As of now, the platform publishes blockchain data from Ethereum, Polygon, Optimism, Gnosis chain, Binance Smart Chain, and xDAI. Users can access blockchain data, create dashboards, share graphs, and fork existing queries for free. Only when they need to run multiple queries at once, skip the query queue, export results, keep information private, or remove watermarks do they have to upgrade to "Dune Pro," a premium plan that costs $390 per month.
In addition to Dune Pro, Dune provides API services for enterprises, and Dune can price according to usage and priority. Providing APIs will deepen the connection between businesses and customers, transforming them from external data providers to part of the core infrastructure.
3.1 Platform functions
3.1.1 Query function
Dune aggregates blockchain data into an easily queried SQL database. Queries are used to specify which data from the blockchain should be returned. Whatever the question, the answer likely starts with a Dune query.
3.1.2 Visualization
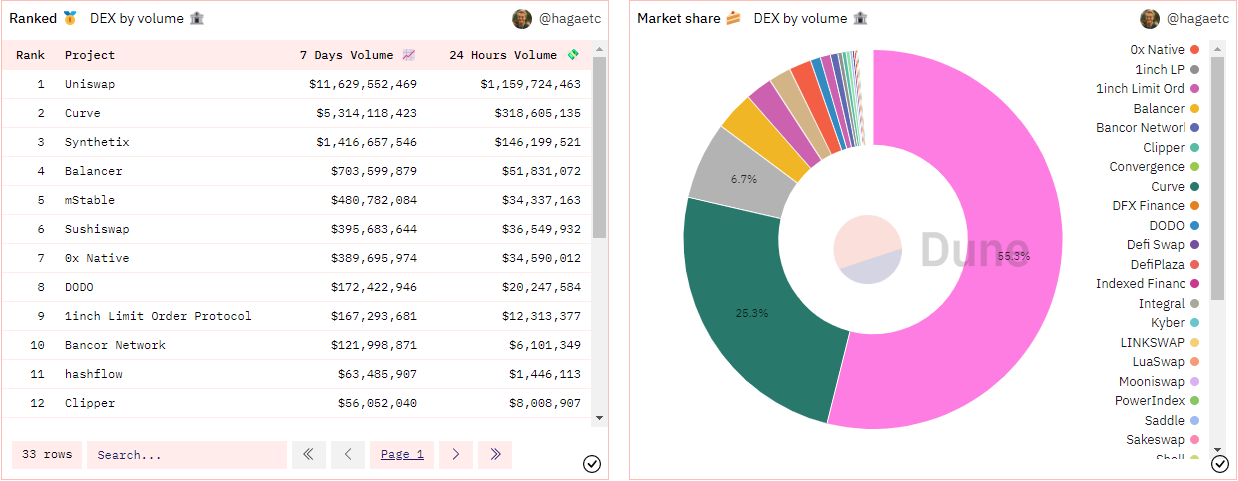
Data presented in tabular form (rows and columns) can be difficult to read, and Dune provides a variety of visualization options such as bar charts, area charts, line charts, pie charts, and more.
Use the dashboard to display the situation of a specific data group, for example, the audience can intuitively see which DEXs are the most popular.
text
3.2 Financing Data
Pre-seed round
March 2019
Funding Size: $250,000
Seed wheel
August 2020
Funding size: $2 million
A round
May 2021
Funding size: $8 million
B round
Funding scale: $69.42 million
4. LP Data Platform
secondary title
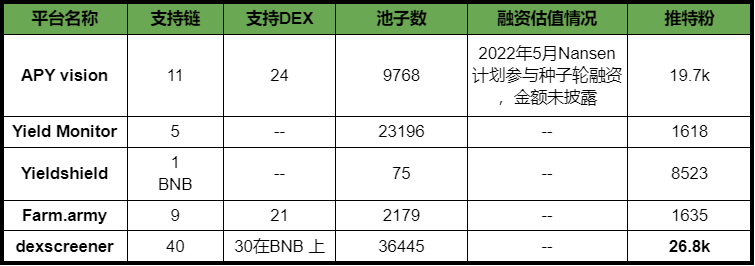
1. Function introduction
We can see that in all aspects, dexscreener is the top platform, so the following will introduce in detail the representative project of LP data category: dexscreener.
secondary title
2. LP data representative project - dexscreener
As a DEX market tool, you can view the real-time market and candlestick charts of most trading pairs on mainstream dex on this platform. You can also choose DEX and trading pairs based on mainnets such as Ethereum, BSC, Polygon, Avalanche, Fantom, Moonbeam, Metis, Arbitrum, Optimism, HECO, etc. Currently, 40 chains are supported. Users can directly create a watch list and add the trading pairs they follow.
2.1 Platform functions
Settings have follow, warning, multi-line chart, trend, new trading pair and up and down functions.
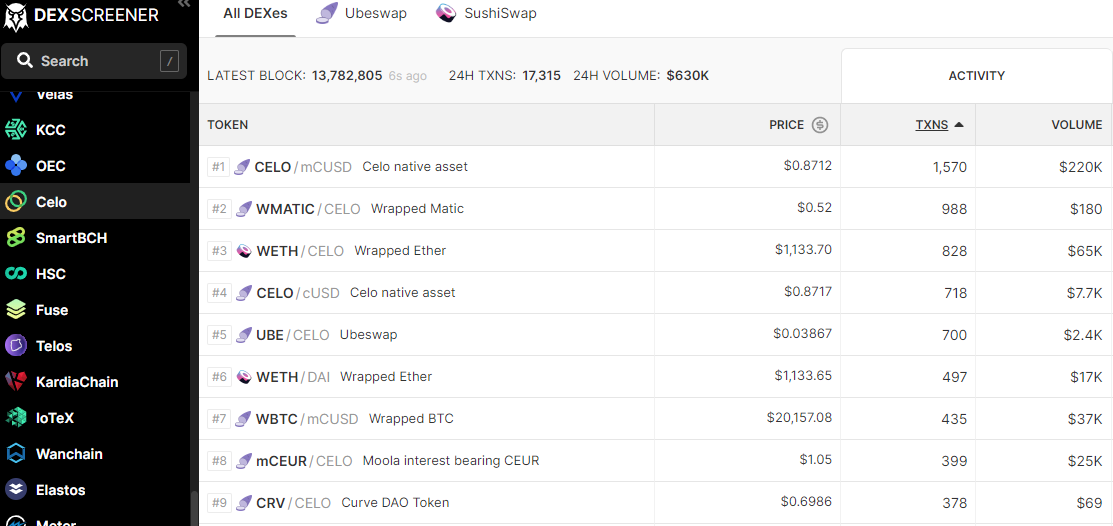
2.1.1 Switching between different chains
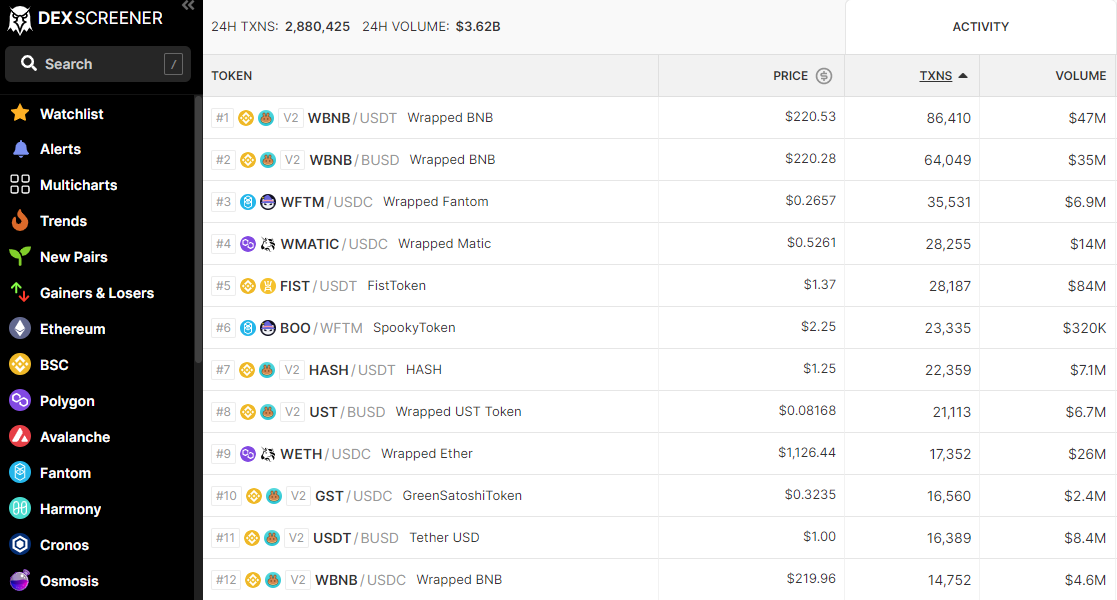
We can click to switch the public chain, and then we will see the dex exchanges on the public chain and the trading pairs listed on these exchanges.
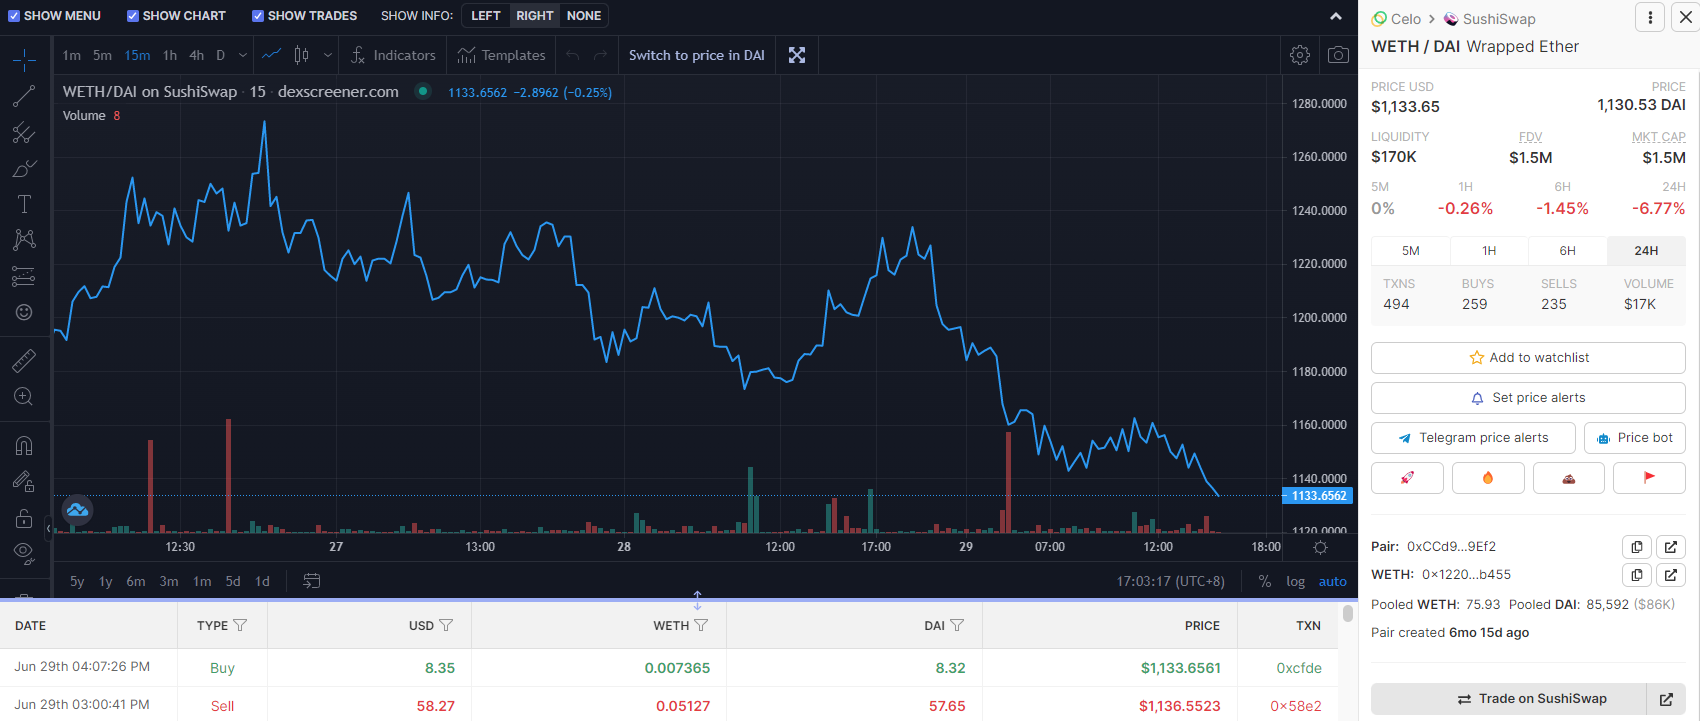
Click on the trading pair, we can see the price trend chart of the project, and then the key projects can be added to follow, set price alerts and telegram reminders.
2.1.2 Price Alerts
With the price warning, we can greatly reduce or even completely avoid our risk of liquidation. When setting an alert, we must first agree to browser notifications. There are multiple options for alerts, such as:
goes over price goes over
goes under
goes up more than percentage increase
goes down more than percentage drop
There is also a time dimension to choose from, so that users can set price alerts according to their own habits.
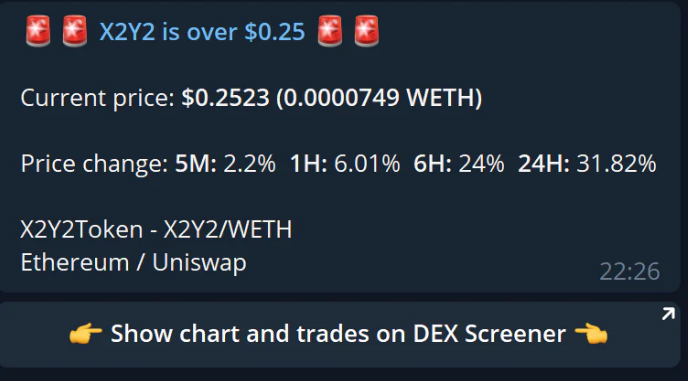
The website has also set up a telegram version of the price alert robot, as shown in the figure below, which shows the price alert of X2Y2 on a certain day.
2.1.3 Multi-curve graph
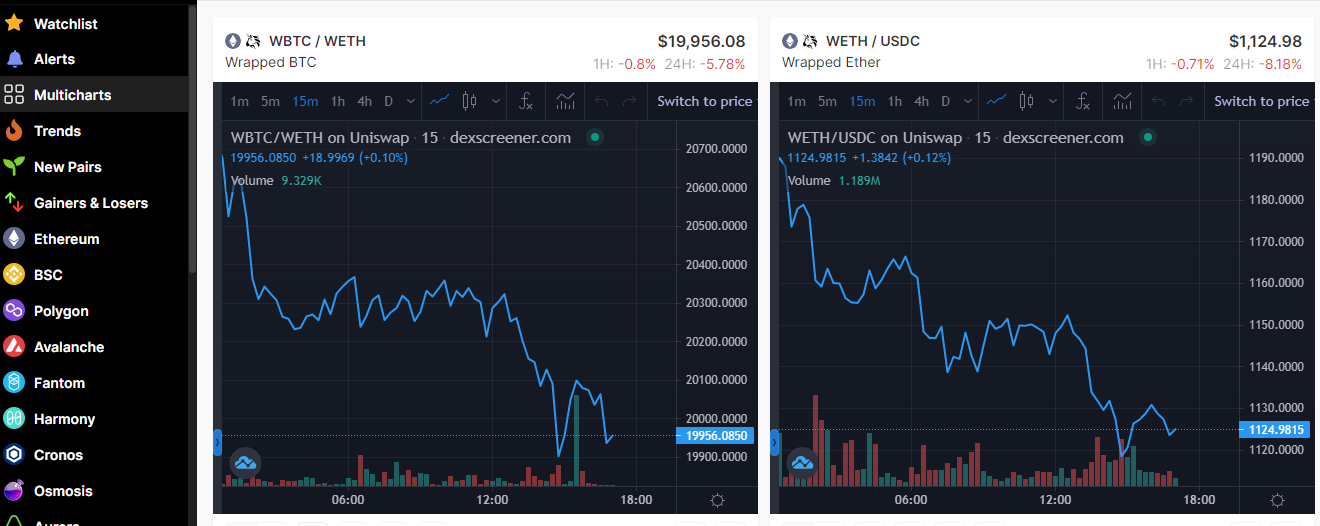
This function can help us compare the trends of multiple currency trading pairs on the website at the same time, as shown in the figure:
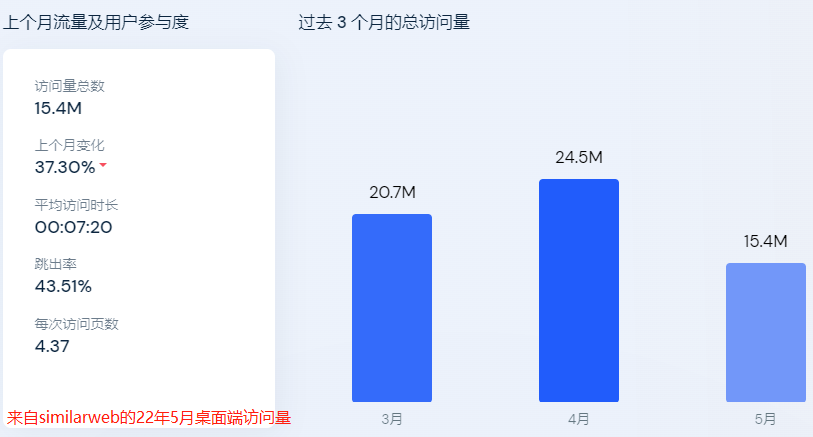
The figure below shows the number of user visits of the desktop client in May 2022. The total number of visits is 15 million, and the average visit time is 7 and a half minutes.
first level title
5. NFT data platform
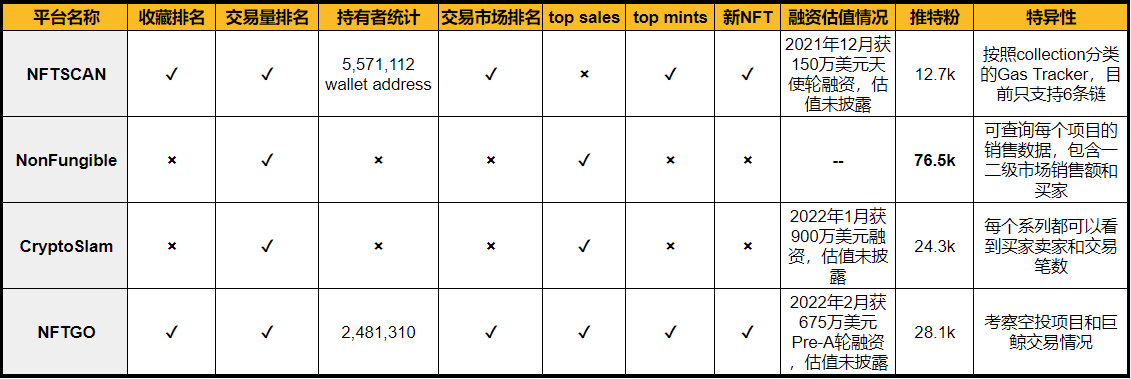
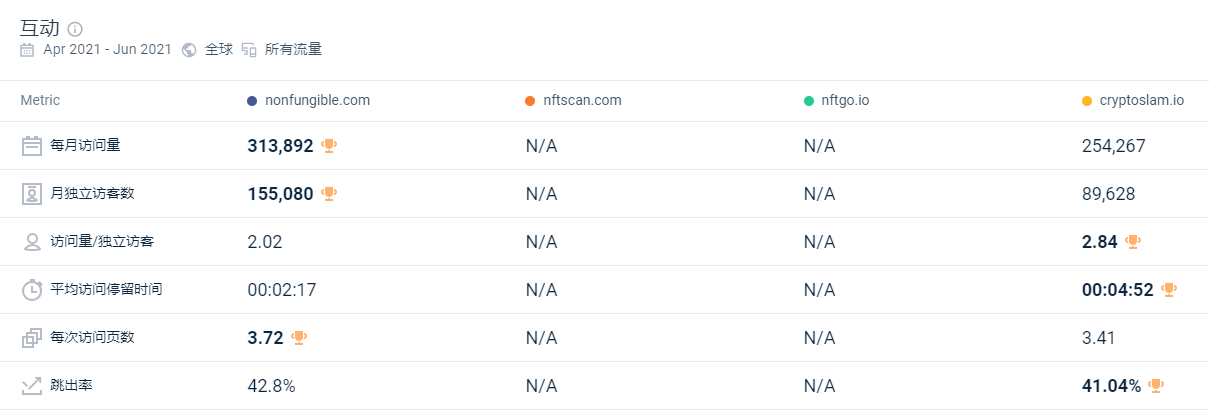
In the NFT market, we still need data-oriented investment decisions, especially for novice investors in the encryption industry, it is necessary to be familiar with various NFT data. Therefore, there are relatively mature NFT data platforms in the market that provide services, and they are all free now. The table below shows 4 well-known and easy-to-use platforms.
The data collected by these websites include major NFT platforms or ecosystems, including 24-hour, 7-day, 30-day and historical sales rankings, and single product sales price rankings on all platforms. There are also collectibles data of real-time transactions in the primary market of each platform. Users can view sales, number of buyers/sellers, real-time sales, real-time listings, whale activities, etc.
Among them, NFTSCAN currently only supports querying data on 6 chains, namely ETH, BNB, Polygon, Arbitrum, Optimism, and Moonbeam. Their platform also supports querying the gas fees of each series for 1 hour, 12 hours, and 234 hours.
first level title
6. Summary
6. Summary
We can see that although there are a large number of data platforms in each category, there are also representative projects with outstanding performance, but there are still emerging stars such as OKlink, Tokenview, and Footprint Analytics. Their latecomer advantage lies in user-friendliness Uniqueness, convenience and specificity are outstanding.
If we compare the NFT data platform with other types of platforms, we can clearly see that the functions of the NFT data platform are more detailed, comprehensive and beautiful, and each has its own uniqueness.The author's point of view:


