Retail trading rules: golden section line



What is the most painful thing about investing?
I don’t think it’s a loss of money. It’s normal to lose money. Maybe you lost money in the first two years after you entered the market, and then you will make money as you become more experienced. This is normal.
The most painful and abnormal thing is those who have worked hard to learn investment knowledge and skills for so many years but still can't make money.
Why is this? Are we stupid?
No, this is because you have learned a lot of invalid or even ineffective knowledge.
In the investment market, invalid or even ineffective knowledge will cause people to lose money, and more importantly, if no effective knowledge and skills can be learned to change this cognition, this money-losing situation will continue. continue.
This is the scariest thing, even scarier than Xiaobai. At most Xiaobai doesn’t understand, and this is equivalent to doing something against the market.
For example, what lofty and lofty theories, authoritative tactics of big coffee and so on. These things do work, but probably not for you. So it is negative for you, and it will make you lose money.
Therefore, what I analyze are some mechanical, simple and boring, seemingly silly ways of dying. But these things do work for the general public, and that's enough.
Therefore, today I will analyze a common tangent analysis tool for everyone: the golden section.
I believe everyone has heard it, but there may not be many people who apply what they have learned.
01 What is the golden section line
The golden section line is one of the most common and popular tangent analysis tools in the stock market. In actual operation, the golden section is mainly used to reveal the adjusted support level of the rising market or the rebound pressure level of the falling market. However, the golden section line does not take into account the impact of time changes on market prices, and the support and pressure levels revealed are relatively fixed, and investors do not know when they will reach the support and pressure levels. Therefore, if the index or stock price runs sideways at the top or bottom for too long, its reference role must be discounted to a certain extent. Compared with the Gann angle line and Gann arc, it is slightly inferior, but this does not affect the status of the golden section line as a practical tangent tool.
The golden section line is composed of several line segments, each line segment is the resistance or support position of a market, and each line segment is marked with corresponding sets of numbers: 1.191, 1.382, 1.50, 1.618, 1.809, 2.00, 2.618, 4.236 , 6.854, these are all based on the well-known Fibonacci sequence in mathematics, but these are not the main golden section.
You only need to know: "0.382, 0.5, 0.618, 1.382, 1.618", especially the number 0.618, because the strong support or pressure of the stock price is generally generated near these dividing points, and 0.618 It is the golden point in the golden section line. At the same time, this point is also the most used point in life. For example, the best point on the stage and the most perfect ratio of the human body are 0.618.
The basis for judging the golden section line first needs to find out a trend of the stock price, and draw the golden section line in the trend with the highest point area and the lowest point area as the upper and lower critical points. Then it is based on this to analyze the law of stock price operation in detail, which is also our focus today!
Drawing method: connect periodic high points with periodic low points.
Focus on: 38.2%, 50.0%, 61.8% three key positions.
Index director: Look for the support level in the callback in the upward trend, that is, the second buying point, and build or increase the position at this point.
Applicable individual stock types: sub-new stocks, rising stocks, and trend stocks.
02 Five-segment buying and selling rules of the golden section line
1) Patience is waiting for a breakthrough
Buying stocks within the 1.191 line is the safest. It is the consolidation period of the stock. There will always be a breakthrough day. There is no need to even make a price difference within this price. Hold it patiently as the first! The first golden line: it is the consolidation of the stock Expect. Once the stock price breaks through the 1.191 line, it will definitely touch the 1.382 line, and you must sell it! Otherwise, it will fall back and throw it away for the first time! And the callback will stop at the 1.191 line, you must buy it back!
2) Sell high and buy low
In 1.191-1.382, you can make a difference, sell high and buy low, don’t be afraid, this area is generally not caught, the profit of the banker is not very large, and on the way to pull up, the banker will sell high and buy low to reduce his holdings Cost, make more spreads on the stocks you are familiar with, and dare to make spreads. The 1.382 line is a strong resistance level, and the strong resistance level has a long period of consolidation, and once it breaks through effectively, it will be difficult for the stock price to fall below the 1.382 line, and it is best to throw it away at the 1.191 price (1.382 price-1.191 price)*0.618) .
3) Be careful when pulling out teeth
The price difference can also be made at 1.382-1.618, but it is just a tiger's mouth, and you should be more careful. It is best to throw it away at the price of 1.382 (1.618 price-1.382 price) * 0.618. Stocks that have fallen from a high position should not rush to rebound at 0.809, but at the price of 0.809. 0.618, but it must be thrown away if it rises by 10%, and don't love to fight.
4) It is not advisable to buy from a high place
A stock above 1.618 means that it has risen 62% from the low point. It is especially good news. Do not buy stocks near the 1.618 line. The longer the consolidation near this line, the greater the probability of the dealer's shipment. Be extra careful!
5) Unlimited scenery on dangerous peaks
The stocks above 1.809 may be infinitely beautiful and have the opportunity to increase the multiple, but the greater the opportunity, the greater the risk.
03 The essence of usage
When using the golden ratio, try to use it in combination with other technical indicators to increase the accuracy of the judgment of support and resistance levels. When using the golden ratio dividing line alone, its success rate may only be 30%, especially when investors don’t know which of the three barriers of 38.2%, 50.0%, and 61.8% can really support the stock price, so that we can buy. If you buy early, you may suffer multiple points of floating losses; if you buy late, the stock price may have been supported and have risen sharply.
Therefore, in the actual combat process, if there are other technical indicators to cooperate and form a resonance, it will be even more powerful, and the success rate will be increased to more than 75%.
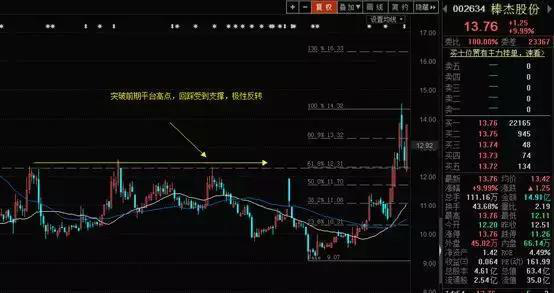
For example, 002634, its 61.8% key support level, is also the support formed by the previous high point platform. Therefore, the key level of 61.8% resonates with the support formed by breaking through the previous high point, which enhances the reliability of this buying point.
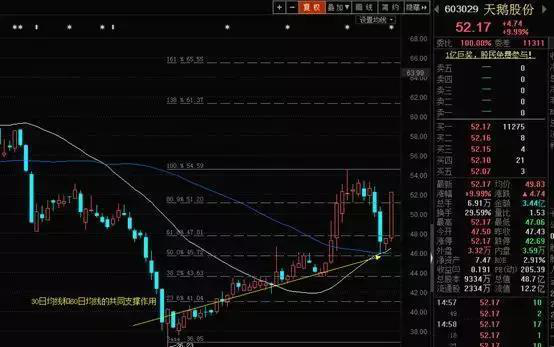
Or Swan shares, at 50%, are supported by the 30-day line and the 60-day line at the same time. That is, the 50.0% mark + 30-day moving average + 60-day moving average forms a resonance, so the stock price can soar!
The golden ratio and other indicators cooperate with the success rate statistics:
The golden ratio alone has a success rate of 30%.
The success rate of golden ratio + trend line/average line is 65%.
The success rate of golden cross of golden ratio + trend line/moving average + MACD/RSI/KDJ indicator is 100%.
An illustration of the actual application of the golden section line in the stock market.
Usually, the rise of the market is a spiral rise. It will not be in place in one step. It is basically two steps forward and one step back. Before a new upward trend is formed, there is often a wave of retracement. ready. The retracement levels that the market generally prefers are 0.32, 0.5, and 0.68, which are exactly in line with the number of the golden section. Therefore, the golden section line is mainly used to judge the support pressure and the space for price fluctuations when the stock price rises and falls.

Taking the trend of the market as an example, it can be clearly seen from the figure that since the lowest point, the market has fluctuated upwards, and every time it rises to the golden section line of 0.618, 0.5, and 0.382, it will encounter pressure and cause a callback. A breakthrough has a greater chance to become an important support position for a later callback.
Here is also a simple analysis using the golden section. After the stock index breaks through the pressure of 0.382, the pressure is around 0.236 (3230 points), which needs to be paid attention to. After rushing to this vicinity, it is easy to be pressured and there will be a callback. Later, it will step back to 0.382 (3188 points) Seek support nearby, and the chance of breaking through will be great after gaining momentum. A complete analysis operation needs to be combined with other factors, so any similarity in the above analysis is purely coincidental.
04 Other precautions for use:
1. The stocks that can be used for the golden section must be the stocks that have risen sharply in the first wave, and the increase has been at least more than 50%, otherwise there is no operational value. It must be a stock that has attracted enough attention from the market, or It is a core stock for a period of time.
2. The rising trend of stocks is spiral, and it is often two steps forward and one step back. In a bear market, there are very few stocks that can grow to the sky with one step in place. Therefore, it is normal for bullish stocks to pull back all the time. Don’t be too scared and use your judgment buy and sell.
3. In terms of specific technology, at the end of each callback, there is a high probability that there will be a negative line washing the market, and the decline will become weaker after the negative line. At this time, the three positions of the golden section, 0.38, 0.5, and 0.62, are used to buy and sell.
4. Often the golden section and some technical signs of stop falling, such as the bottom of the golden needle, can be combined for analysis, and unexpected results will often be received.
5. Finally, I want to emphasize the first point. Only star stocks in the market for a period of time can be operated in this way. Junk stocks will only fall all the way and will not look back.