
比特币四年周期:规律不变,玩法已变
- 核心观点:比特币的4年周期并未消亡,2025年顶部如期而至,但传统链上指标因机构主导市场而集体失效,散户资金在涌入比特币前已被Memecoin和高FDV代币耗尽。
- 关键要素:
- 比特币于2025年10月6日触及126,296美元顶部后下跌约50%,符合减半后480-550天见顶的历史规律,但传统顶部指标(如MVRV、Pi周期、NUPL)均未触发。
- 机构买家(ETF、Strategy公司)取代散户成为主导,ETF净流入峰值达631亿美元,但交易通过托管机构进行,导致链上活动减少,指标无法反映真实需求。
- 散户资金在到达比特币前已被摧毁:超1000万种Memecoin和高FDV(完全稀释估值)代币发行结构吸走了零售流动性,84.7%的2025年新代币交易价低于发行估值。
- 底部预测基于历史周期节奏和结构指标:200周移动平均线(约68,832美元)是历史支撑位,结合死叉及跌幅递减趋势,基准底部区间为45,000-55,000美元,时间指向2026年第三至第四季度。
Original author: Bull Theory
Original translation: Yuliya, PANews
Is Bitcoin's 4-year cycle still valid? This is the most predictable crash in cryptocurrency history, yet no one was prepared for it.
At the peak of the 2025 bull market, one of the most common narratives in the crypto space was: the 4-year cycle is dead, institutional involvement has changed everything, and the old rules no longer apply. However, Bitcoin topped out almost exactly as expected, subsequently dropped 50%, and is now precisely where the cyclical framework predicted it would be. So let's have an honest discussion about what actually happened.
The Four-Year Cycle Isn't Dead, The Buyers Just Changed
Throughout 2024 and early 2025, the crypto market was saturated with the narrative that Bitcoin ETFs had changed everything, institutions were buying, and the traditional 4-year cycle driven by halving events and retail FOMO was no longer applicable. This was a supercycle, and the bear market wouldn't return.
This reasoning sounded convincing. Bitcoin hit a new all-time high before the halving even occurred, which was unprecedented. ETF inflows broke records. Michael Saylor was buying billions of dollars worth of Bitcoin every week. Mainstream financial media reported on Bitcoin as a legitimate asset class for the first time. The overall market sentiment suggested the old rules were indeed obsolete.
However, Bitcoin peaked at $126,296 on October 6, 2025, and then began to decline. Currently, it's down approximately 50% from its high, the Fear and Greed Index is in extreme fear territory, and a death cross has appeared on the charts. The cycle deemed dead is playing out as precisely as it did in 2013, 2017, and 2021.
The 4-year cycle isn't dead; it's just become more subtle. The reason it became subtle – why no one saw the top coming, why none of the top indicators gave a warning – is the most crucial point for understanding where we are and where we're headed next.
But before diving into that, it's necessary to understand what the cycle actually is and why it has persisted for over a decade. Because those who dismissed the cycle weren't entirely wrong. The market has indeed changed, but the cycle wasn't broken; it simply evolved alongside the market.
Every four years, a halving event cuts the newly issued Bitcoin supply by 50%. Miners, the largest and most consistent sellers of Bitcoin, mine and sell it to cover operational costs. When the halving halves their production, the daily volume of Bitcoin sold onto the market drops significantly. If demand remains constant or increases, the price must eventually rise. This is the fundamental mechanism driving Bitcoin's price, not a theory, but supply and demand.
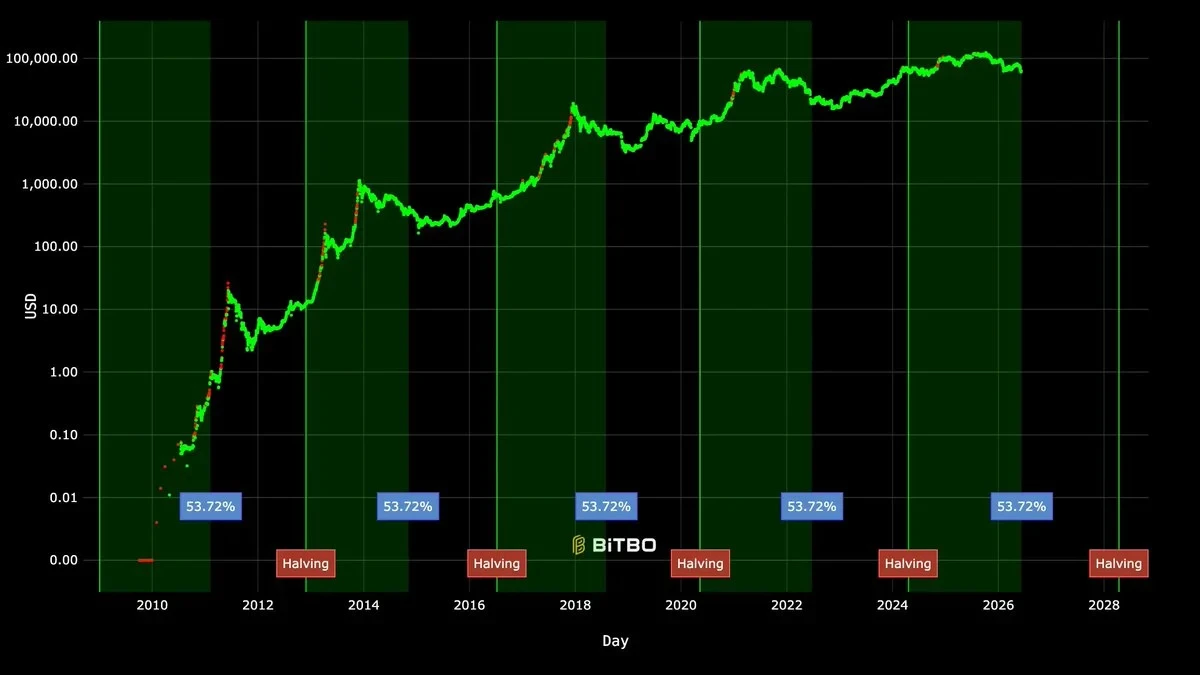
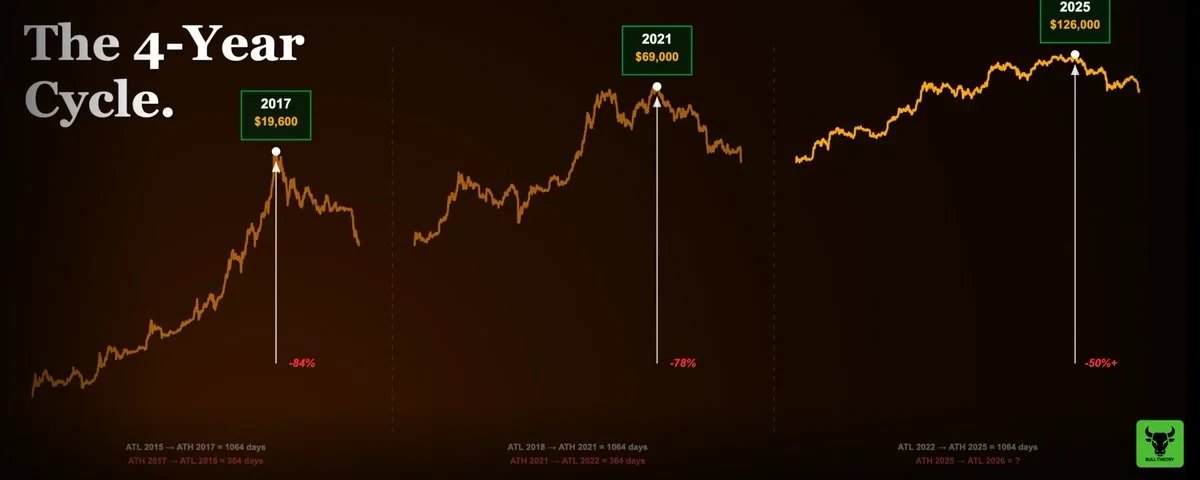
Looking back at halvings since 2012, the bull-bear transitions in Bitcoin's price have repeated without exception.
Four cycles, four halvings. The basic structure of each has been remarkably similar. And this is what those proclaiming the death of the cycle missed: the cycle doesn't care about narratives. It operates on supply and demand mechanics, which didn't change just because institutions started buying through ETFs. The April 2024 halving occurred right on schedule. Bitcoin topped on October 6, 2025, 535 days later. This falls perfectly within the historical window of 480 to 550 days post-halving for previous cycle peaks.
The cycle never died. It just looked different on the surface because the buyers were different. And this difference – institutional demand replacing retail demand – is precisely why no top indicators were triggered, and why most people watching those signals completely missed the top.
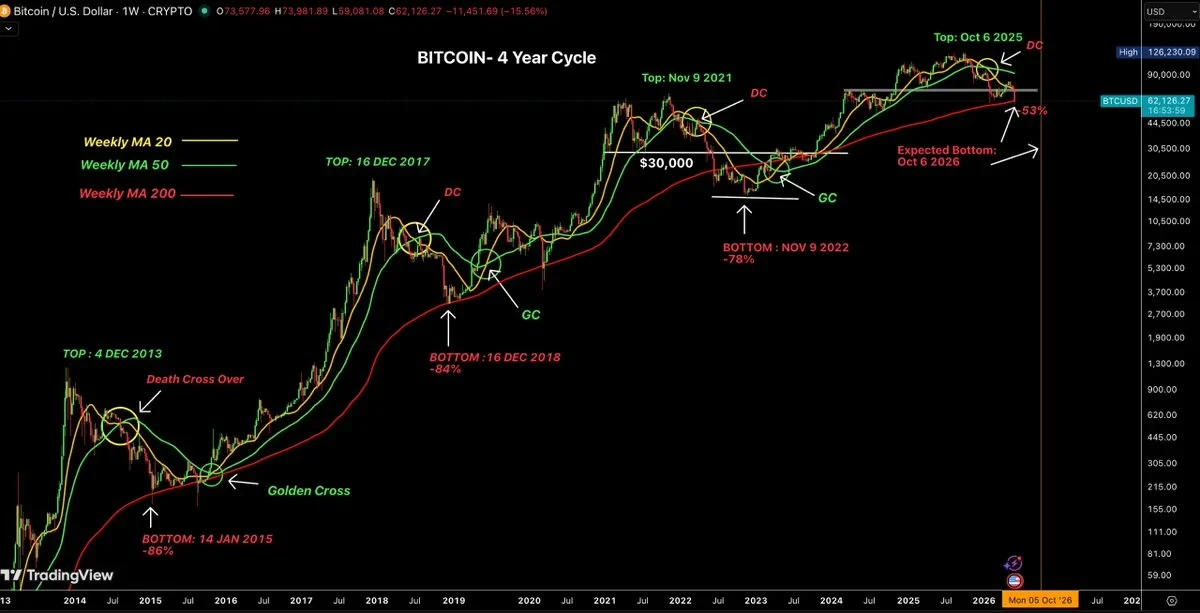
Tracing these four Bitcoin cycles, recording tops, bottoms, death crosses, golden crosses, and the 200-week moving average.
Across these cycles, there's a consistent pattern that hasn't received enough attention: the bottom always occurs roughly a year after the top. While not exactly one year, the range is remarkably tight. After the 2013 top, the bottom came 410 days later. After 2017, it was 363 days. After 2021, it was 376 days. If this rhythm holds for the current cycle, the bottom would fall between late September and mid-November 2026.

There's also a clear trend in the drawdown data: 86%, 84%, 78%, and now potentially 50% to 65%. Each bear market is shallower than the last. This is not accidental. It reflects a maturing asset: one that now has institutional buyers who don't panic-sell, a regulated ETF market creating structural demand, and corporations holding Bitcoin on their balance sheets as a treasury reserve. As the buyer base matures, volatility is being compressed.
This cycle also witnessed something unprecedented: Bitcoin hit a new all-time high before the halving. In March 2024, a full month before the April 20 halving, Bitcoin reached $73,581, breaking the previous all-time high of $69,000 set in 2021. This was a new high, but not the cycle top. Every previous cycle ultimately peaked several months after the halving, and this cycle was no exception—the true cycle top came on October 6, 2025, at $126,296, well after the April 2024 halving. The difference is that hitting an all-time high pre-halving had never happened before. The reason was the approval of spot Bitcoin ETFs in January 2024, which pulled institutional demand into the market before the halving, front-loading the cycle in terms of time and confusing those tracking typical post-halving timelines.
What Happened to Retail Investors This Cycle?
To understand why Bitcoin topped without any of the common signals, you need to see what happened to retail capital in the 18 months leading up to the peak. In short: most retail capital was exhausted long before Bitcoin reached $126,000.
In previous Bitcoin bull runs, retail played a specific role. They provided the final fuel, creating the final frenzy and parabolic blow-off top. It was retail FOMO that pushed Bitcoin from a reasonable price to an extreme one in the final stages of each cycle. This is also why top indicators were triggered – those tools were originally designed specifically to measure retail behavior, not institutional behavior. Without retail frenzy, there are no indicator triggers.
In this cycle, retail never showed up in Bitcoin in scale. It's not that they didn't participate in crypto; they did. But they got 'rinsed' elsewhere first.
The Memecoin Liquidity Trap
The single biggest factor destroying retail liquidity this cycle was the extreme ease of creating and launching Memecoins. Token launchpads (especially on Solana) allowed anyone to issue a token in minutes for near-zero cost. By mid-2025, the total number of tokens had exploded from roughly 10,000 to 20,000 at the peak of 2021 to over 10 million.
Think about what this means for a retail investor trying to navigate this market. In 2021, there were perhaps 200 tokens worth serious consideration – real projects with users, revenue, or at least a credible team and product roadmap. The path from 'I want to invest in crypto' to 'I bought ETH and SOL' was short and clear. That's where retail capital concentrated, and why ETH ran to $4,800 and SOL to $260.

But in 2025, you had to choose from 10 million options. The vast majority of these tokens were designed with one purpose: to extract money from retail buyers as quickly as possible and transfer it to insiders. The operation is simple: create a token, manufacture hype, sell into retail buying, and cash out. This happens thousands of times daily across the ecosystem.
A retail investor in 2021 faced a manageable number of options, mostly legitimate projects. A retail investor in 2025 faced millions of options, the vast majority structurally engineered to extract their capital. The result was predictable: retail capital entered crypto in 2025, but most of it never flowed to Bitcoin or quality altcoins. Instead, it was first drained by the Memecoin complex.
The involvement of high-profile public figures further amplified the problem. Numerous well-known personalities from politics, entertainment, and social media launched their own Memecoins this cycle. The pattern was identical each time: a token bearing a celebrity name launches amid huge hype, retail buys in hoping to ride the fame effect, the price spikes, insiders and early holders sell into the peak. The token crashes 80% to 95% within days or weeks. Retail is left holding worthless tokens worth a fraction of what they paid.
This story repeated itself over and over throughout 2024 and 2025. Each time, a large chunk of retail liquidity was permanently erased from the ecosystem. Those who lost money in these projects didn't take their remaining funds and buy Bitcoin. They either left the market entirely or had no capital left to deploy.
VC Tokens: High FDV, Low Float
The second major factor destroying retail capital was the launch structure of new tokens this cycle. It's less discussed, but its destructive power is equally immense.
In 2021, new crypto projects typically launched with a Fully Diluted Valuation (FDV) between $100 million and $1 billion. This left genuine upside for public market buyers. A project launching at a $200 million FDV and growing to a $2 billion one could deliver a 10x return for retail investors. This is what people remember about 2021 – the stories of 'I bought this token early and turned $5,000 into $50,000'.
In this cycle, the structure changed completely. Venture capital funds raised tens of billions of dollars in 2021 and 2022 to invest in crypto infrastructure. By 2024 and 2025, their portfolio companies were ready to issue tokens, and VCs needed to show returns to their Limited Partners (LPs). Consequently, projects began launching with fully diluted valuations of $5 billion, $10 billion, or even $20 billion, while only having 5% to 15% of the circulating supply actually available on day one.
What this means in practice: a retail investor sees a token trading at a seemingly $500 million market cap and thinks there's room to grow. But the real FDV at that price is $10 billion, and 85% of the tokens are sitting in VC wallets, waiting to unlock over the next two to four years. Every month, more tokens unlock and are sold. The price has a structural ceiling because the supply pressure never stops. The retail buyer is essentially buying into a continuous selling event they don't know about.
Independent research tracking 118 tokens launched in 2025 found that 84.7% traded below their launch valuation, with a median price decline of 71%. These were not obscure projects; many were listed on major exchanges, had large marketing budgets, and received media exposure. Yet they lost most of their value because their tokenomics were designed from the outset to benefit insiders at the expense of public buyers.
The combined consequence of Memecoins and high-FDV VC token launches was this: retail crypto capital was massively destroyed before Bitcoin even approached its cycle top. By October 2025, most retail participants who entered the market in 2024 were either severely down or had left entirely. There was no liquidity left to rotate into Bitcoin. There was no FOMO wave. The fuel for the final manic top was simply gone.
Where Was Retail Capital Supposed to Go?
The 2021 cycle worked because there was a clear path for retail capital: Buy Bitcoin → Bitcoin pumps → Rotate to large-cap altcoins → Large-cap altcoins pump → Rotate to mid-cap altcoins → Mid-cap altcoins pump → Rotate to small-cap tokens. Capital cascaded down a predictable market cap ladder, generating returns at each layer.
But in 2025, this waterfall effect never started. The initial mass buying of Bitcoin by retail never happened, because their capital was already exhausted. Bitcoin's dominance stayed above 60% for nearly the entire bull market. The Altcoin Season Index briefly peaked at 78% for about three weeks in September 2025, then immediately collapsed. There was only a short window where altcoins outperformed Bitcoin before its dominance quickly returned above 60%.
The anticipated altcoin season didn't arrive not because the market was wrong, but because the mechanism that creates altcoin seasons – retail capital cascading down the market cap ladder – had broken down. The capital had already been drained.
How Did Institutions Change the Entire Cycle Structure?
Right while retail was losing money on Memecoins and VC token launches, something entirely new was happening to Bitcoin. For the first time in the asset's history, regulated institutional products were channeling tens of billions of dollars into Bitcoin on a structured, continuous schedule.
The approval of spot Bitcoin ETFs in January 2024 was more than just a headline. It fundamentally changed Bitcoin's marginal buyer, and this change set off a chain reaction that made everything about this cycle different from the past.
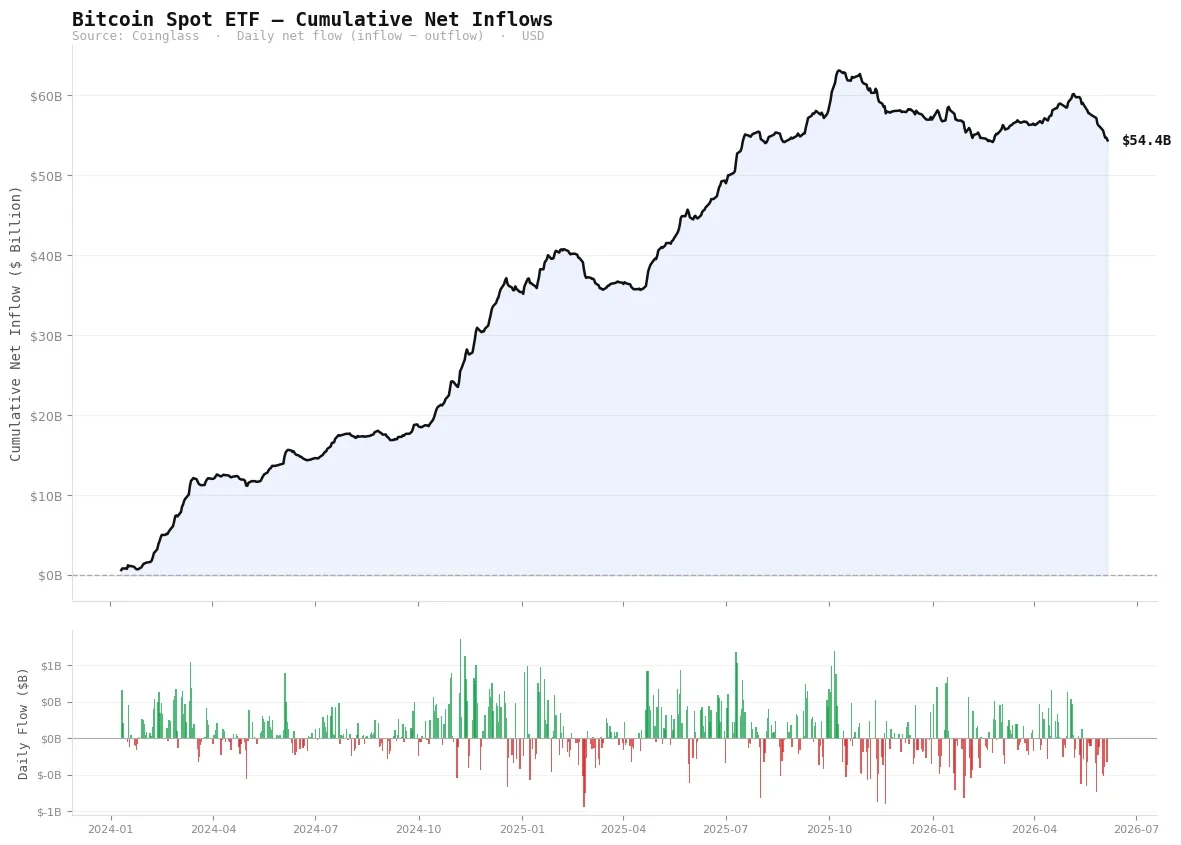
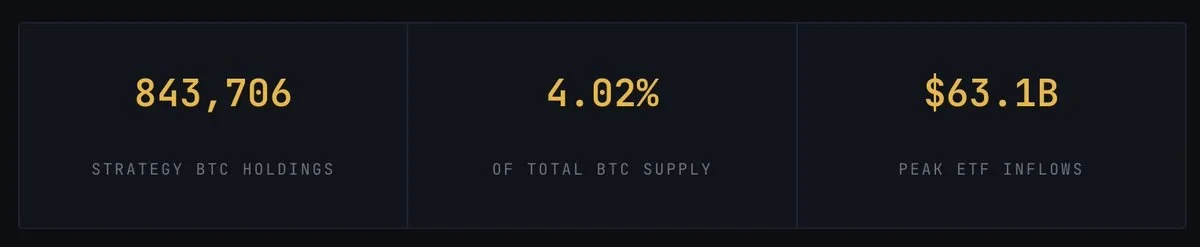
Bitcoin spot ETF cumulative net inflows peaked at $63.1 billion in October 2025 and currently stand at $54.4 billion (Source: Coinglass).
From January 2024 to October 2025, spot Bitcoin ETFs accumulated net inflows of $63 billion. At their peak, average daily inflows exceeded $350 million, which was 8 to 9 times the value of the new Bitcoin mined by miners each day. On the largest single inflow day, over $1 billion flooded in.
These are not retail investors. They are pension funds, registered investment advisors, family offices, endowments, and hedge funds making asset allocation decisions on quarterly cadences. They are not checking Bitcoin's price at midnight. They don't FOMO on a green candle on X (Twitter). They receive an asset allocation mandate and execute it systematically over weeks or months.
When this type of buyer becomes the dominant market force, price action looks completely different from a retail-driven market. You no longer see prolonged sideways chop followed by explosive vertical pumps. Instead, you get a slow, persistent grind higher. No parabolic weekly candles; just a steady uptrend that doesn't look exciting but compounds into massive gains over time.
Bitcoin went from $40,000 in January 2024 to $126,000 in October 2025, a 215% gain. In any previous cycle, this magnitude of gain would have included several weeks with 30% or 40% single-week moves. But in this cycle, the weekly moves were modest by historical standards. The overall gain was huge, but it arrived in a way that felt procedural and almost boring, not explosive.
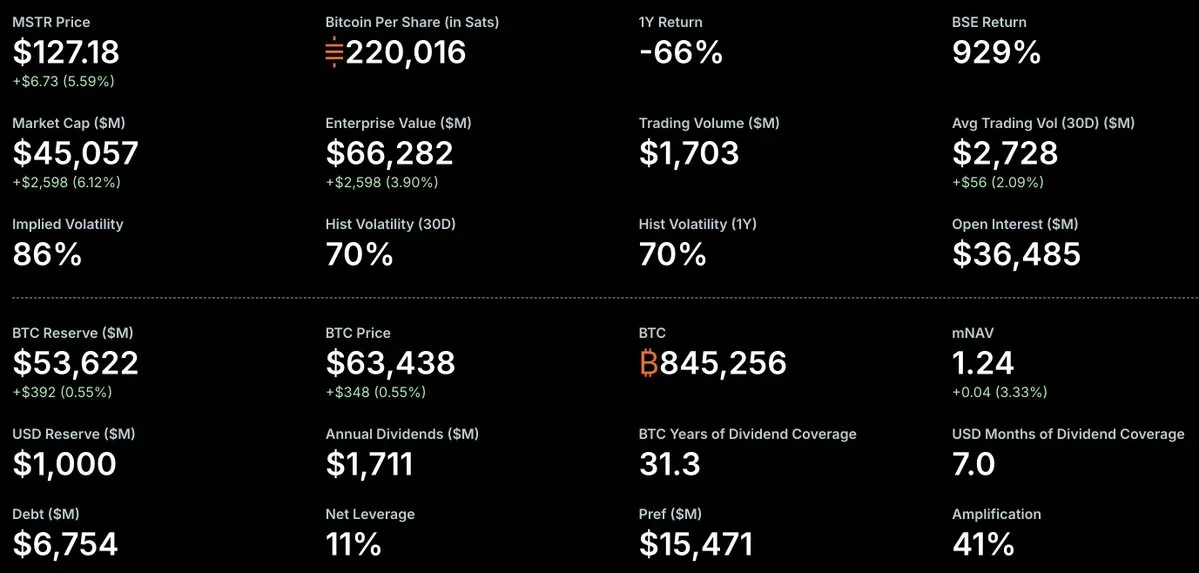
Strategy holds 845,256 BTC, representing 4.02% of Bitcoin's total supply, accumulated through continuous corporate treasury purchases.
Then there's Strategy. Their model is the most extreme version of the institutional bid that defined this cycle. They turned their entire corporate treasury management strategy into a Bitcoin accumulation machine, raising capital through equity and preferred stock offerings and deploying it directly into Bitcoin purchases. As of June 2026, they hold 843,706 Bitcoin, or 4.02% of the future total supply.
In 2025 alone, they raised $25.3 billion from capital markets to buy Bitcoin. They don't sell. They don't hedge. They accumulate week in and week out, regardless of price. This is structural buying that simply didn't exist in previous cycles.
The key thing to understand about this institutional structure is how it impacts on-chain data. When BlackRock buys Bitcoin for its IBIT, those coins are transferred to Coinbase Prime for custody. They become virtually invisible to on-chain analysis, not trackable like retail activity. ETF purchases don't show up on-chain as coins changing hands the way retail trades do. Strategy's Bitcoin accumulation through equity issuance appears in SEC filings, not on the blockchain. Each dollar of demand generated less on-chain activity than in any previous cycle.
This is the core technical reason why every top indicator failed. Those indicators measure activity on the blockchain, coin movement, and realized profit behavior – metrics whose effectiveness depends on retail being the dominant buyer. When the dominant buyer operates through off-chain custodians and registered financial products, hundreds of billions of dollars can flow into the asset while these metrics remain eerily calm. The mathematics of the indicators wasn't wrong; they were measuring the wrong subjects.
Why Did the Eight Major Top Indicators All Fail?
These indicators had near-perfect track records. In 2013, 2017, and 2021, they signaled tops within days or weeks of the actual peak. Analysts obsessively watched them throughout 2025, waiting for a signal. Bitcoin broke through $126,000 and then started declining. Yet all these indicators remained calmly in neutral or accumulation zones.
This wasn't because the


