
HTX Research|加密市場宏觀研報:多重因素共振下的極限壓力測試
- 核心觀點:2026年6月初加密市場處於恐慌性調整階段,受宏觀流動性緊縮、ETF創紀錄外流、地緣風險等五重利空共振影響,但網路算力、穩定幣市值及美國監管法案等基本面表現強勁,構成短期恐慌與長期改善並存的複雜局面。
- 關鍵要素:
- 聯準會新主席Warsh鷹派政策疊加伊朗地緣風險,導致6月FOMC降息機率從55%驟降至23%,加密市場面臨利率高企、縮表加速、通膨頑固和地緣風險的四重利空。
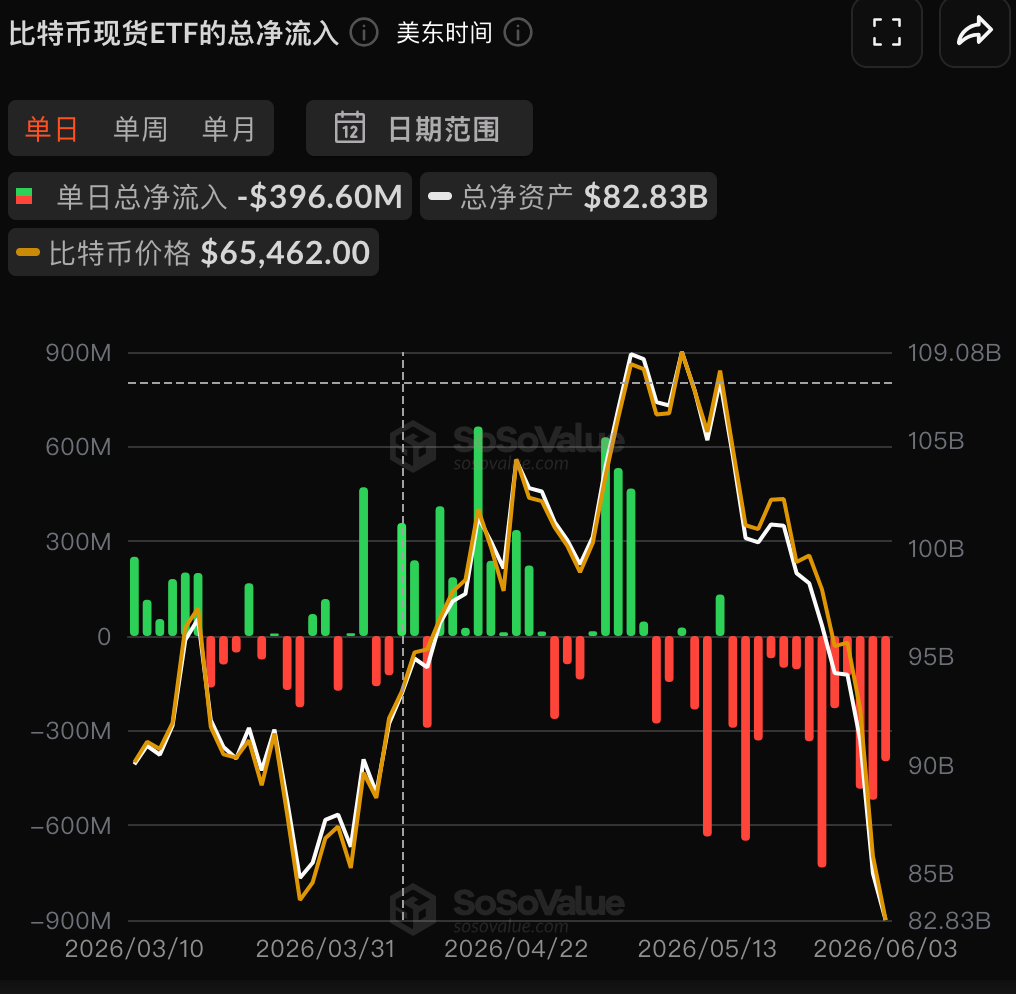
- 現貨ETF連續11日淨流出累計約35億美元,但機構份額數量未同步下降,傾向於戰術性調倉而非戰略性撤退,部分資金輪動至AI及半導體主題。
- 全網算力創歷史新高,穩定幣總市值達3,254億美元(年增37.9%),與BTC價格自高點回落34%形成明顯背離,反映定價權從鏈上轉向宏觀交易者。
- Strategy出售32枚BTC(占總持倉0.004%)引發敘事衝擊,但屬於常規財務操作,市場恐慌情緒(恐懼貪婪指數11)放大了事件影響。
- CLARITY法案已在眾議院以壓倒性優勢通過並進入參議院表決程序,被視為美國加密監管的里程碑,但當前市場恐慌未對該法案進行充分計價。
1. Geopolitics and Macro Liquidity: The First Major Market Test of the Warsh Era
On May 22, Kevin Warsh officially assumed office as the 11th Chairman of the Federal Reserve with a 54:45 vote, succeeding Powell, whose term had expired. This former Fed Governor from the 2008 financial crisis era immediately sent a clear hawkish signal upon taking office, publicly criticizing the 2020-2022 monetary policy as "one of the most serious policy misjudgments since the Volcker era" and explicitly prioritizing the acceleration of balance sheet reduction. CME FedWatch shows that the probability of a rate cut at the June 17 FOMC meeting has plummeted from 55% in April to 23%, while the probability of no rate cut for the entire year has surged to 65%. The federal funds rate is anchored in the 3.50%-3.75% range, and the 10-year U.S. Treasury yield has been consistently trading in the 4.35%-4.55% range throughout May, putting continuous pressure on risk asset valuations.
More critically, U.S. inflation stickiness has far exceeded expectations. The Headline CPI has rebounded to 3.8% year-over-year, and core inflation remains well above the 2% policy target. Warsh clearly stated during his confirmation hearing that his policy focus will be on inflation resilience rather than marginal labor market softening. Even if this Friday's May non-farm payroll data is unexpectedly weak, the Fed is unlikely to pivot towards easing. Against this backdrop, the external liquidity environment for the crypto market is escalating from a "mild headwind" to a "significant headwind." Coupled with the threat from Iran to close the Strait of Hormuz, which pushed crude oil prices up nearly 6% in a single day—WTI crude hitting $92.54 and Brent crude rising to $94.98—rising energy costs further compress the space for rate cuts. In this first major market test of the Warsh era, crypto assets face a quadruple whammy: high interest rates, accelerated balance sheet reduction, stubborn inflation, and a rising geopolitical risk premium.
However, from a longer-term cycle perspective, the current macro predicament is not unsolvable. The June 16-17 FOMC meeting will release the latest dot plot, which includes the interest rate path through 2028. If the median expectation is downgraded from "one rate cut" to "no rate cuts for the year," the market might experience a sharp short-term reaction. However, after the concentrated release of this expectation gap, macro uncertainty could temporarily fade. For the crypto market, a transition from "high uncertainty" to "certain tightening" puts pressure in the short term but could actually help capital reallocate under a clearer interest rate framework in the medium to long term. Historically, the last rate hike at the end of the 2018 tightening cycle actually triggered a phase-based rebound in risk assets—a lesson worth noting.
2. The Signal Significance of ETF Flows: Is the $3.5 Billion Outflow a Retreat or a Rebalance?
The most direct capital pressure in this downturn comes from spot ETFs. As of June 2, U.S. spot BTC ETFs have experienced net outflows for 11 consecutive trading days, totaling approximately $3.5 billion, setting a new record for the longest continuous outflow streak since their launch in January 2024. Over three weeks, cumulative net outflows from BTC ETFs exceeded $4.21 billion, with AUM dropping from $104 billion to $94 billion. ETH ETFs saw net outflows of no less than $241 million during the same period, accumulating over $712 million over three weeks. More notably, the year-to-date net inflow for 2026 has turned negative for the first time—the ETF, the most powerful buying engine since 2024, has officially stalled and reversed.
However, a deeper analysis of the structural characteristics of ETF outflows reveals a more nuanced reality than the surface numbers suggest. CoinShares and Galaxy attribute this round of outflows to three factors: geopolitical tensions (U.S.-Iran conflict), capital rotation from crypto to AI and semiconductors (NVDA's Computex launch of RTX Spark led to a single-day gain of over 6%, and Marvell surged over 12% pre-market after Jensen Huang's endorsement), and diminished momentum from Strategy's new purchases. Notably, the number of ETF shares outstanding has not declined in tandem—suggesting institutions are not "liquidating positions" but rather "tactically reducing." Although BlackRock's IBIT once saw a single-day outflow of $528 million, its AUM remains the highest. Furthermore, BlackRock's CEO recently publicly stated that "Bitcoin could reach $700,000 per coin," indicating that institutions' long-term strategic judgment remains unshaken.
Historical patterns show that short-term sharp fluctuations in ETF flows are not unique to crypto. In April 2024, BTC ETFs also experienced consecutive outflows of about $1.2 billion, but Bitcoin rebounded from its low to hit new highs within 3 months. While the current $3.5 billion outflow figure is eye-catching, it represents only about 3.7% of BTC ETFs' total AUM of over $94 billion. Standard Chartered's latest research report maintains a long-term optimistic outlook for digital assets, predicting Ethereum could reach $40,000 by 2030. Overall, the current ETF outflows are more likely a "tactical rebalancing" than a "strategic retreat"—after capital rotates to AI themes, once AI valuations fully price in expectations and crypto has undergone sufficient adjustment, the impetus for capital to return still exists.
3. Internal Market Structural Contradictions: Fundamentals Rising, Prices Falling
If one only looks at on-chain data, the fundamentals of the crypto market have never been stronger. Bitcoin's total network hash rate hit an all-time high in 2026, with new-generation ASIC miners offering higher energy efficiency and institutional mining continuing to expand. Meanwhile, the total stablecoin market cap has reached $325.4 billion (USDT $187.9 billion, USDC $75.9 billion), growing 37.9% since April 2025. Hash rate represents long-term confidence in the underlying infrastructure, while stablecoin market cap signifies on-chain liquidity abundance. Both are at historical peaks, creating a stark divergence from Bitcoin's 34% decline from its highs.
The reasons for this "decoupling of fundamentals and price" are multifaceted. First, Bitcoin's short-term pricing power has shifted from on-chain investors to macro traders. The 90-day rolling correlation between BTC and the Nasdaq remains in the 0.6-0.7 range, with its "high-beta tech stock" attribute far outweighing the "digital gold" narrative. This means that when macro capital contracts risk exposure due to rising interest rates, BTC is among the first assets to be reduced. Second, futures leverage amplified the selling pressure—BTC's drop below $70,000 triggered a wave of long position liquidations, with $1.624 billion liquidated across the entire network in 24 hours, a new high since February. Open Interest remains elevated at over $52 billion, suggesting deleveraging may not be complete. Finally, Ethereum faces a structural dilemma: Solana continues to eat into its market share in DeFi and DEX volumes, L2 fragmentation blurs ETH's value capture, and ETH ETF inflows lag far behind BTC ETFs.
However, from a cyclical perspective, this sharp sell-off is occurring precisely against a backdrop of continuously improving network fundamentals. This type of "divergence" has repeatedly appeared in crypto history and often constitutes a mid-term accumulation opportunity. During the 2017 bull run, BTC experienced 5 corrections of over 30%, and 3 such corrections in 2021. The current 34% correction is not unusual in historical cycles; BTC is still over 330% higher than its 2022 lows. When the market is extremely fearful (Fear & Greed Index at just 11) while on-chain fundamentals are improving, historical data shows remarkable subsequent 12-month returns: +80% after the extreme fear in September 2023, +120% after August 2024, and +190% after November 2022. While past performance does not guarantee future results, it suggests that maintaining focus on long-term fundamentals during times of panic is often a key way to identify structural buying opportunities.
4. Strategy's First BTC Sale: A Storm in a Teacup and the Repair of a Narrative Crack
On June 1, an SEC filing sent a small tremor through the crypto market. Strategy sold 32 Bitcoins between May 26-31, at an average price of approximately $77,135, cashing out about $2.5 million to pay dividends on STRC preferred stock. This transaction represents only about 0.004% of Strategy's total holdings—an amount not even a fraction of the company's daily stock trading volume—yet it detonated in the market for one key reason: it was Strategy's first net reduction in 41 months since August 2022. In the crypto narrative ecosystem, Saylor and his company Strategy have always played the role of the "ultimate HODLer," with "we will never sell Bitcoin" being a cornerstone of market faith. When the first crack appeared in this cornerstone, MSTR's stock price plummeted 11% in two days, and BTC sharply fell to $64,000.
A冷静 assessment of this event requires distinguishing between "narrative shock" and "fundamental change." 32 BTC out of Strategy's total holdings of over 500,000 is like taking a cup of water from the ocean. The purpose was clear—paying preferred stock dividends is a routine corporate finance operation and has nothing to do with a bearish view on Bitcoin. From a tax planning perspective, selling a small position at $77,135 to lock in tax credits is also entirely reasonable. However, during this downturn, the Fear & Greed Index plunged from 30 to 11, indicating investor risk perception is in an extremely fragile state. In such an environment, minor cracks in a "symbol of faith" are magnified infinitely by emotional amplifiers, with an impact far exceeding the event's true significance.
In the medium to long term, the repair of Strategy's narrative crack depends on two variables. First, whether Saylor will issue a public statement clarifying that this sale was a routine tax-planning operation, not a strategic shift. Second, whether Strategy resumes buying thereafter—if they reappear as a buyer in the coming weeks, the current panic will prove to be a storm in a teacup. From an institutional behavioral perspective, the repricing of an entity that has bought for 41 consecutive months due to just a 0.004% position adjustment is more a function of market sentiment than of fundamentals. After risks are fully released, when rational investors re-evaluate this event, panic-driven pricing often gets corrected.
5. The CLARITY Act and the Regulatory Inflection Point: The Year's Biggest "Unpriced" Catalyst
Amidst the current confluence of negative factors, a potentially severely underestimated positive variable is advancing in Washington. On May 15, the CLARITY Act passed a key vote in the Senate Banking Committee, advancing to a full floor vote. The bill is considered the "constitutional document" for U.S. crypto industry regulation—for the first time establishing clear regulatory boundaries for digital assets at the federal level, defining the jurisdictional division between the SEC and the CFTC, and providing a systemic legal framework for stablecoin issuance, exchange registration, and market structure. The House previously passed it with an overwhelming 294:134 majority, with bipartisan support exceeding expectations. The full Senate vote is highly likely to occur within June.

The strategic significance of the CLARITY Act for the crypto market cannot be overstated. The biggest uncertainty facing the crypto industry today is neither technology nor demand, but the lack of a regulatory framework. The U.S., as the world's largest capital market, has long plagued institutional investors with regulatory ambiguity—pension funds, endowments, and insurance companies allocate cautiously largely due to the lack of a clear compliance path. If the act passes, it will fundamentally eliminate this uncertainty: the credibility of spot ETFs as compliant investment tools will be further enhanced, attracting conservative institutions that have been on the sidelines; the $325.4 billion stablecoin ecosystem will gain room for legitimate operation; and the U.S. signal shifting from "ambiguous exclusion" to "clear acceptance" will have a global spillover effect.
Notably, amidst the current panic selling, the progress of the CLARITY Act seems completely unpriced by the market. In the price path of BTC falling from $78,000 to $64,000, there is almost no sign of price adjustment reflecting the bill's advancement. This phenomenon of "policy positives being drowned out by emotion" is not uncommon during times of extreme market fear. However, it also means that once sentiment is repaired and the bill is officially passed, this catalyst will release its full incremental effect from a price level that holds almost no expectations. For medium to long-term investors, identifying "unpriced" structural positives during market panic is a historically validated allocation strategy. Of course, the bill's trajectory still holds uncertainties—opposition from banking lobby groups on certain provisions, the specific timeline for the full Senate vote, and the President's willingness to sign all require ongoing monitoring.
6. Conclusion: Identifying the Invariance of Long-Term Narratives Amidst Panic
Surveying the crypto market landscape in early June 2026, we see a complex picture of coexisting "short-term panic and long-term fundamental improvement." From a price perspective: BTC has fallen from $78,000 to $64,000, ETH has dropped below $2,000, and the Fear & Greed Index is at 11—all indicators point to extreme fear. From a driving forces perspective: escalating geopolitics, macroeconomic tightening, record ETF outflows ($3.5 billion over 11 days), a crack in the faith narrative (Strategy's first BTC sale), and on-chain anomalies (Mt.Gox moving $739 million) constitute a rare and dense confluence of five negative catalysts. From a structural perspective: $1.624 billion in liquidation over 24 hours, with Open Interest still above $52 billion, suggests deleveraging may not be complete.
However, the underlying narratives of the crypto market have not fundamentally changed. Decentralization, digital sovereignty, store of value—these core logics underpinning the long-term value of crypto assets were valid when BTC was at $100,000 and remain valid at $64,000. Price fluctuations change short-term sentiment, not the security of the underlying protocols. The record-high network hash rate, the $325.4 billion stablecoin market cap (+37.9% YoY), and the steady progress of the CLARITY Act—these structural improvements are accumulating at a pace that market panic cannot perceive. History has repeatedly proven that extreme fear zones (Fear & Greed < 25) often present contrarian accumulation opportunities for medium to long-term investors, even though historical precedent is never a guarantee of future returns.
Looking ahead to the coming months, the trajectory of the crypto market will hinge on three key variables. The base case (approx. 50% probability): BTC establishes a bottom in the $60,000-$68,000 range for 2-4 weeks, awaiting the release of non-farm payroll data and the FOMC dot plot before rebounding to $70,000-$75,000. The optimistic case (approx. 25%): The CLARITY Act passes in June, combined with ETF capital inflows and geopolitical de-escalation, leading to a V-shaped BTC rally retesting prior highs above $78,000. The pessimistic case (approx. 25%): Non-farm payrolls beat expectations, raising rate hike expectations; Iran escalation pushes crude oil above $100, putting synchronized pressure on global risk assets, with BTC declining to $52,000-$56,000. But even in the most pessimistic path, BTC would still be over 260% higher than its 2022 lows—the long-term upward trend remains far from broken.
In summary, the current crypto market is undergoing a typical cyclical correction within a bull market. Panic is a normal component of market mechanisms—it compresses valuations, liquidates excessive leverage, and differentiates speculators from long-term holders. For students of the HTX Growth Academy and investors at large, the most crucial action now is not to make irrational decisions driven by emotion, but to return to fundamentals—examining hash rate trends, stablecoin growth, regulatory evolution, and the real-world application of decentralized technologies. A 34% drop in price does not equal a 34% drop in value. If the underlying narratives of the crypto market have not changed, the most appropriate strategy is not to panic and flee, but to maintain rationality amidst fear and hold a long-term perspective through volatility. As the old Wall Street adage goes: "Bull markets are born on pessimism, grow on skepticism, mature on optimism, and die on euphoria." The current extreme fear might precisely be the starting point for a new round of long-term accumulation.


