
BTC's Three Post-Market Projections & a Clash of Two Forces | Expert Analysis
- Core Viewpoint: This article, based on wave theory and multi-cycle technical analysis, projects the trends of BTC and HYPE. It believes BTC is currently at a critical directional decision point, while HYPE needs to focus on the breakout of the $45.76 level. Specific trading strategies and risk control plans are provided accordingly.
- Key Elements:
- BTC's daily adjustment structure presents three projections: a new upward wave initiation (bullish view), a complex five-wave adjustment (bearish view one), and a larger-scale adjustment (bearish view two). Projection two is considered a low-probability event due to excessive time extension of the D-wave.
- BTC's core focus this week is the gain or loss of the 4-hour level consolidation zone C (approximately $75,000-$78,500). Holding above the upper boundary suggests continued range-bound movement, while breaking below the lower boundary could initiate a daily-level correction.
- BTC's short-to-medium-term strategy is clear: maintain a neutral cash position for the medium term; for the short term, use 30% of capital to go long above $78,500-$79,500 or go short below $73,500-$75,000, with strict stop-loss measures in place.
- HYPE's daily chart shows a seven-segment structure, with segments 1-2, 2-3, and 3-4 forming an "ascending consolidation zone". The core focus this week is whether the price can break through the previous high of $45.76 to confirm the continuation of the upward structure.
- HYPE's short-term strategy revolves around the upper and lower bounds of the consolidation zone ($38.41 and $34.44). Go long when the price pulls back to support and stabilizes; go short if it effectively breaks below support. Limit positions to under 30% and strictly adhere to stop-losses.
The market never lies; it only remains silent.
As prices hover around key levels, both bulls and bears are waiting for an answer.
Over the past week, Bitcoin completed the wide-range volatility we previously anticipated within the core area of $79,500 to $80,600. The market has validated the effectiveness of the technical logic through its price action. But validation is just the starting point; the real battle begins this week.
BTC's daily adjustment structure is standing at a crossroads of three paths: Is it the start of a new upward wave, or a relay for a larger-scale correction? Wave count analysis can provide a framework, but the market ultimately votes with prices. On the HYPE front, a seven-wave structure is clearly traceable. Whether it decisively breaks the $45.76 level will be the most critical variable to watch this week.
In this week's article, we will continue to analyze from a multi-cycle perspective, sorting out the structure, determining the direction, and formulating contingency plans. The strategy is prepared; the rhythm is ours to keep.
Summary of Key Trading Insights for This Week:
• BTC Multi-cycle Structure Analysis (Detailed in Part 1)
• BTC Price Forecast and Mid/Short-term Strategies for This Week (Detailed in Part 2)
• HYPE Daily-level Structure Analysis (Detailed in Part 3)
• HYPE Price Forecast and Short-term Strategies for This Week (Detailed in Part 4)
Review of Last Week's Trading Strategy and Core Insights:
• BTC Price Forecast Validation: In last week's article, we highlighted the need to watch the battle between bulls and bears for the core $79,500 to $80,600 range, predicting a high probability of wide-range volatility. Current market action largely validates our previous analysis.
1. Bitcoin Multi-cycle Structure Analysis
1.1 BTC Daily-level Structure Analysis: (Three Wave Scenarios for BTC's Subsequent Move)
Bitcoin _ Daily K-line Chart:
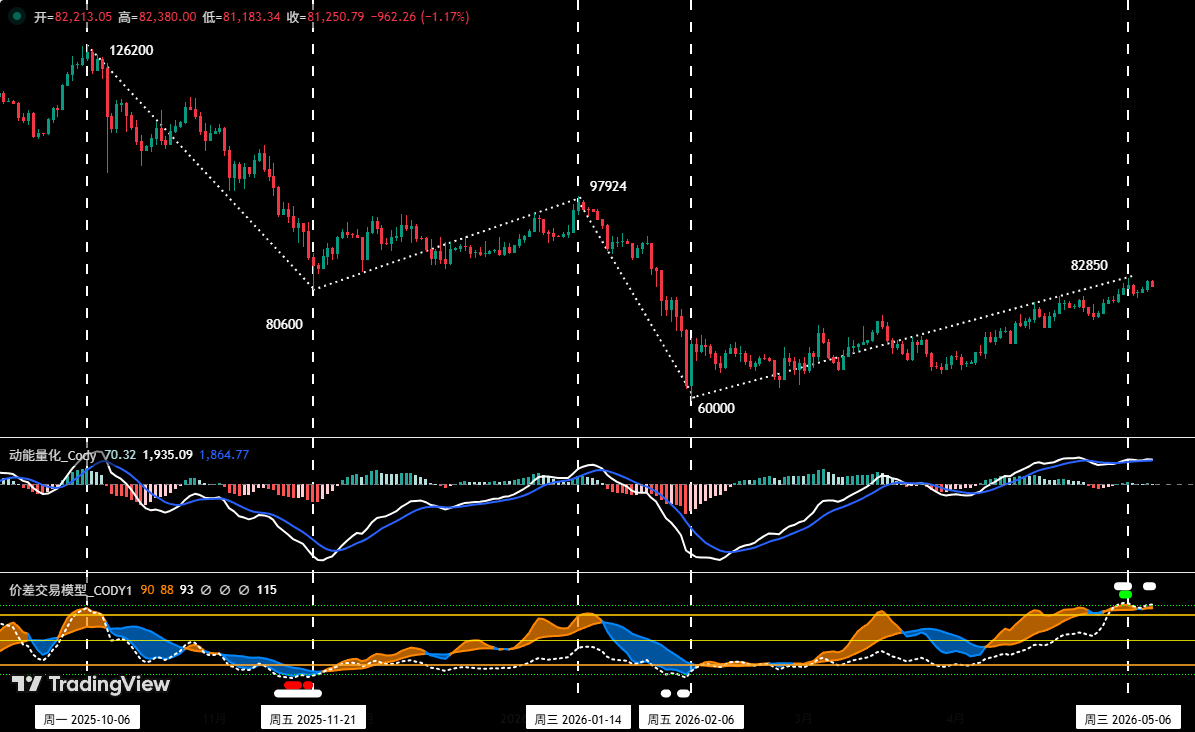
Figure 1
As shown in Figure 1, since hitting the high of $126,200 in October 2025, Bitcoin has entered an adjustment cycle lasting approximately 7 months (216 days). There is significant divergence in the market regarding the subsequent path. Bears argue the downtrend isn't over, expecting prices to resume their decline after the recent bounce, potentially breaking below the $60,000 low. Bulls, however, believe the correction from $126,200 ended at $60,000, marking a trend reversal, and the rally since February is the start of a new uptrend. Next, based on Elliott Wave theory rules, we will analyze this daily adjustment structure and propose three technical scenarios for your reference.
① Scenario 1: Correction Complete, New Uptrend Starts (Bullish View)
This view posits that the daily-level correction from the previous high of $126,200 has completed an A-B-C three-wave structure. Wave C ended at $60,000, and the market is currently in the Major Wave I (initial upward impulse).
• Wave A (Decline): $126,200 (2025-10-06) to $80,600 (2025-11-21), lasting 46 days, max decline ~36%.
• Wave B (Bounce): $80,600 (2025-11-21) to $97,924 (2026-01-14), lasting 54 days, max gain ~21.5%.
• Wave C (Decline): $97,924 (2026-01-14) to $60,000 (2026-02-06), lasting 23 days, max decline ~38.7%.
• Major Wave I (Uptrend Start): $60,000 (2026-02-06) to present, running for 94 days, max gain ~38.1%, currently in progress.
• Potential Major Wave II (Corrective Wave): The correction expected after Major Wave I ends, its low will not break below $60,000.
② Scenario 2: Complex 5-Wave Adjustment, Currently in Wave D Bounce (Bearish View 1)
This view suggests the daily-level correction from $126,200 might complete an A-B-C-D-E five-wave structure. The market is currently in Wave D bounce.
• Wave A (Decline): $126,200 (2025-10-06) to $80,600 (2025-11-21), lasting 46 days, max decline ~36%.
• Wave B (Bounce): $80,600 (2025-11-21) to $97,924 (2026-01-14), lasting 54 days, max gain ~21.5%.
• Wave C (Decline): $97,924 (2026-01-14) to $60,000 (2026-02-06), lasting 23 days, max decline ~38.7%.
• Wave D (Bounce): $60,000 (2026-02-06) to present, running for 94 days, max gain ~38.1%, currently in progress.
• Potential Wave E (Decline): The expected corrective wave after Wave D bounce ends, its low might break below $60,000.
③ Scenario 3: Larger Degree Adjustment (e.g., Weekly), Currently in Wave B Bounce (Bearish View 2)
This view posits the daily-level correction from $126,200 is part of a larger-degree A-B-C three-wave structure. The market is currently in the Wave B bounce of this larger pattern.
• Wave A (Decline): $126,200 (2025-10-06) to $60,000 (2026-02-06), lasting 112 days, max decline ~52.5%.
• Wave B (Bounce): $60,000 (2026-02-06) to present, lasting 94 days, max gain ~38.1%, currently in progress.
• Potential Wave C (Decline): The expected corrective wave after Wave B ends, its low might break below $60,000.
④ Summary:
• From the perspective of Elliott Wave time rules and form harmony, in Scenario 2, Wave B and Wave D are corrective waves of the same degree. However, the current Wave D bounce cycle (94 days) has significantly exceeded Wave B's (54 days). This temporal over-extension of Wave D disrupts the balance of the wave structure, substantially reducing the probability of this scenario.
• Based on the above, if Scenario 2 is excluded, the probabilities for Scenario 1 (Bullish) and Scenario 3 (Bearish) correspondingly increase. Determining which is more likely involves a comprehensive judgment of more dimensions, which we will analyze in depth in next week's review.
2. In-depth BTC Hourly Structure Analysis: (using 4-hour chart as analysis timeframe)
Bitcoin _ 4-hour K-line Chart
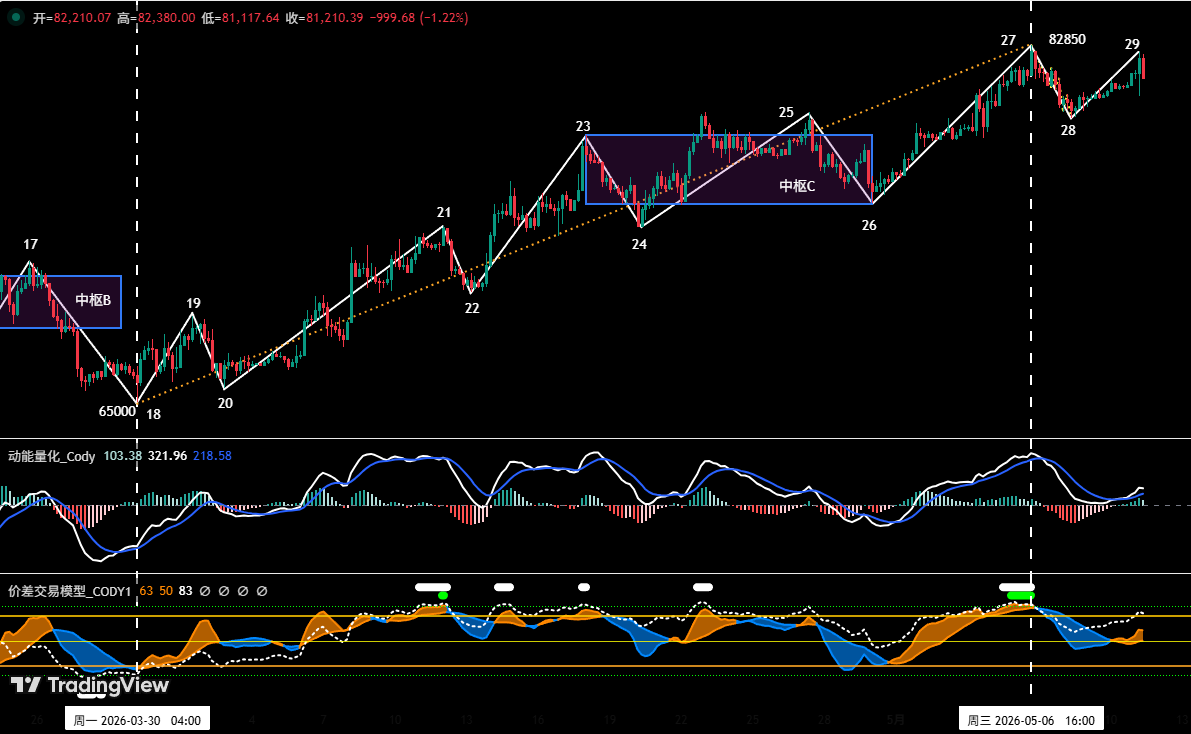
Figure 2
As shown in Figure 2, the price is currently above Fulcrum C, running in segment 28-29.
• If the price effectively holds support at the upper rail of Fulcrum C (~$78,500), a high-level wide-range consolidation pattern is maintained.
• If the price effectively breaks support at the lower rail of Fulcrum C (~$75,000), a daily-level correction might initiate.
2. Bitcoin Price Forecast and Trading Strategies for This Week
2.1 BTC Price Forecast for This Week:
Key Insight for This Week: The week's action hinges on the outcome of the battle between bulls and bears over the upper and lower rails of Fulcrum C. Gains or losses in this zone serve as a key indicator for whether the price can continue its bounce or reverse downwards.
2.2 Key Resistance Levels:
• First Resistance Zone: $83,500 ~ $84,500 (Previous high-volume consolidation area)
• Second Resistance Zone: $89,000 ~ $90,500 (Previous consolidation platform)
2.3 Key Support Levels:
• First Support Zone: $78,500 ~ $79,500 (Near the upper fulcrum rail)
• Second Support Zone: $73,500 ~ $75,000 (Previous key support level)
• Third Support Zone: $69,500 ~ $70,500 (Previous key support level)
2.4 Trading Strategies for This Week (excluding sudden news events)
① Medium-term Strategy:
Bitcoin _ Daily K-line Chart (Position Sizing Model)
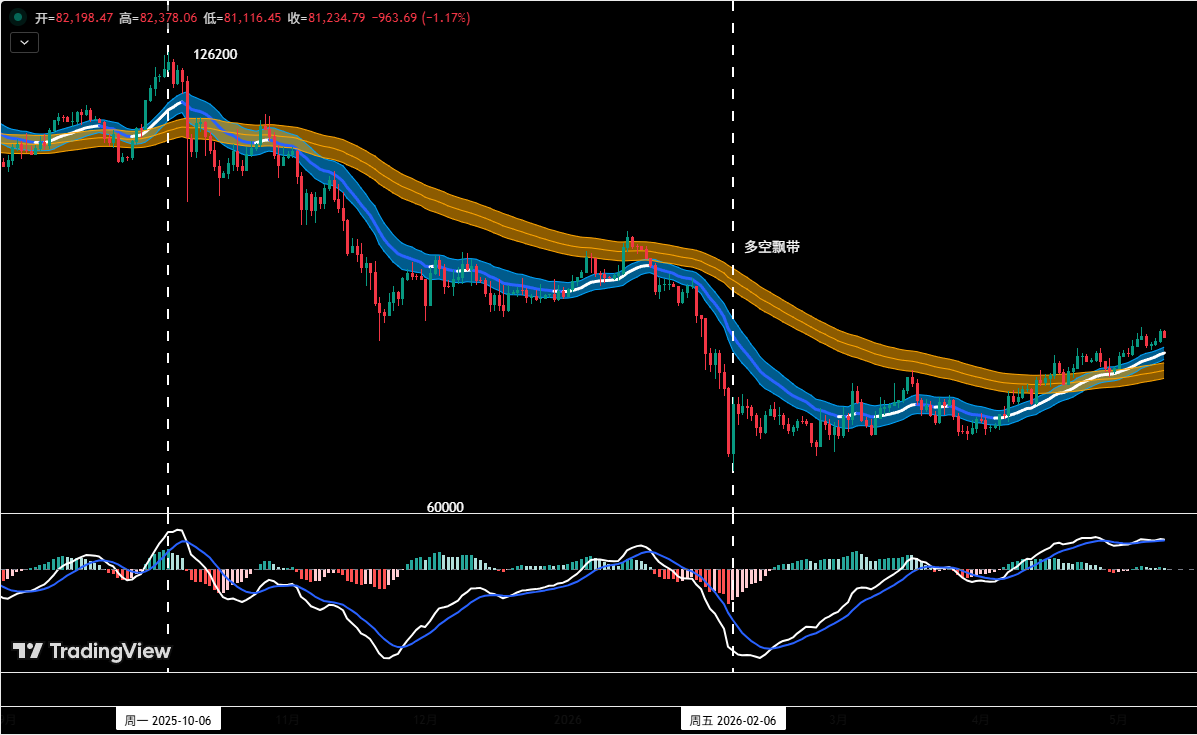
Figure 3
Position Sizing Model: As shown in Figure 3, based on trading rules, the medium-term direction is not yet clear. This week's medium-term strategy remains on the sidelines (0% position), patiently waiting for a clear direction before entering. Avoid chasing rallies or selling into dips.
② Short-term Strategy: Utilize up to 30% of capital, set stop-losses, and seek "spread" opportunities near support and resistance levels. (Use 30min/60min chart as operating timeframe).
③ For short-term operations, to dynamically respond to complex market developments, we prepare two specific A/B contingency plans in advance.
• Plan A: Effective Hold Above Support, Go Long on Dips.
• Entry: If the price effectively holds above the $78,500 ~ $79,500 zone, combined with bottom signals from quantitative models, establish a long position below 20% of capital.
• Risk Control: Initial stop-loss set below $78,500.
• Exit: When the price reaches key resistance levels with model signals indicating overextension, gradually close positions to lock in profits.
• Plan B: Effective Breakdown of Support, Sell Short on Rallies.
• Entry: If the price effectively breaks below the $73,500 ~ $75,000 support zone, combined with top signals from quantitative models, establish a short position below 30% of capital.
• Risk Control: Initial stop-loss set above $76,500.
• Exit: When the price reaches key support levels with model signals indicating oversold conditions, gradually close positions to lock in profits.
3. HYPE Daily-level Structure Analysis:
HYPE _ Daily K-line Chart
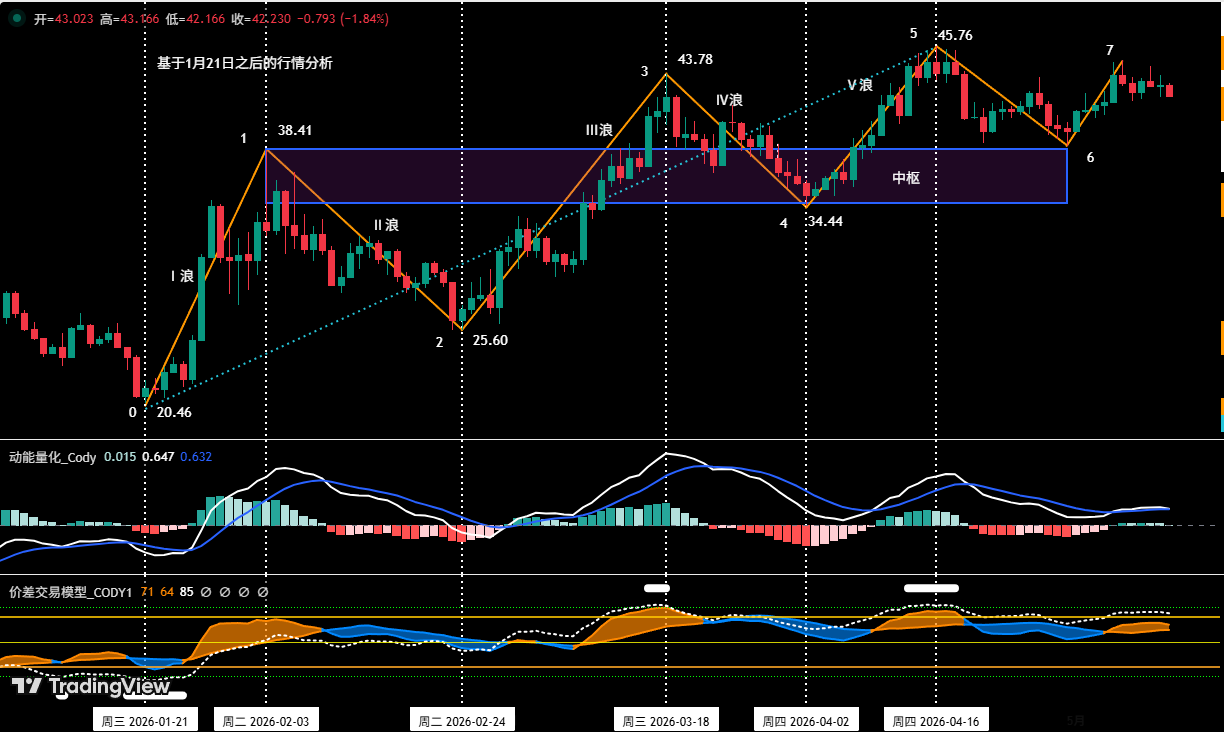
Figure 4
1. As shown in Figure 4, HYPE's uptrend starting from the January 21 low of $20.46 can be divided into seven segments on the daily chart: 0-1, 1-2, 2-3, 3-4, 4-5, 5-6, 6-7. The first five segments saw price making higher highs, forming a rising consolidation structure. In the last two segments, because endpoint 7 ($44.79) is lower than endpoint 5 ($45.76), it is currently tentatively viewed as a corrective structure.
2. Figure 4 shows that segments 1-2, 2-3, and 3-4 overlap each other, collectively forming a "rising fulcrum" (consolidation zone).
4. HYPE Price Forecast and Short-term Trading Strategy for This Week
4.1 HYPE Price Forecast for This Week:
Key Insights for HYPE This Week:
• Closely watch whether price can break the previous high of $45.76 in the coming sessions. If it breaks, the current structure remains within a daily-level uptrend.
• Monitor the battle between bulls and bears around the upper and lower rails of the fulcrum.
4.2 HYPE Short-term Trading Strategy for This Week:
• This week's short-term strategy will be based on gains or losses at two key price levels: the upper fulcrum rail ($38.41) and the lower fulcrum rail ($34.44).
• Long Strategy: If the price pulls back near $38.41, finds support with stabilization signals, combined with bottom signals triggered by the two major models, consider a small long position. Position size must be strictly below 30%, and adhere strictly to stop-loss discipline.
• Short Strategy: If the price effectively breaks support near $34.44, combined with top signals triggered by the two major models, consider a small short position. Position size must be strictly below 30%, and adhere strictly to stop-loss discipline.
5. Special Notes:
1. Upon Entry: Immediately set the initial stop-loss level.
2. Profit Reaches 1%: Move the stop-loss to the entry cost price (break-even point) to secure capital.
3. Profit Reaches 2%: Move the stop-loss to the 1% profit level.
4. Continuous Tracking: For every additional 1% profit thereafter, move the stop-loss up by 1%, dynamically protecting and locking in gains.
Financial markets change rapidly; all analysis and trading strategies require dynamic adjustment. The views, analysis models, and trading strategies presented here are based on personal technical analysis, intended solely as a personal trading log, and do not constitute investment advice or trading recommendations. Market risk exists; invest with caution. Do not make decisions based solely on this information.


