How did the South Korean stock market deleveraging occur?


- Core Viewpoint: The article systematically reviews the entire process of the 2026 South Korean stock market crash, triggered by excessive concentration in single-stock leveraged ETFs, retail investors using margin to buy the dip, and foreign capital withdrawal, which led to a multi-round negative feedback loop of deleveraging from stock price crashes. It points out that market structural fragility and the reversal of expectations were the main reasons for the stampede.
- Key Elements:
- On May 27, South Korea launched 2x leveraged single-stock ETFs for Samsung Electronics and SK Hynix, attracting massive retail funds, causing these two stocks to account for 52% of the KOSPI's market cap, forming an extremely concentrated leveraged structure.
- On June 22, the head of the Financial Supervisory Service publicly admitted that the product approval was rushed, breaking expectations of policy support and becoming a turning point in confidence. The next day, the KOSPI crashed 9.99%, triggering a circuit breaker.
- During the first phase of deleveraging (June 23), prices plummeted but margin balances did not fall, and retail investors continued to buy the dip. In the second phase (June 24-25), forced liquidations and new margin financing both hit records, creating an anomalous state of "price deleveraging while balance sheets did not deleverage."
- In June, foreign capital saw a net outflow of $12.63 billion, while retail investors net bought 42.4 trillion won to take the other side, transferring risk from global institutions to South Korean household sectors. In July, positive earnings news failed to boost stock prices, and the market shifted to concerns about a peak in the memory cycle.
- The daily rebalancing mechanism of ETFs amplified two-way volatility: forced to reduce positions during declines and forced to increase positions during rebounds. Margin call data lagged behind the crash, hitting the fourth-highest level in history on July 9.
- On July 16, the Bank of Korea raised interest rates to 2.75%, and the Financial Services Commission restricted the listing of single-stock leveraged products and raised thresholds, marking the entry of deleveraging into a regulatory-led phase.
- As of July 16, the KOSPI had accumulated a decline of 25.17%, but margin balances had only fallen by 11%. The price decline was 2.3 times the reduction in debt, indicating that the contraction of the leverage bubble is still ongoing.
Original author: qinbafrank (X: @qinbafrank)
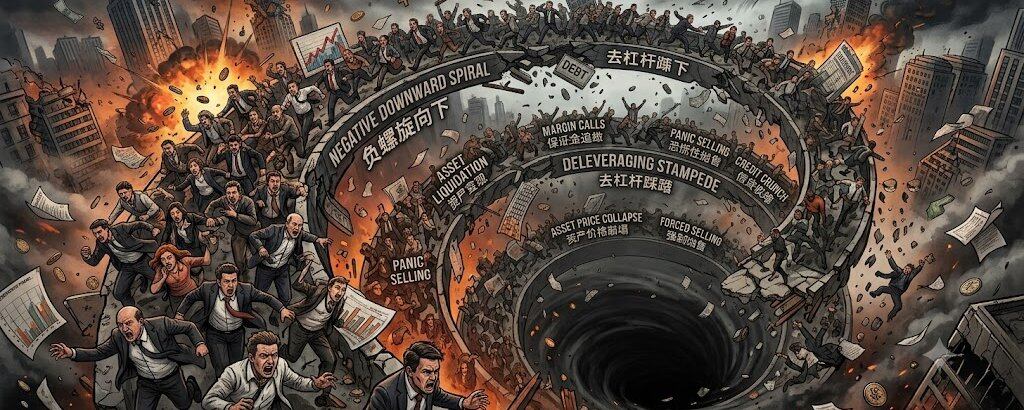
The tragic deleveraging stampede has already occurred. Now is the time to review and sort out how it happened. From a personal perspective, this wave of deleveraging began with the Korean stock market. Although the US stock market started deleveraging on July 1, looking back, the first big bearish candle on June 23 marked the beginning. Today, let's trace the timeline of how this wave of deleveraging unfolded in the Korean stock market.
1. Before June 23, All Conditions for a Stampede Were Already in Place
To understand the subsequent crash, we must first look at the market structure formed from May 27 to June 22.
1. Single-Stock 2x Leveraged Products Further Concentrated Funds into Samsung Electronics and SK Hynix
On May 27, the Korean market launched single-stock 2x leveraged and inverse ETFs tracking Samsung Electronics and SK Hynix. By June 19, retail investors had accumulated net purchases of long leveraged ETFs of approximately 8.2 trillion KRW, including about 4.6 trillion for SK Hynix and 3.7 trillion for Samsung Electronics; during the same period, net purchases of inverse ETFs were only around 0.3 trillion KRW.
More critically, funds were not simply moving from cash into the market, but were clearly shifting from more diversified semiconductor ETFs and KOSPI index ETFs toward single-stock leveraged products. By June 19, the asset size of SK Hynix leveraged ETFs had reached 9.15 trillion KRW, and Samsung Electronics-related products reached 5.22 trillion KRW.
This led to three structural changes:
1) Investors shifted from diversified sector exposure to concentrated exposure in two stocks;
2) Ordinary stock volatility was further amplified by the 2x leverage;
3) The larger the ETF size grew, the larger the subsequent daily rebalancing trades became.
The Korea Capital Market Institute estimates that the asset size of SK Hynix-related leveraged ETFs increased by about 4.31 trillion KRW between June 10 and 19, of which approximately 3.6 trillion was not from new subscriptions but from net asset value inflation due to the underlying asset's rise. In other words, even without new investors entering, the market's rise itself automatically created greater subsequent rebalancing demand.
2. The Two Stocks Were Approaching "Half of KOSPI"
The combined market capitalization weight of Samsung Electronics and SK Hynix in KOSPI rose from 34% at the end of 2025 to 49% on May 26, and further to 52% by July 15.
This is not leverage through traditional borrowing, but it constitutes a very strong index structural leverage:
A 10% drop in these two stocks, even if other companies remain unchanged, could directly drag KOSPI down by approximately 5%.
As of July 15, the total market capitalization of 16 single-stock leveraged or inverse products had expanded from 4.4 trillion KRW at launch on May 27 to 11.9 trillion KRW, with daily trading volume increasing from 10.4 trillion to 13 trillion KRW.
3. The Regulator's Statement on June 22 Became a Turning Point for Confidence
On June 22, the head of the Financial Supervisory Service publicly admitted that the approval of related products was "too hastily prepared" and stated that measures to stabilize the market were being studied.
The regulator also explained that the initial approval of domestic single-stock leveraged products was intended not only to bring demand for offshore products under the domestic regulatory framework but also to attract Korean retail funds back from the US and Hong Kong markets to alleviate the pressure of KRW depreciation. However, the actual exchange rate effect was limited.
By the end of May, the total size of various retail leveraged investments in Korea had reached approximately 60 trillion KRW.
The market implication of this statement was not "regulators will immediately ban trading," but rather:
- The expectation of policy support for product expansion was broken;
- The room for brokers and asset managers to expand products was questioned;
- Foreign investors began to worry that regulations would change market liquidity structure;
- The market seriously assessed the risk of the 2x ETF's negative feedback loop for the first time.
2. Key Index Path
Below are the most important price points of this cycle. Relative declines are all based on the close of 9,114.55 on June 22.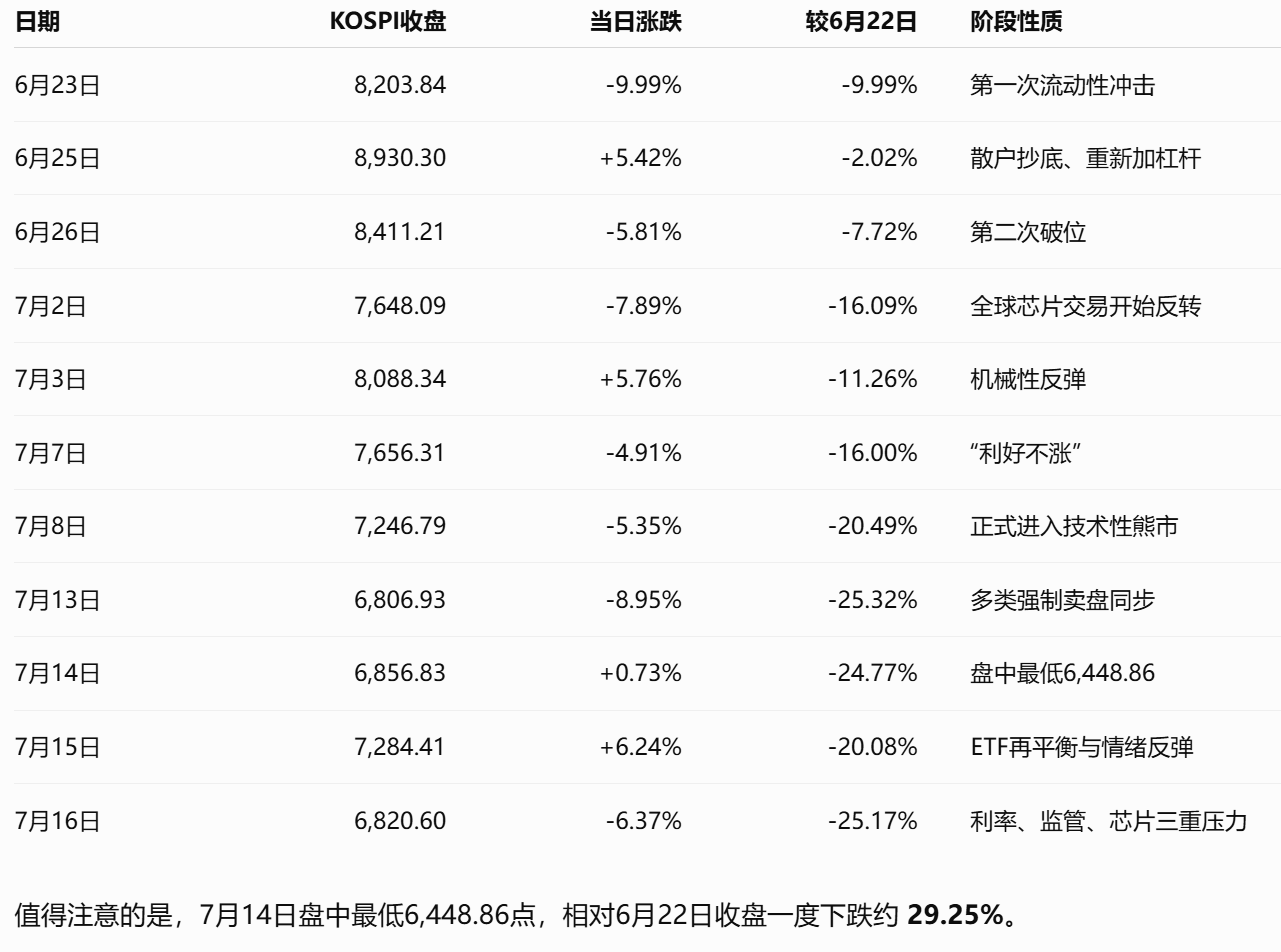
3. A Timeline of the Deleveraging Process
Phase 1: June 23 – Prices Crashed First, But Debt Did Not Decline
On June 23, KOSPI fell 9.99% in a single day, with Samsung Electronics and SK Hynix both dropping over 12%, triggering a 20-minute market-wide trading halt.
Direct triggers included:
- The previous day's strong warning from regulators regarding leveraged ETFs;
- Foreign investors began concentrating their selling on the two chip giants;
- A simultaneous adjustment in global tech stocks;
- After a sustained rally, institutions had demands for profit-taking and weight control.
Since Samsung Electronics and SK Hynix already accounted for over half of KOSPI, selling pressure on these two stocks quickly transformed from a stock-specific issue into an index issue.
However, a very important and dangerous phenomenon emerged on this day:
- Forced liquidation amount rose from approximately 19.9 billion KRW the previous day to 42.427 billion KRW;
- Unsettled receivables instead increased by 181.6 billion KRW, reaching 1.4792 trillion KRW;
- Credit loan balance remained near 38 trillion KRW.
In other words, the first day's crash did not lead to widespread debt repayment by investors. On the contrary, some investors continued to use short-term credit funds to add positions during the decline.
The Essence of This Phase
This was a price deleveraging, but not a balance sheet deleveraging.
Prices fell rapidly, reducing ETF net asset values and collateral values; but retail investors did not retreat; instead, they continued to buy the dip. Existing leverage was not cleared, while new leverage was entering.
Sentiment-wise, the market still interpreted the decline as a short-term technical mispricing caused by regulatory rhetoric, rather than a trend reversal.
Phase 2: June 24-25 – Simultaneous Forced Liquidations and Re-leveraging
On June 24 and 25, KOSPI rebounded by 3.26% and 5.42% respectively, closing on June 25 only about 2% below the June 22 high.
But beneath the surface rebound, two completely opposite things were happening internally.
On One Hand, Forced Liquidations
Publicly reported forced liquidations on June 24 reached approximately 110.793 billion KRW. This mainly involved short-term credit trades where investors failed to top up margins in time, being processed by securities firms.
On the Other Hand, New Margin Financing
On the same day, the credit loan balance instead increased by about 539.2 billion KRW, reaching a record 38.6328 trillion KRW.
This means:
Old accounts were being liquidated, while new or surviving accounts were borrowing more money to buy the dip.
Therefore, June 24 became the peak of the credit loan balance for the entire market in this cycle, not before the crash on June 23.
Why Leveraged ETFs Amplified the Rebound
A 2x long ETF must restore its 2x target exposure daily.
Assume the ETF's initial NAV is A, holding 2A exposure in stocks or derivatives:
- After the underlying drops 10%, the ETF's NAV falls to approximately 0.8A;
- The market value of the original exposure becomes roughly 1.8A;
- The new target exposure should be 1.6A;
- Therefore, it needs to sell approximately 0.2A.
Conversely, when the underlying rises, the ETF must buy more.
The Korea Capital Market Institute estimates that the rebalancing trade size of single-stock 2x ETFs is roughly proportional to "previous day's AUM × day's stock return," with adjustments occurring in the same direction in both the spot and futures markets.
Therefore, the rebound on June 24-25 was simultaneously driven by:
- Retail buying the dip;
- Short covering;
- Upward rebalancing of leveraged ETFs;
- Hedging adjustments by brokers and market makers.
This was not a healthy rebound after completing deleveraging; it was more like re-leveraging in the middle of the deleveraging process.
Phase 3: June 26-30 – Foreign Exodus, Retail Absorption, Risk Begins to Shift to Household Sector
On June 26, KOSPI fell another 5.81%. Although it only closed down 0.20% on June 29, intraday volatility was extreme, with the Korea Volatility Index (VKOSPI) soaring to an all-time high of 97.99, compared to just 28.85 at the end of 2025.
The most important change in this phase was not a single trading day, but a shift in shareholding structure.
Foreign Investors Were Not Simply "Bearish on Korea," But Reducing Concentration
In the first half of 2026, foreign investors had a net outflow of approximately 70.8 billion USD from the Korean stock market; in June alone, the net outflow was about 12.63 billion USD.
These sell orders came from various types of institutions:
- Mutual funds sold about 7.5 billion USD;
- Pension funds sold about 4.35 billion USD;
- Hedge funds sold about 1.87 billion USD.
Analysis suggests this capital flight was not entirely due to a belief that the Korean economy or semiconductor profitability would collapse, but because:
- Korean and Taiwanese chip stocks had rallied too much;
- The weighting of Samsung Electronics, SK Hynix, and TSMC in global funds had expanded rapidly;
- Both passive and active funds needed to control concentration in single countries, single sectors, and single stocks;
- Some funds were engaging in currency hedging and benchmark rebalancing;
- Long-term institutions were taking profits.
Retail Investors Became the Marginal Buyers of Last Resort
Korean individual investors accumulated net purchases of KOSPI stocks of approximately 42.4 trillion KRW in June.
So, the core capital flow structure in June was:
Foreign investors, pension funds, and mutual funds reduced risk, while Korean retail investors absorbed these positions through cash, margin financing, and leveraged ETFs.
This supported the index in the short term but also led to two consequences:
- Risk shifted from global institutional balance sheets to Korean household balance sheets;
- Average risk tolerance of remaining market holders decreased, making them more sensitive to margin calls and price fluctuations.
Phase 4: July 1-3 – Global Semiconductor Trade Reverses, ETFs Began Systematically Selling Low and Buying High
On July 1, KOSPI fell 2.04%, followed by a further sharp drop of 7.89% on July 2.
On July 2:
- SK Hynix fell 14.6%;
- Samsung Electronics fell 9.1%;
- Japan's Kioxia fell over 13.5%;
- US semiconductor stocks also saw significant adjustments overnight.
The market began to shift from "current semiconductor earnings are good" to questioning:
- Rumors of Meta selling computing power reignited concerns about oversupply;
- Whether US cloud companies can sustain high-intensity AI capital expenditures;
- Whether massive data center construction is entering a phase of marginal slowdown;
- Whether the trillions of dollars in new capacity from Samsung Electronics and SK Hynix will lead to future oversupply;
- How long the current memory price increase can last;
- Whether the pace and duration of earnings growth are fully reflected in stock prices.
Industrial Sparks and Market Amplifiers Must Be Distinguished
The industrial sparks were:
- Global semiconductor profit-taking;
- Questions over the sustainability of AI CapEx;
- Memory price growth potentially peaking;
- New capacity plans potentially altering future supply-demand dynamics.
But what truly expanded the decline to nearly 8% was the market structure:
- Foreign investors selling heavyweight chip stocks;
- 2x ETFs forced to reduce exposure as underlying assets fell;
- Futures and spot market makers simultaneously selling to hedge;
- Index decline widening, reducing margin account collateral ratios;
- Risk models, stop-loss orders, and algorithmic funds further reducing positions.
KOSPI rebounded 5.76% on July 3, which can also be explained by the reverse operation of the above mechanism: retail buying the dip, short covering, and ETFs re-adding positions.
Thus, this phase formed a classic pattern:
During declines, ETFs must sell; during rebounds, ETFs must buy; the market does not gradually converge, but both ups and downs are amplified.
The Korea Capital Market Institute also emphasizes that not all volatility can be attributed to ETFs, as volatility in US and Japanese memory stocks also rose significantly during the same period, with factors like Middle East tensions, inflation, and global interest rate uncertainty equally important. ETFs were amplifiers, not the sole root cause.
Phase 5: July 6-8 – "Good News Fails to Rally," Market Shifted from Technical Correction to Earnings Sustainability Concerns
July 7 was the second key turning point in sentiment
Samsung Electronics released preliminary guidance indicating Q2 operating profit might have increased roughly 19-fold year-on-year. However, on the same day, Samsung Electronics' stock still fell 6.9%, at one point dropping over 10% intraday; SK Hynix fell 6.1%.
This indicates the market had entered a phase where "good news can no longer lift share prices":
- It's not that earnings are bad;
- It's that previous expectations were too high;
- Investors began to worry that current earnings represent a cyclical peak;
- Good news is used for profit-taking, not chasing highs.
On that day, foreign investors net sold approximately 2.9 trillion KRW, while individual investors net purchased about 3.2 trillion KRW. More alarmingly, the credit loan balance in the KOSPI market was still around 29.7 trillion KRW, only slightly below the peak of 29.8 trillion KRW in late June.
This means that even though the index had fallen roughly 16% from its peak, KOSPI credit loan debt had barely decreased.
Risk Began to Spread to Other Industries
July 7 was not just about semiconductor declines:
- LG Energy Solution estimated Q2 operating profit would fall 77% due to weak EV demand, and its stock dropped 6.4%;
- Hanwha Ocean fell 22.7% after Canada chose a German design for its submarine project.
This shows the market's concern expanded from structural issues in semiconductors to:
- Slowing profitability in the battery industry;
- Uncertainty in defense and shipbuilding orders;
- Reduced risk budget for high-valuation growth stocks;
- Negative news for individual stocks being priced in more aggressively.
July 8 Officially Entered Bear Market Territory
On July 8, KOSPI fell 5.35%, with a decline of over 20% from the June 22 high.
The previous night, the US Philadelphia Semiconductor Index fell 4.7%, and the market continued to worry about the sustainability of AI investment, slowing memory price growth, and peak earnings. South Korea's Finance Minister began publicly stating that risks associated with single-stock leveraged ETFs would be closely monitored.
A notable detail is that on this day