






The S&P Low Volatility Index is "Moving in Reverse" – Is the U.S. Stock Market About to Shift?


- Key Insight: The S&P 500 Low Volatility Index has exhibited an unprecedented anomaly (rising when the broader market falls, and falling when it rises), revealing a market driven by the dual anxieties of FOMO (fear of missing out) and NBO (fear of not bailing out). Historical data indicates this typically predicts poor future performance for the stock market and tech stocks.
- Key Elements:
- Over the past six months, the S&P 500 Low Volatility Index has, on average, risen on days when the S&P 500 fell, and fallen on days when it rose. This combination of positive/negative price reactions is the first occurrence since 1990.
- This anomaly suggests a split in investor psychology: driven by FOMO, they sell low-volatility stocks to chase higher-risk assets on up days; driven by NBO, they buy low-volatility stocks as a safe haven on down days.
- Historical data shows that when the performance spread of the low volatility index is in the lowest quartile, the S&P 500's average annualized price return over the next week is only 3.92%, significantly lower than the 17.26% seen in the highest quartile.
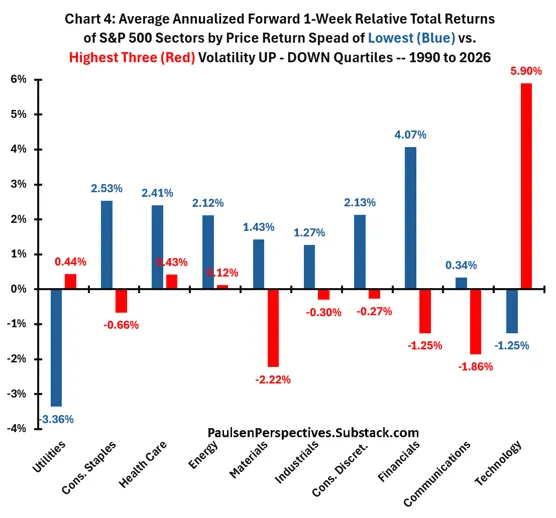
- When the low volatility spread is in the lowest quartile, old economy sectors outperform new economy sectors (tech and communication services), suggesting a potential shift in investment style toward defensive positioning.
- While tech stocks (e.g., Mag 7) still show strong earnings, their performance has only marginally outperformed the broader market since mid-2024. Additionally, increased market volatility (e.g., the S&P 500's nearly 20% decline in spring 2025) signals rising risk.
Original Author: Jim Paulsen
Original Translation: Shenchao TechFlow
Editor's Note: The S&P 500 Low Volatility Index has exhibited an anomaly for the first time in history: it rises when the broader market falls, and falls when the broader market rises. This unprecedented price action reveals the schizophrenic state of today's market, where investors are torn between the Fear Of Missing Out (FOMO) on the AI rally and the fear of being left holding the bag (NBO). Historical data suggests that this signal often precedes lackluster performance for the stock market and tech stocks.
The recent unique price action of the S&P 500 Low Volatility Index indicates that investors are simultaneously caught in two anxieties: the fear of missing out (FOMO) and the fear of not bailing out in time (NBO).
Recently, the performance of the S&P 500 Low Volatility Index has set an unprecedented record. Typically, low volatility stocks rise less when the S&P 500 goes up and fall less when it goes down. However, over the past six months, low volatility investments have, on average, risen on days when the S&P 500 fell, and fallen on days when the S&P 500 rose. In other words, S&P 500 daily declines not only allowed defensive low-volatility stocks to outperform by "falling less," but actually pushed their prices higher. Conversely, on days the S&P 500 rose, low-volatility stocks didn't just underperform; their actual prices declined.
In my view, this recent, unprecedented, and extreme price action of the S&P 500 Low Volatility Index suggests that investors are simultaneously plagued by the dual anxieties of FOMO and NBO. Historically, such price behavior in low volatility stocks often serves as a warning sign for the broader stock market and technology shares.
What is the S&P 500 Low Volatility Index?
The S&P 500 Low Volatility Index aims to measure the performance of the 100 least volatile stocks in the S&P 500. This index comprises various defensive securities, including high-quality names with stable earnings, secure dividends, and low price beta. It is the quintessential buy for the fearful and a quick sell during bullish periods. It is specifically designed to rise less in bull markets and fall less in bear markets, catering to conservative investors who want market participation but fear missing their exit.
But what does it mean when low volatility investments rise during market declines and fall during market advances? In my opinion, this paints a picture of a market driven not by excessive bullishness or bearishness, but by investors simultaneously worried about FOMO and NBO. Excessive bullishness leads to low volatility stocks underperforming; excessive bearishness makes them winners. However, when the dual fears of FOMO and NBO are both prominent, low volatility stocks paradoxically "rise" on down days and "fall" on up days. Under the co-existence of FOMO and NBO, an up market day sees buying of high-risk stocks accompanied by selling of low volatility stocks, while a down day simultaneously triggers selling of high-risk stocks and buying of low volatility stocks.
Performance of the S&P Low Volatility Index on Up vs. Down Days for the S&P 500
Chart 1 shows the average daily percentage price change of the S&P 500 Low Volatility Index over rolling 6-month periods on all S&P 500 up-days (blue line) and all S&P 500 down-days (red line) since 1990. As illustrated, in almost all rolling six-month periods, the average percentage price change of the S&P 500 Low Volatility Index is positive when the S&P 500 rises and negative when the S&P 500 falls.
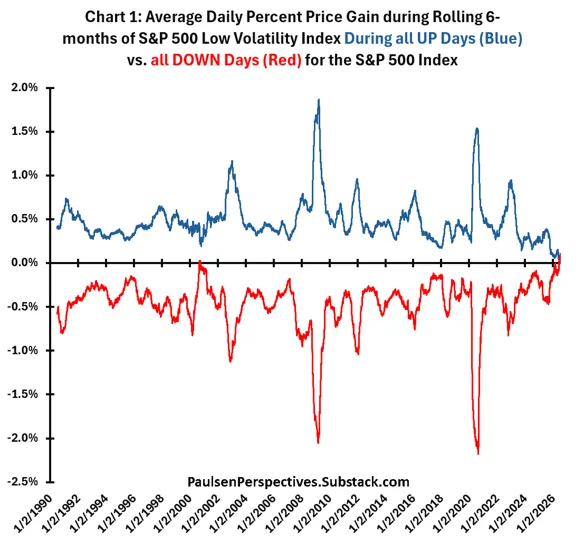
Aside from the current period, only around the year 2000 was there a brief instance where the rolling six-month percentage price change of the Low Volatility Index was "positive" during S&P 500 up-days, and never was it "negative" during S&P 500 down-days. Although the Low Volatility Index almost always underperforms during broad S&P 500 up-markets and outperforms during down-markets, except for the current era, it has never in the past six months risen on all S&P 500 down-days and fallen on all S&P 500 up-days. In other words, over the past six months, the behavior of the S&P 500 Low Volatility Index is "unique" compared to any period since 1990 – it has, on average, risen on all S&P 500 down-days (red line) while falling on all S&P 500 up-days (blue line) over the last six months! This potentially reflects a milestone, or at least a very rare, investor mindset or sentiment driving the stock market – my guess is the FOMO/NBO combination.
Historical Average Performance Differential of the Low Volatility Index (Up-days minus Down-days)
Chart 2 illustrates this unique shift in the S&P 500 Low Volatility Index's performance from a slightly different angle. It shows the average performance difference of the Low Volatility Index over the past 26 weeks when comparing all S&P 500 up-weeks to all S&P 500 down-weeks. This is essentially the spread between the red and blue lines in Chart 1. As shown, in the current period, this spread is "uniquely" negative (meaning the Low Volatility Index gains less during S&P 500 up-days than it gains, or loses less, during down-days).
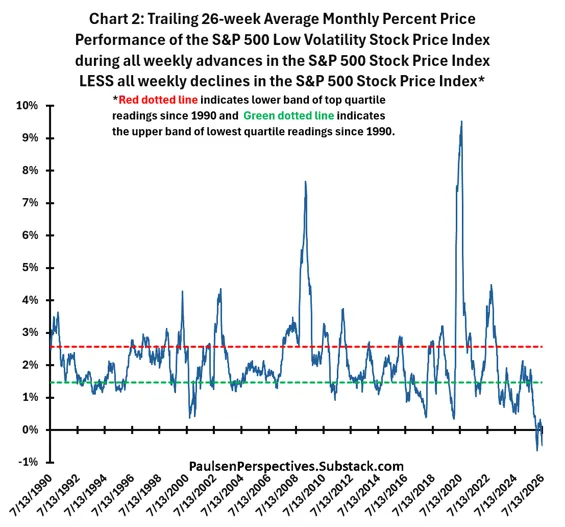
While this performance spread has never been as negative as it is today, it has frequently fallen into the lowest historical quartile (i.e., below the green dashed line) around several major stock market peaks – such as mid-2000, 2007, 2018, early 2020, and late 2021. Conversely, it has often surged into the highest quartile (above the red dashed line) around several major market bottoms – such as early 1991, late 2002, March 2009, mid-2020, and late 2022.
FOMO/NBO and Future S&P 500 Performance
What does the performance differential of the S&P Low Volatility Index on S&P 500 up-days minus down-days imply for the future overall performance of the S&P 500? Chart 3 highlights that, since 1990, the average annualized future 1-week price return of the S&P 500 has been highly sensitive to the quartile of this Low Volatility spread differential. When the Low Volatility spread is in the highest quartile (i.e., above the red dashed line in Chart 2), the future average annualized price return of the S&P 500 is a robust 17.26%. When the spread is in the middle two quartiles, the average annualized future 1-week return drops to 10.12%. Finally, when the Low Volatility spread is in the lowest quartile, the average annualized future 1-week price return of the S&P 500 falls to a disappointing 3.92%.
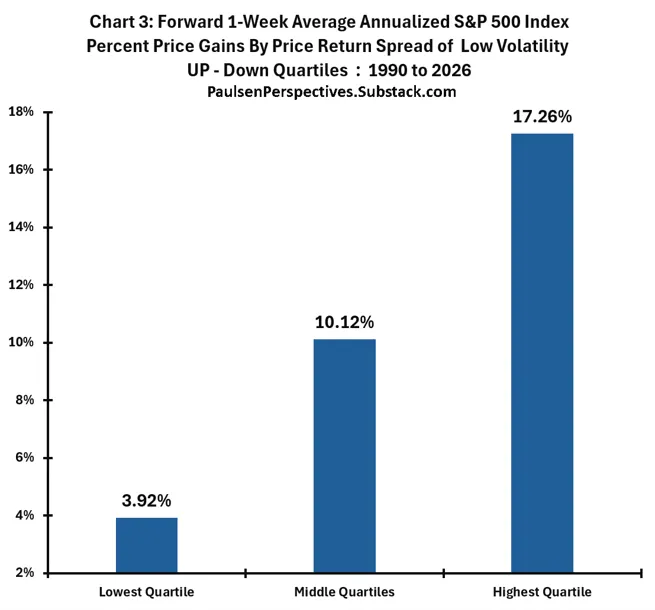
Clearly, the performance differential of the Low Volatility Index between overall up and down market days has historically been important for the future performance of the S&P 500 index. Essentially, as long as low volatility investments perform significantly better in up markets than in down markets, the S&P 500 typically delivers solid returns. However, when low volatility investments perform relatively better on down market days compared to up market days, the future performance of the S&P 500 tends to struggle.
Overall, I believe this indicator serves as a proxy for investor sentiment. The performance of low volatility investments demonstrates the degree of emphasis investors place on risk aversion. When low volatility investments begin to perform much better in down markets than in up markets, it signals that investors are prioritizing capital preservation – meaning their biggest fear is failing to exit in time (NBO). In the unique position we find ourselves in today, where low volatility prices are negative on up-days because FOMO drives investors to sell them for more aggressive alternatives, and positive on down-days because falling markets genuinely frighten investors about NBO – this suggests a nearly schizophrenic anxiety is driving the stock market.
Finally, Chart 4 shows the performance of the ten S&P 500 sectors since 1990 (Real Estate excluded due to its shorter history) when the Low Volatility performance spread is in its lowest quartile (blue bars) versus the top three quartiles (red bars). Apart from the Utilities sector, the lowest quartile results particularly favor the 'Old Economy' sectors of the S&P 500, whereas the 'New Economy' sectors (i.e., Technology and Communication Services) tend to perform significantly better when the Low Volatility spread is in the upper three quartiles. Therefore, if the Low Volatility spread remains in the bottom quartile, historical experience suggests investors should not only expect potential underperformance from the S&P 500, but also consider increasing exposure to 'Old Economy' sectors and be more cautious with their overweight positions in Technology and Communication Services.
Final Thoughts
This is the first sign of a crack in the 'New Economy' trade during this bull market. While the Technology/Communication sectors are still leading the stock market and received a significant boost recently from the AI narrative, market volatility has increased – evidenced by the S&P 500's nearly 20% decline in the spring of 2025 and its nearly 10% drop in Q1 2026. Although earnings results, especially from New Economy companies, remain stellar, the performance of S&P 500 Tech stocks and the Mag 7 index has only slightly outpaced the broader market since mid-2024. Furthermore, for the first time in this bull market, 'broader market' names like small caps, value stocks, and international equities have performed more closely in line with New Economy stocks over the past year.
Investor sentiment indicators show investors are neither overly enthusiastic nor extremely pessimistic. The CNN Fear & Greed Index is slightly below average, while the AAII Sentiment Survey is slightly above average.
No one wants to miss the opportunity of AI taking over the world (FOMO?), yet many are also growing increasingly uneasy about high valuations, concentrated holdings, and aggressive, frothy future earnings expectations (NBO?). The result? The performance spread of the Low Volatility Index between up and down days has turned negative for the first time ever, reflecting a stock market that appears increasingly and perhaps schizophrenically driven by both FOMO and NBO simultaneously! This suggests investors may need to exercise caution in the coming months.


