






BitMart VIP Insight | June Crypto Market Review and Hotspot Analysis


- Core Viewpoint: In June 2026, the global macro environment presented a contradictory pattern of "geopolitical easing but persistent inflation." Expectations for interest rate cuts have cooled, while expectations for rate hikes have intensified, creating sustained downward pressure on the crypto market. Major assets like BTC and ETH saw significant monthly declines, with continuous net capital outflows and tightening market liquidity.
- Key Factors:
- On the macro level, the May CPI remained high at 4.2% year-over-year. Non-farm payrolls added 172,000 jobs, exceeding expectations. The Fed's hawkish signals were reinforced, putting pressure on risk asset valuations amid a high-interest-rate environment.
- The overall crypto market declined, with total market capitalization falling by approximately 16.1% in June. BTC fell 18.4% for the month, closing around $60,000; ETH fell 25%, underperforming BTC; SOL was relatively resilient, dropping 9.5% for the month.
- Liquidity tightened, with the total supply of major stablecoins decreasing by approximately $7 billion (-2.5%) during the monitoring period. The net asset shrinkage of BTC ETFs (-22.3%) exceeded the spot price decline (-18.5%), indicating active institutional redemptions.
- Notable market events include Strategy's crisis of confidence (selling coins, stock price decline), the Zcash vulnerability (supply credibility questioned), valuation pressure on SpaceX post-IPO, and the first hawkish signals from Warsh at the FOMC.
- Market focus in July will be on whether the CLARITY Act can secure 60 votes in the Senate, whether the June CPI data will confirm a cooling of inflation, and whether US-Iran negotiations can shift from "technical openings" to "commercial openings."
 Key Points:
- The core contradiction of the global macro environment in June was that the US-Iran ceasefire drove oil prices down, alleviating energy pressures. However, US inflation, employment, and consumption data remained relatively strong. Coupled with Warsh's first FOMC meeting delivering a hawkish signal, expectations for rate cuts cooled significantly while expectations for rate hikes re-emerged. The May CPI and PCE remained elevated, non-farm payrolls added 172,000, the unemployment rate held at 4.3%, and ISM price sub-indices surged. This indicates the US economy is still in a "high inflation + strong employment + resilient consumption" combination, leaving the Fed with almost no room to pivot towards easing in the short term. At the asset level, BTC, US growth stocks, and high-valuation AI sectors were all suppressed by high-rate expectations. Although the semiconductor sector saw a structural rebound driven by Micron's earnings, market focus has shifted from "AI demand explosion" to "AI profit realization ability," and risk asset valuations overall continue to face pressure.
- In June, crypto market trading volumes briefly surged twice before rapidly declining, reflecting overall insufficient liquidity driven primarily by events. Total market capitalization fell by approximately 16.1% over the month, with sustained net capital outflows. New coins also performed weakly; only ARX and RE garnered short-term attention based on popular narratives, but their high valuations and high turnover indicated strong speculative characteristics.
- In June, BTC and ETH spot ETFs faced pressure but showed clear divergence: BTC ETF net assets shrank more than the spot price decline, indicating institutional redemptions beyond price drops. Conversely, ETH ETF net assets remained largely stable, with the decline in ETH more attributable to on-chain spot and derivatives selling pressure. Regarding stablecoins, from May 25 to June 26, the total supply of major stablecoins decreased by approximately $70 billion, with centralized stablecoins like USDT, USDC, and PYUSD contracting significantly, reflecting tightening market liquidity. However, DAI grew counter-cyclically, suggesting continued support from on-chain lending demand.
- Major coins weakened overall in June. BTC fell from approximately $74,000 to around $60,000, a monthly decline of about 18.4%. This was mainly driven by ETF outflows, stablecoin contraction, diminished institutional confidence, and the high-rate environment. Short-term focus is on resistance at $65,000–$66,000 and support at $58,000–$60,000. ETH performed weaker than BTC, falling about 25% for the month. Key resistance is at $1,700–$1,780, with $1,500 as a crucial support level. SOL was relatively resilient, declining about 9.5% month-on-month. Support at $65–$69 is relatively strong; whether it can reclaim $82–$84 will determine if the trend reverses.
- Market hotspots in June mainly included Strategy's credibility crisis, the Zcash vulnerability, valuation pressure on SpaceX post-IPO, and Warsh's hawkish signals from his first FOMC meeting. Pressure on Strategy stems from BTC falling below its cost basis, preferred stock discounts, minor coin sales, and lawsuits/investigations. The key to recovery lies in whether BTC can return above $75,000. Zcash's privacy pool vulnerability raised concerns about supply credibility. SpaceX faces simultaneous pressure on stocks and bonds due to high valuation and cash flow pressures. Warsh's hawkish stance further suppressed valuations of risk assets like BTC and AI growth stocks.
- Key market focuses for July are threefold: whether the CLARITY Act can surpass the 60-vote threshold in the Senate, whether the June CPI will verify inflation is cooling, and whether the US-Iran MOU can push the Strait of Hormuz from "technical openness" to "commercial openness." If the CLARITY Act cannot advance to a full floor vote in July, the probability of its enactment within the year will drop significantly. On the macro front, falling oil prices may alleviate headline inflation, but core inflation remains stubborn. The July FOMC is highly likely to maintain rates at 3.50%–3.75%. If US-Iran negotiations change, oil price rebounds could re-elevate inflationary pressures.
1. Macro Perspective
The core narrative of the global macro market in June was the intense struggle between two opposing forces within the same timeframe: geopolitical détente temporarily brought down energy costs rapidly, while new Fed Chair Warsh's hawkish debut simultaneously raised expectations for the rate path. These two forces repeatedly pulled at each other, pushing global risk assets into a highly volatile, range-bound pattern.
On the inflation front, the US Bureau of Labor Statistics released May CPI data on June 10, showing a year-over-year increase to 4.2%, the highest in three years. Core CPI was 2.9% YoY, and the energy sub-index had accumulated a 23.5% gain year-to-date. The sustained impact of the Middle East geopolitical conflict on the supply side was fully transmitted to the consumer side. Meanwhile, May PCE data released at the end of June further reinforced inflationary pressures — headline PCE was 4.1% YoY, and core PCE hit a three-year high of 3.4%, with a month-over-month increase of +0.3%. Combined with an upward revision of Q1 GDP to 2.1%, personal income and spending both accelerating by 0.7%, and the savings rate falling to a low of 3.0%, the co-existence of "high inflation + resilient consumption" left the Fed with almost no policy space to cut rates. New York Fed President Williams stated plainly near month-end that inflation was "unambiguously high," pushing back the timeline for achieving the 2% target to 2028 and raising the end-of-2026 inflation forecast to 3.5%. This effectively signaled to the market that the current state of tight policy rates would be more persistent than anyone expected.
On the employment front, May non-farm payrolls, released on June 5, showed an increase of 172,000, far exceeding the market expectation of 80,000. Data for March and April were revised up by a combined 93,000. The unemployment rate remained unchanged at 4.3%. The ISM Manufacturing PMI came in at 54.0, and Services at 54.5, but the prices sub-indices surged to 82.1 and 71.3 respectively. This revealed a stagflationary characteristic of "strong employment + high costs," further blocking any logical path for the Fed to pivot towards easing.
Geopolitically, US-Iran negotiations achieved their most significant historical breakthrough in June. On June 14, Trump announced a Memorandum of Understanding (MOU), which was officially signed on June 19 — Trump signed it during the G7 summit in Versailles, while Iranian President Pezeshkian signed simultaneously in Tehran, ending the military conflict that began on February 28. The agreement framework clearly stipulates: the Strait of Hormuz must remain open, Iran's nuclear program must be completely dismantled, nuclear materials must be removed from the country, and Iran must cease funding regional armed groups. In return, the US committed to gradually unfreezing funds after Iran completes all terms. However, the gap between "technical openness" and "commercial openness" is clear. Even after the agreement was signed, approximately 500 commercial vessels remain stranded inside and outside the Persian Gulf, war risk insurance premiums remain as high as 1%–4% of vessel value, and the shipping industry describes the current situation as "cautiously welcoming." On the oil price front, Brent fell to $78.96, WTI dropped to $76.05, declining over 17% for the month, wiping out all premiums accumulated during the conflict. However, Rystad Energy warns that rebuilding crude production and logistics during a ceasefire negotiation phase takes time, with permanent daily demand destruction potentially between 200,000 and 600,000 barrels. Notably, a drone attack targeting a Singapore-flagged cargo ship occurred near month-end. The International Maritime Organization subsequently suspended the evacuation of commercial vessels in the Persian Gulf, reminding markets that geopolitical risks have not completely disappeared within the 60-day technical negotiation framework.
US stocks overall underwent a "narrative shift" in June. At the beginning of the month, the AI narrative and tech earnings expectations still supported major indices at high levels. However, following the strong May non-farm payrolls and high inflation data, the Nasdaq fell 4.61% in a single week, and the S&P 500 dropped 2.62%, as the discounting pressure on high-valuation growth stocks suddenly intensified. Near month-end, strong earnings from Micron (up 19% intraday) drove the SOX semiconductor index up 3.6%, as capital rotated from large-cap tech stocks upstream into memory, HBM, and optical communications. The market narrative shifted from "AI demand explosion" to "who in the AI supply chain can actually realize profits," intensifying structural divergence within the tech sector. Apple announced it was skipping the high-end M6 Pro/Max roadmap and raising prices across its entire product line, causing its stock to plunge 6.1%. OpenAI delayed its IPO to 2027 to maintain its trillion-dollar valuation. Both point to the same core issue: the market is beginning to question the ROI timeline and valuation rationale of AI investments. Gold lost the $4,000 level under the dual pressure of a strengthening US dollar and rising real interest rates, oscillating near that mark for several days, with its safe-haven appeal marginally diminishing. The 10-year US Treasury yield rose to 4.536%, while the 30-year yield approached 5.0%.
2. Crypto Market Overview
Coin Data Analysis
Trading Volume & Daily Growth Rate
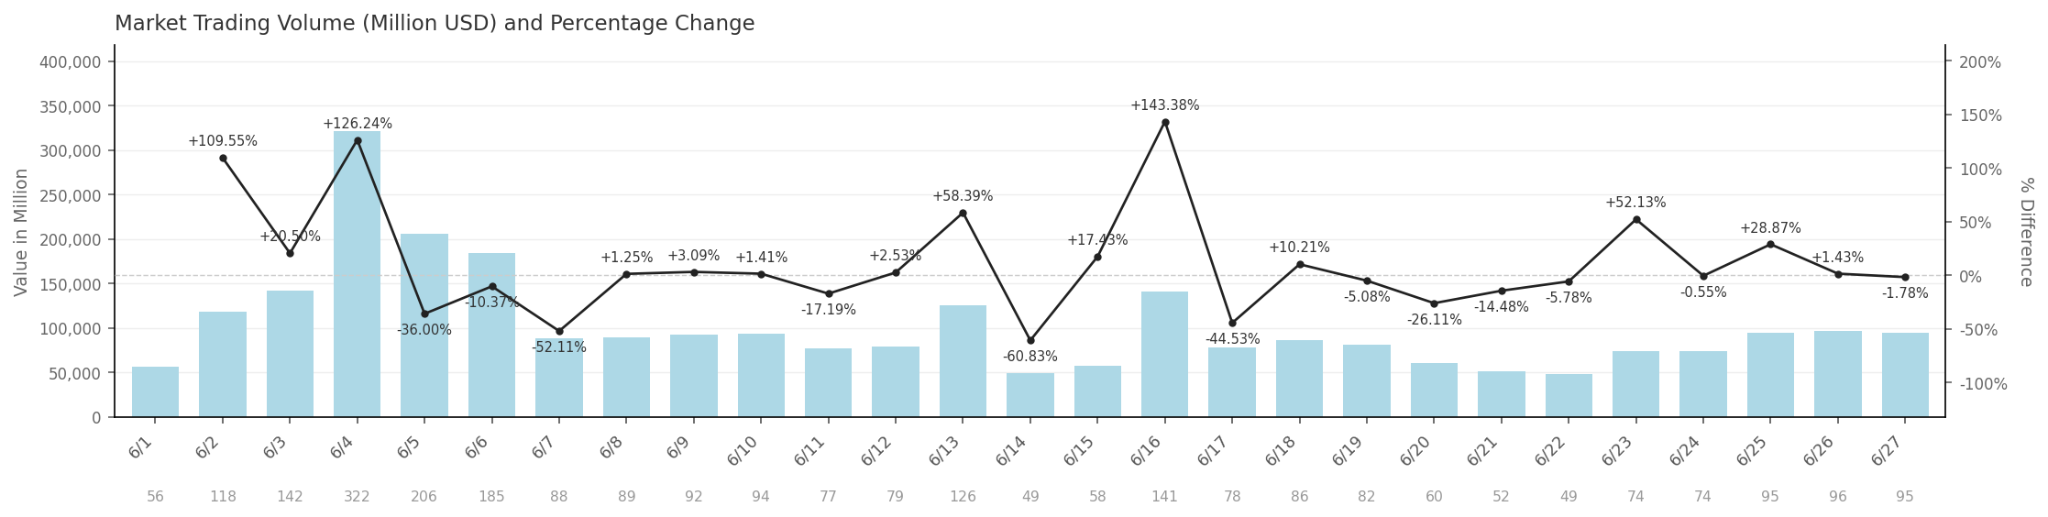
Cryptocurrency market trading volume in June showed an overall pattern of "high opening followed by choppy trading." At the beginning of the month, on June 1, trading volume was only about $56 billion, a relatively low level. However, it surged to a monthly peak of $321.6 billion on June 4, a massive 126.24% increase day-over-day, indicating a strong short-term trading sentiment. Volume then shrank rapidly, falling back to $88.3 billion (-52.11%) by June 7, entering a period of relatively stable low volatility. A second significant volume contraction occurred on June 14, dropping to $49.3 billion (-60.83%), followed by another surge to $140.8 billion (+143.38%) on June 16, forming the second volume peak of the month. Volume generally narrowed in the second half of June, oscillating within a range of $49 billion to $96 billion, and closed at approximately $94.5 billion on June 27. Overall, the two volume surges in June (June 4 and June 16) were characterized as impulsive with weak sustainability, reflecting rapid sentiment ebbing among market participants after short-term event-driven activity. Overall liquidity was not abundant.
Total Market Capitalization & Daily Growth
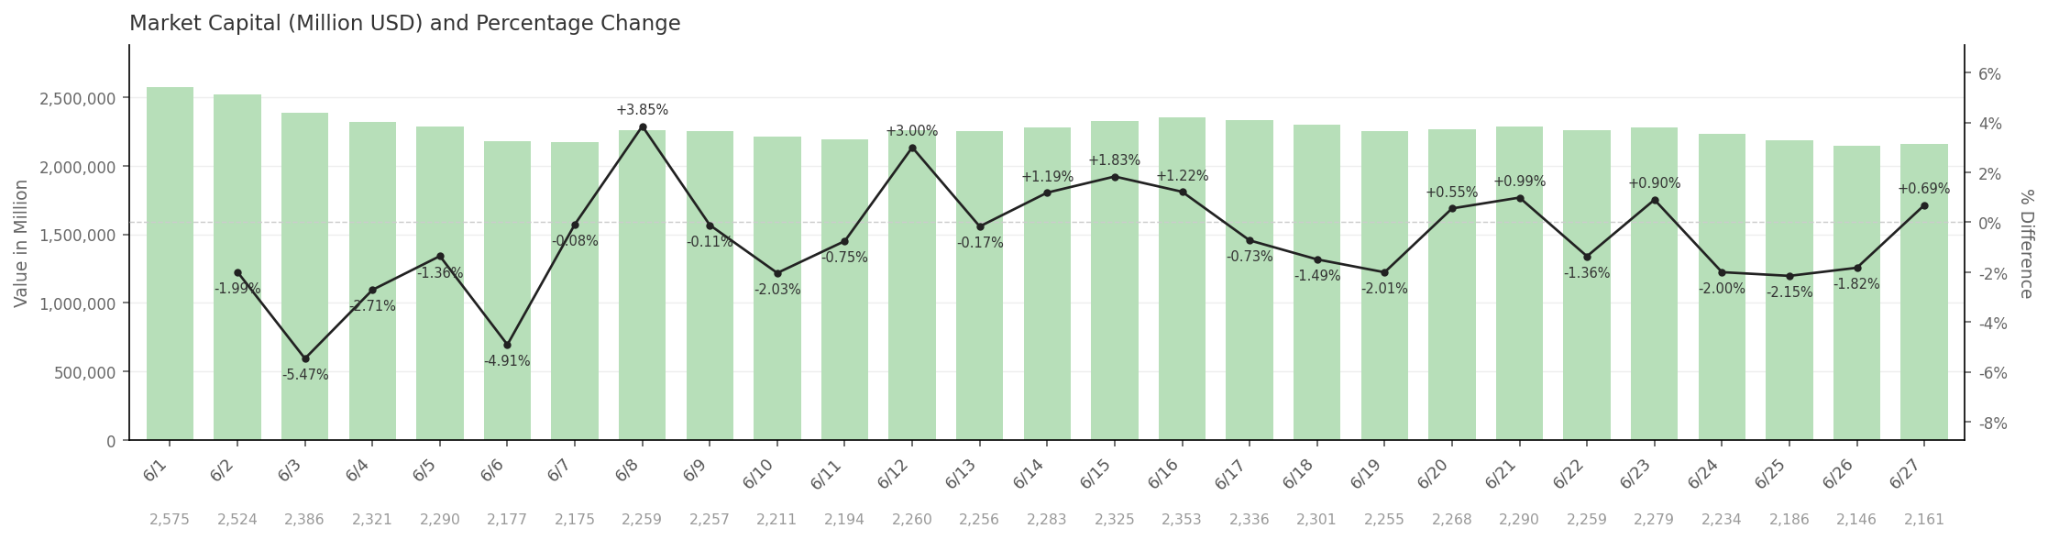
In June, the total cryptocurrency market capitalization showed a clear unilateral downward trend, with a cumulative decline of approximately 16.1% for the month. The market cap started the month at around $2.575 trillion and continued to face downward pressure. The largest single-day declines occurred on June 3 (-5.47%) and June 6 (-4.91%), accelerating the market cap shrinkage. Although there were several brief rebounds, such as on June 8 (+3.85%), June 12 (+3.00%), and consecutive minor recoveries from June 15-16, none were able to reverse the overall downward direction. These rebounds were limited in strength and short-lived. Market cap hit a monthly low of approximately $2.146 trillion on June 26, before recovering slightly to $2.161 trillion (+0.69%) on June 27. The overall trend shows that the market was under significant bearish pressure in June. Buying power was insufficient to support sustained rebounds, with continuous net capital outflows and cautious market sentiment. Whether the slight stabilization at month-end can be sustained remains to be seen.
Hot Tokens in June
 Newly listed tokens in June generally performed poorly. ARX gained high attention due to its Solana ecosystem affiliation, MPC+FHE+ZK tech stack, and the "AI+Privacy Computing" narrative, recording a 24-hour trading volume of $1.3 billion. However, its high valuation also brought significant volatility. RE achieved short-term liquidity driven by its RWA+Reinsurance narrative and listings on multiple exchanges, but high turnover and pullbacks suggest strong speculative characteristics.
3. On-Chain Data Analysis
Analysis of BTC and ETH ETF Inflows/Outflows
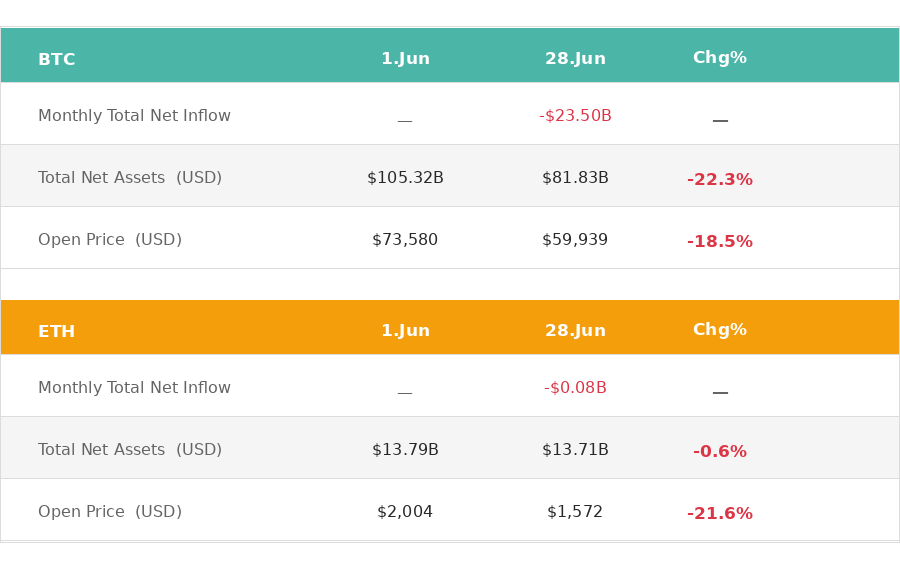
In June, Bitcoin and Ethereum spot ETFs faced pressure overall, but their performances diverged significantly. Total net assets of Bitcoin ETFs shrank substantially from $105.3 billion to $81.8 billion, a decline of 22.3%, corresponding to net outflows of approximately $23.5 billion. Meanwhile, the BTC spot price fell from an opening of $73,580 at the month's start to $59,939 at month-end, a decline of 18.5%. The drop in net assets was significantly larger than the price decline, indicating that besides valuation shrinkage due to price drops, institutional investors also actively redeemed, creating a dual pressure. The large-scale net outflows suggest institutions chose to reduce positions during the downturn rather than buy the dip. Ethereum ETFs were relatively more stable, with total net assets only marginally decreasing from $13.79 billion to $13.71 billion, and net outflows of approximately $0.008 billion were negligible. This shows that ETH ETF holders largely chose to stay put. However, the ETH spot price fell from $2,004 to $1,572 during the same period, a decline of 21.6%, which was actually higher than BTC's. This divergence suggests that the decline in ETH was primarily driven by selling pressure in the on-chain spot and derivatives markets, rather than institutional redemptions at the ETF level. Overall, the crypto market was in a de-risking phase in June. Bitcoin ETFs experienced large-scale capital withdrawals. Although ETH ETFs were relatively stable in terms of capital flows, their price weakness was more pronounced. Neither showed signs of effective capital inflows, and short-term price stabilization still requires improved macro sentiment.
Analysis of Stablecoin Inflows/Outflows
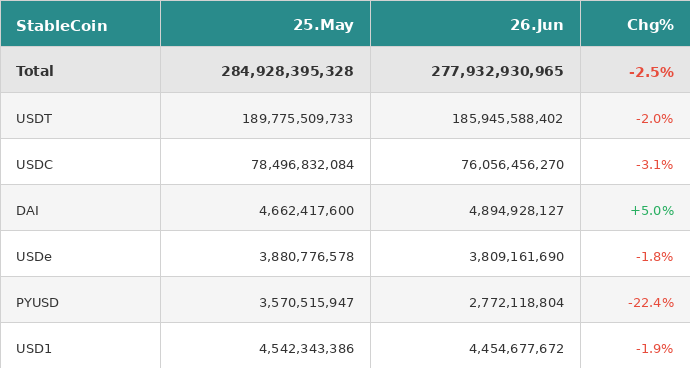
From May 25 to June 26, 2026, the total supply of major stablecoins decreased from approximately $284.9 billion to around $277.9 billion, a month-over-month decrease of about $7 billion (-2.5%). Overall liquidity tightened notably. The supply of the two leading stablecoins, USDT (-2.0%) and USDC (-3.1%), both declined, totaling a decrease of about $6.2 billion. This was the core driver of the aggregate contraction, with USDC experiencing a slightly larger decline, indicating higher withdrawal pressure on regulated stablecoins. PYUSD saw the most significant drop, plummeting from approximately $3.57 billion to about $2.77 billion (-22.4%) within a month. USD1 (-1.9%) and USDe (-1.8%) experienced milder declines, within normal fluctuation ranges. The only one to expand against the trend was DAI, whose supply increased from approximately $4.66 billion to about $4.89 billion (+5.0%). This indicates that activity on decentralized lending protocols rebounded during the period, with increased on-chain collateralized borrowing demand. Overall, the stablecoin market in this phase exhibited a net capital outflow trend. Centralized stablecoins faced significant pressure, while decentralized DAI achieved counter-cyclical growth supported by on-chain demand.
4. Price Analysis of Major Cryptocurrencies
Bitcoin (BTC) Price Analysis
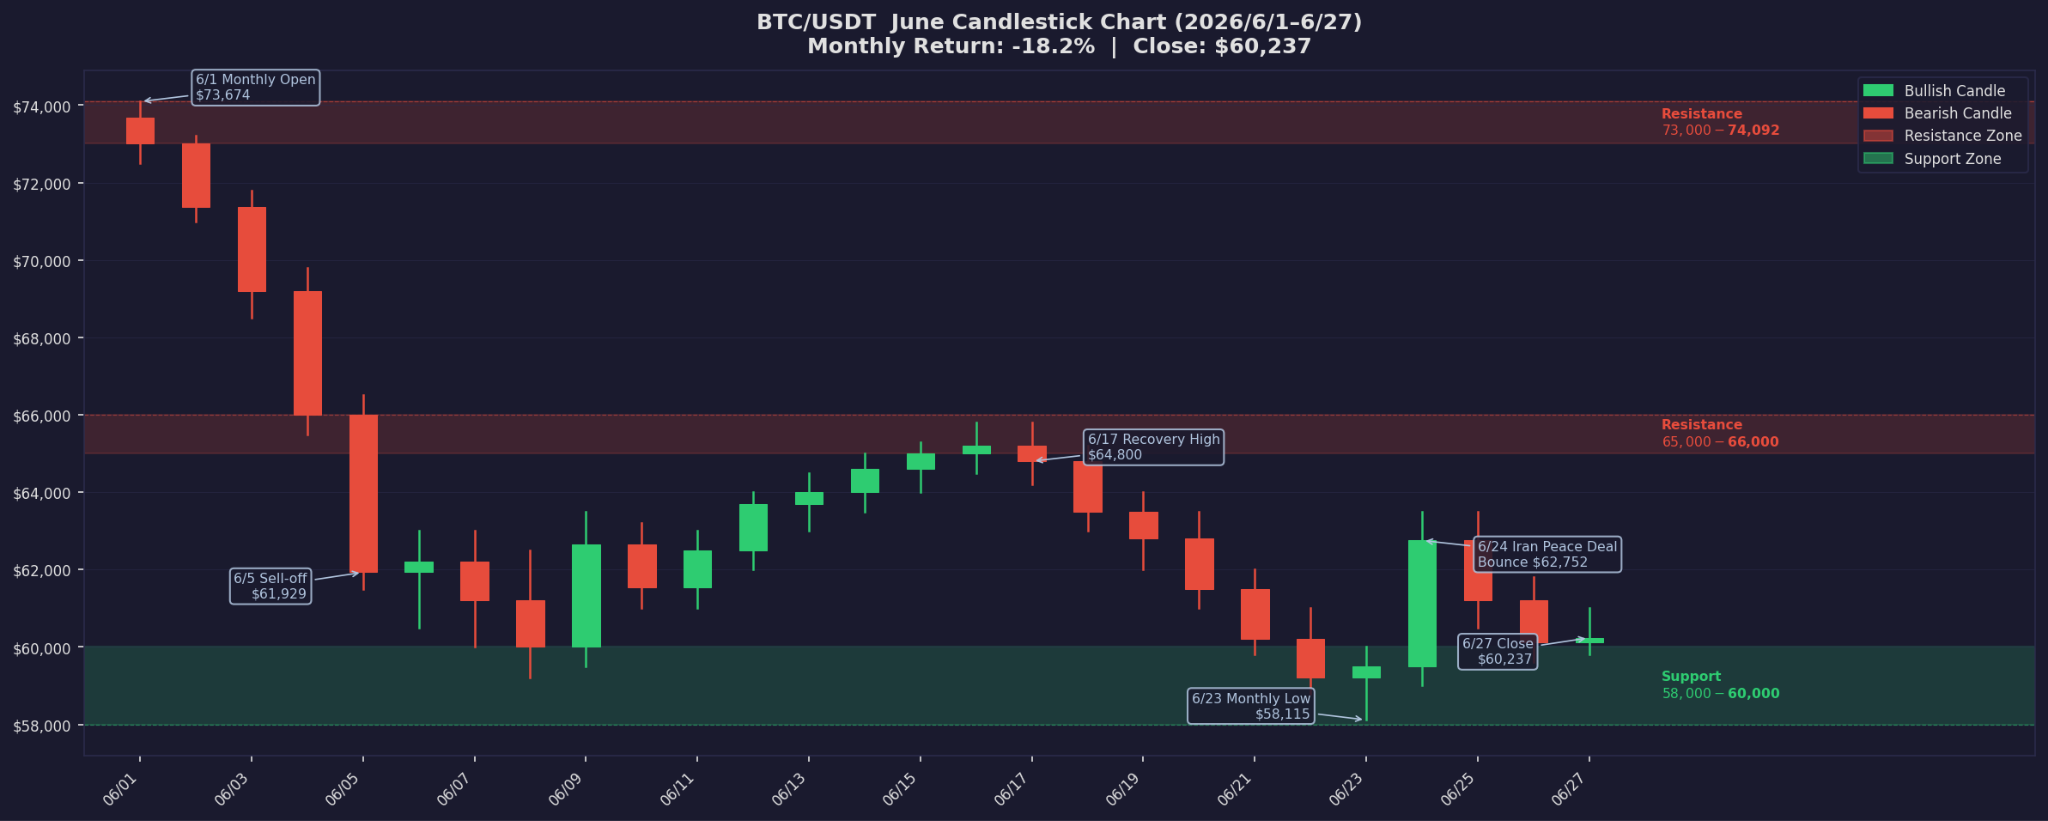
BTC opened June at $73,674 and briefly touched a monthly high of $74,092 at the start. However, bulls failed to hold the advantage, triggering a downtrend that persisted throughout the month. The first week was the most severe in terms of monthly decline — BTC plummeted from around $73,000 to approximately $63,000, a weekly drop of about 14%. The main causes were consecutive ETF outflows, contraction in total stablecoin supply, and shaken institutional confidence triggered by Strategy's rare sale of BTC. These three negative factors converged, systematically dismantling market trust in "institutional buying" and the "corporate treasury narrative." In the second week, the price oscillated in the $62,000–$65,000 range, with a weekly decline of about 4%, performing weaker than the Nasdaq and some AI-related assets. BTC's "digital gold" attribute dimmed significantly in an environment of elevated interest rates and a lack of resumed ETF inflows, instead exhibiting characteristics of a high-beta risk asset. The third week (June 15) saw the largest rebound of the month. The US-Iran interim peace agreement improved risk sentiment, pushing BTC briefly to around $67,000


