






Farewell to Traditional Bull and Bear Markets, Entering the Era of Bubble Rotation


- Core Thesis: The current financial market has shifted from the slow, persistent bull and bear market cycles of the past to a "chain-storm" market structure composed of a series of rapidly rotating, interconnected hot sectors. Investors need to move beyond their obsession with single trend narratives and identify structural changes and cyclical logic from a higher dimension.
- Key Elements:
- Fundamental Shift in Market Structure: Compared to past decades, eight major changes—including the universalization of the speculative crowd, the formation of perpetual buying pressure, the rise of passive investing, and dominance by multi-strategy funds and high-frequency trading—have collectively shaped the current market environment, and this trend is irreversible.
- Market Movement Patterns: Market hotspots are like summer thunderstorms, triggered by specific catalysts and progressing through stages such as "latency, ignition, narrative, divergence, and collapse." Capital flowing out of a fading hotspot acts like a wedge of cold air, igniting a new wave of activity in adjacent sectors.
- Key Structural Factors: Low transaction costs, the price-insensitivity of passive index investing, concentrated market vulnerability due to converging risk management in multi-strategy funds, and zero-lag information dissemination amplify sentiment and trends.
- Investor Class Divergence: The market primarily benefits two types of investors: industry experts with a deep understanding of technical barriers and profit logic, and trend observers who can discern mainstream capital flow patterns and market sentiment.
- Future Themes Continue to Proliferate: Various upstream and downstream segments within fields like AI infrastructure, robotics, cryptocurrency, nuclear fusion, and quantum technology will continue to serve as potential hotspots, providing ample fuel for rotation.
Original Author: Smac, Partner at Compound VC
Original Translation: Saoirse, Foresight News
Editor's Note: As market hotspots emerge in rapid succession, the AI frenzy has taken center stage, leading some to question whether it will follow the same trajectory as the metaverse hype cycle. Amid the market clamor, people are easily swept up by immediate trends, losing sight of long-term trajectories. Rational judgment requires elevating one's perspective. In this article, Compound VC Partner Smac uses a meteorological analogy to dissect the market logic behind the succession of bubbles.
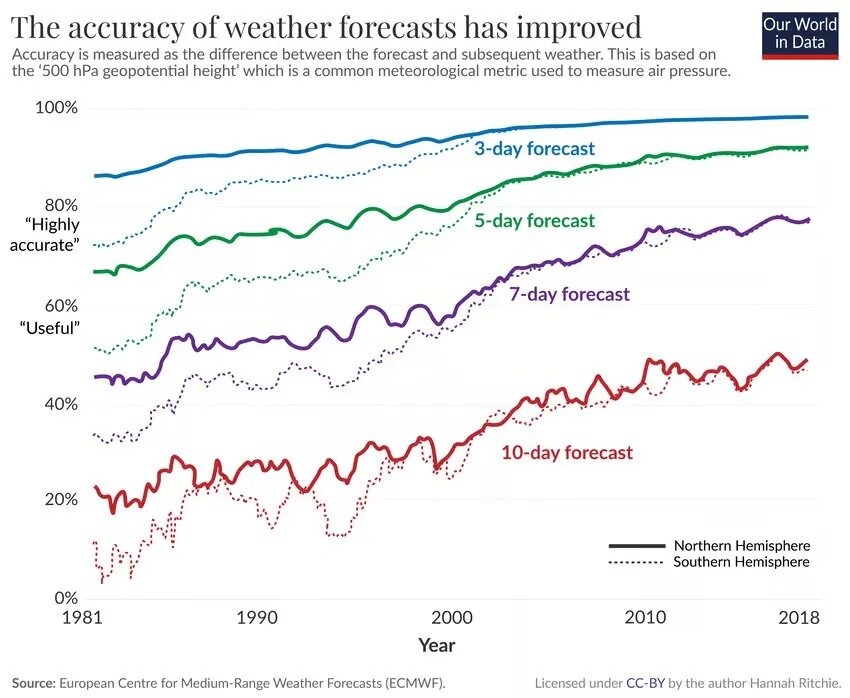
Meteorology is a fascinating field. Over the past fifty years, various weather forecasting tools have iterated continuously, steadily improving the accuracy of weather predictions. Today's five-day forecast is as accurate as a single-day forecast from thirty years ago.
Most people perceive weather as a single, coherent moving system: clouds roll in, it rains, the rain stops, and it clears up. Imagine a winter front approaching; the picture that comes to mind is likely a vast expanse of grey clouds covering hundreds of miles, dumping heavy snow. Meteorologists call this type of weather stratiform precipitation. Simply put, it's like a layered cake; any area under the cloud cover experiences the same weather changes.
But weather isn't just one form. If you've ever seen a summer thunderstorm on the plains, you know its behavior is completely different. First, a single convective cloud forms: warm, moist air near the ground rises, meets colder air aloft, water vapor condenses, and towering, localized cumulonimbus clouds develop. Within an hour, hail, lightning, and torrential rain arrive, dropping visibility to under a hundred meters.
Once the cloud reaches its peak, it releases its full energy and gradually dissipates. The storm's downdraft of cold air spreads outwards at speeds up to 40 miles per hour. When this cold air meets the surrounding warm, moist air that hasn't yet formed a storm, it acts like a wedge, forcing the warm air upward again.
As long as there is enough instability in the atmosphere, this "cold air wedge" will spawn a new convective cloud cluster about a dozen miles from the original storm.
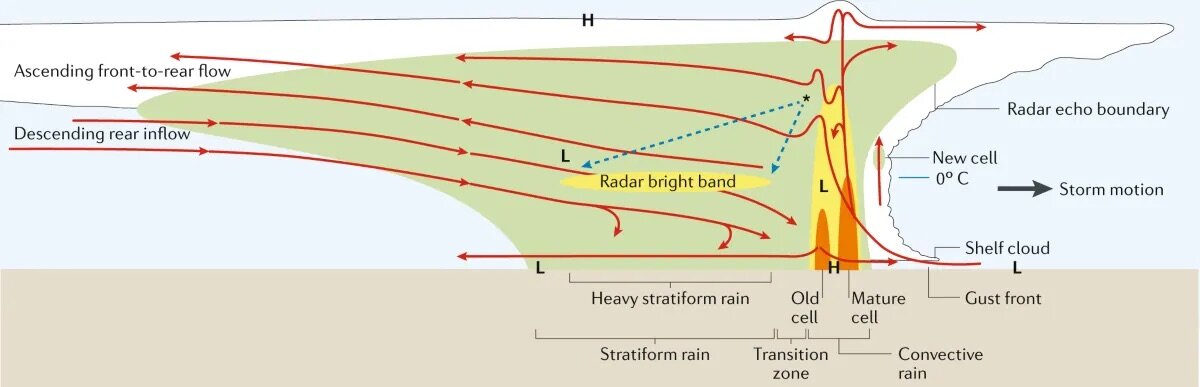
This new cloud cluster couldn't form on its own. Energy was already stored in the atmosphere, but lacked a trigger. The dissipating storm provided exactly that. Then, the new cloud cluster repeats the life cycle of the storm before it.
When multiple convective cloud clusters form in succession, they create a mesoscale convective system. On the ground, people experience each storm individually, believing each one to be the entire weather system. On one side, it's calm, with no hint of the coming rain; on the other side, the sky is already clearing. But from a satellite's perspective, you can see a chain of independent cloud clusters lined up, each at a different stage of development, moving forward until they exhaust the warm, moist air along their path.

A supercell thunderstorm near sunset near Amistad, New Mexico.
This system of successive storms forms under very different conditions than a single weather front. It depends on a specific atmospheric environment:
- Warm, moist air near the surface, the "fuel" for the storms;
- Dry, cold air aloft, promoting continuous updrafts of warm air and creating atmospheric instability;
- Winds changing direction with altitude, causing the storms to rotate and move laterally – this is wind shear.
When all three conditions are met, storms will occur one after another in a chain.
Enough meteorology. Back to the main point: the meteorological phenomenon described above is almost identical to today's financial market conditions.
The past market was like a stratiform weather system: one bull market, one bear market alternating slowly, sector themes rotating gradually, each cycle lasting for years. 1982 to 2000 was a long bull market, followed by the dot-com bubble, and then the housing and credit cycle from 2003 to 2007. These cycles were long and clear. Even if an investor was a few years off in timing, understanding the major trend allowed them to profit in the end.
But today's market is nothing like it used to be. We are in an era of convective storm chain market action: one hot sector after another hits like a storm, and those caught in each one feel it is unstoppable and all-encompassing.
Capital flows out of fading themes and ignites the next wave in an adjacent sector. The pace of market theme rotation has accelerated dramatically: AI infrastructure, GLP-1s (a class of diabetes drugs popular for their weight loss effects, now a hot investment track), stablecoins, quantum technology, nuclear energy, distributed autonomous technologies, robotics, space... Each track sees a complete cycle of hype, attracts a dedicated following, plays out a full narrative arc, and inevitably faces a downturn. The "cold air" spreading from the dissipation of the previous cycle then ignites the next hotspot in a new area.
Refusing to admit that the market has fundamentally changed is self-deception. People love to joke about "this time it's different," but willfully ignoring a permanent transformation in the financial market environment is either intellectual laziness or stubbornly clinging to a fantasy about the old market.
A Market Landscape Unlike Any Before
For a long time after WWII, the rhythm of financial markets was like those slow-moving weather systems. A bull market could last ten, fifteen, or even twenty years. Sector rotation consistently revolved around long-term secular trends.
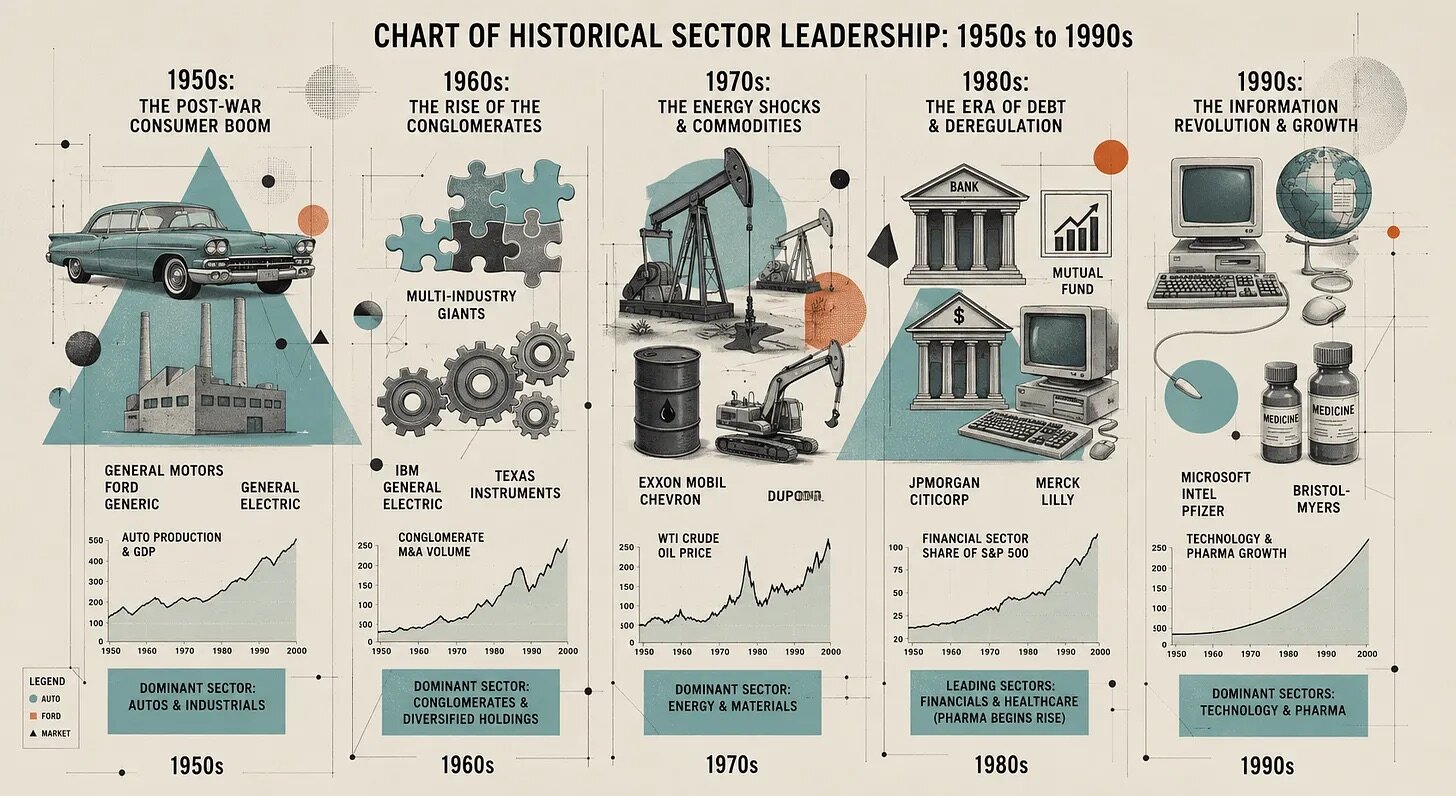
Approximate timeline of industry themes and leading sectors
Back then, sector shifts occurred within a unified macroeconomic environment. Only at landmark turning points did the market structure completely transform, such as the collapse of Bretton Woods, Volcker's anti-inflation policies, the peak of the dot-com bubble, and the Global Financial Crisis.
This market structure was shaped by numerous structural factors: high transaction costs in the past meant low retail participation, forcing long-term holding habits; pensions were the primary vehicle for retirement assets; the S&P 500 was dominated by manufacturing, energy, banking, and retail companies, whose earnings growth roughly tracked GDP, making trends stable and predictable. Simultaneously, information spread slowly; most investors often didn't receive an annual corporate report until weeks after its release.
The past market also had relatively balanced volatility. Bull markets were followed by deep corrections, de-leveraging was gradual, and adjustment cycles were long. Recoveries in bear markets were similarly gradual. The market spent long periods in various emotional zones, with structural shifts often taking quarters or years.
Using the weather analogy: the past market had moderate fuel, strong atmospheric stability, and weak wind shear. Cycles were long and steady, allowing investors to plan calmly. Now, all environmental conditions have changed, some completely reversed, leading to a fundamental transformation of market structure.
Where Did the Change Come From?
Many changes are intertwined, amplifying each other, and any one of them alone would be enough to reshape the market. In summary, there are eight core shifts:
- Democratization of Speculation
- Formation of Perpetual Bid
- Passive Investing Creates Inelastic Counterparties
- Rise of Multi-Strategy Funds and HFT, Disappearance of Market Intermediaries
- Artificially Suppressed Volatility
- Fundamental Change in Index Composition
- Complete Elimination of Information Latency
- Shift in Fiscal and Monetary Environment
Democratization of Speculation
The participants in today's market have visibly changed. In the 1990s, retail trading volume made up only about 10% of total US stock market volume. Due to high commissions, retail investors mostly held individual stocks long-term, with very little active speculation.
Robinhood pioneered zero-commission trading and the payment for order flow model. In the fall of 2019, Schwab followed suit, eliminating trading commissions, and Fidelity, TD Ameritrade, E*Trade, and others quickly followed, completely rewriting industry rules.
The COVID-19 pandemic accelerated this trend: stimulus checks, people stuck at home, and trading apps gamifying the experience. In 2020-2021, retail trading share surged to 25%. Many thought it was a temporary phenomenon, but the high level of retail participation has persisted. On April 29, 2025, during high volatility caused by tariff policies, JPMorgan data showed retail order flow hit a record 48% of total volume. On typical trading days, retail volume is more than double pre-pandemic levels; during major market swings, this share can reach up to 35%.
A deeper change is in the types of instruments retail investors trade. Single-stock options have become a mainstream choice, with 0DTE (Zero Days to Expiration) options exploding in popularity. These new participants are predominantly young, hold highly concentrated portfolios, and chase market themes closely. Crucially, these investors often use special methods to leverage their positions (leverage that doesn't show up in typical margin data), make decisions based more on price action than fundamentals, and are highly susceptible to following others.
In terms of the meteorological theory: the "warm, moist air" near the market's surface is more abundant than ever, with accumulated potential energy at historic highs.
Formation of Perpetual Bid
I've written about this point before. In short, the US retirement system has shifted from defined-benefit pensions to defined-contribution plans. Now, individuals are responsible for their own retirement savings. On the market level, this means every pay cycle brings a massive, price-insensitive, passive flow of money buying stocks, creating an automated perpetual bid.
The logic of traditional pensions was completely different. Defined-benefit pensions had to match liabilities and manage duration risk. Their managers would actively judge market valuations. If they thought stocks were too expensive, they would adjust asset allocation and buy more bonds. Even if their rebalancing was slow, it was far more active than today's purely passive perpetual buying.
This point is crucial: the marginal trading dollar in the market exerts far more influence on prices than ever before.
Passive Investing Creates Inelastic Counterparties
The essence of passive index investing is buying and selling strictly according to index constituent weights, ignoring price. The higher a stock's market cap, the more passive capital flows into it, and vice versa. This mechanism embeds momentum into the market's underlying logic: the stronger an asset performs, the more passive capital it attracts. The stellar performance of the Magnificent Seven tech stocks is largely due to this dynamic.
For years, there have been countless articles analyzing the concentration of index weight in top companies. Of course, these top companies also have strong fundamentals and growth, so this concentration isn't entirely baseless. But the core issue is that passive capital has no natural "stop-profit switch."
Rise of Multi-Strategy Funds and HFT, Disappearance of Market Intermediaries
Alongside the creation of the passive perpetual bid, the active trading world has also seen a major change: the rise of multi-strategy portfolio trading firms. Citadel, Millennium, Point72, Balyasny, and others house hundreds of individual portfolio managers, each responsible for a specific strategy under strict risk constraints. The AUM of these firms has exploded, with capital concentrating at the top, mirroring the concentration trend in stock indices.
Concurrently, high-frequency trading now accounts for 50% to 60% of US stock market volume and up to 75% in futures markets. This combination creates an extremely fragile market environment: firms trade against each other, weakening the price discovery function. A large portion of the volume on the tape is just internal market liquidity reshuffling.
Under normal conditions, this results in tight bid-ask spreads, which is good. But when a themed play breaks down, positioning becomes extremely imbalanced, or multiple firms' risk limits are triggered simultaneously, the market microstructure breaks down instantly. All portfolio managers have highly correlated risk exposures and similar stop-loss rules. When one firm is forced to deleverage, others follow in a cascade. The market crashes in February 2018, August 2019, March 2020, and August 2024 are classic examples. The market structure that breeds these events is now deeply entrenched and will continue to produce them in the future.
Traditional fundamental long/short hedge funds are being squeezed out. These funds rely on deep research, hold 20-40 stocks, and have investment horizons of several quarters. Now, they are either absorbed by larger asset management platforms or transition to private equity, family offices, or single-strategy funds. In my view, understanding theme rotation and having patience amidst short-term capital flows still offers significant potential for generating alpha.
Artificially Suppressed Volatility
Combining the above four points, the current volatility pattern becomes understandable. Data shows that since 1990, the VIX has closed below 20 on two-thirds of trading days. The day-to-day autocorrelation of volatility is as high as 85%, meaning today's level largely predicts tomorrow's.
However, the regime-switching pattern of volatility has become extreme and unbalanced. Extensive research shows that after long periods of suppression, volatility, once it breaches a threshold, explodes violently within just a few days. Conversely, the decline back to low volatility is very slow, often taking weeks.
There are multiple structural reasons: a massive "short volatility" industry has emerged. The popularity of 0DTE options forces market makers' hedging activities to further suppress intraday volatility. The market remains in a calm, low-volatility state for extended periods, allowing risk to accumulate. When tail risk hits, all participants flee simultaneously.
In short, today's volatility distribution is increasingly skewed: long periods of low volatility building pressure, leading to a more intense release of risk.
Fundamental Change in Index Composition
The sixth shift is the composition of stock indices themselves. In 1980, the S&P 500 was dominated by manufacturing firms – industrials, materials, energy, financials, and consumer staples. Their earnings growth roughly tracked GDP, with smooth growth curves. Valuation multiples would reasonably revert to their means. Forecasting Procter & Gamble's earnings even five years out wouldn't involve massive error bars.
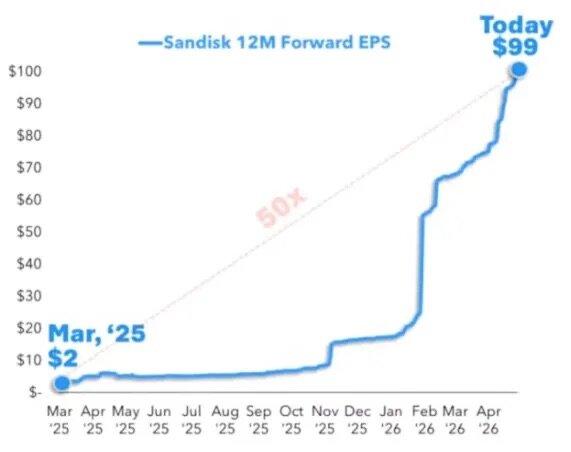
Things are completely different now. Information Technology, Communication Services, and tech-heavy Consumer Discretionary names like Amazon and Tesla together account for over 40% of the S&P 500's weight. The earnings models of these companies are not linear. The marginal distribution cost of software is near zero. And the AI sector is defined by uncertainty – are AI labs the most critical infrastructure of the next half-century, or money-pits with questionable returns? Market opinions are wildly polarized.
For these companies, estimating short-term earnings is hard enough; long-term value is highly variable, leading to significant swings in valuation. Corporate valuation no longer relies solely on financial statements; market narrative becomes a core influence. For investors who can predict the direction of cutting-edge technology, identify competitive moats, and map out future markets, there is significant alpha to be captured here.
Traditional manufacturing companies had gradual capacity expansion, relatively stable DCF model outputs, and valuation multiples that more easily reverted to reasonable ranges. Today, a company's valuation depends heavily on the market's acceptance of its story. I'm not saying traditional valuation is obsolete; this is just the objective reality of today's new-economy firms.
Today's leading indices are filled with these long-duration, narrative-driven companies. The steeper the atmospheric temperature gradient, the more energy is stored. Similarly, the more of these companies there are, the greater the potential kinetic energy in the market, and the more violently it will swing when a trigger is pulled.
Complete Elimination of Information Latency
Everyone feels this, but its impact is often underestimated. For most of financial history, the dissemination of market-relevant information was constrained by distribution channels. Now, information travels almost instantly.
Especially position information, which spreads faster than ever. Investors can see reputable figures reacting to news in real-time, and more people are voluntarily disclosing their holdings. A torrent of real-time information constantly fuels comparison. Profit screenshots are everywhere, stories of turning a few thousand dollars into millions go viral, and fear of missing out (FOMO) is perpetually amplified.
Shift in Fiscal and Monetary Environment
This point needs little elaboration. The core summary is as follows:
- US monetary policy has been biased toward ease for a long time, with low real interest rates;
- Quantitative easing has continuously expanded the Fed's balance sheet;
- Low discount rates have inflated the prices of all long-duration assets;
- Fiscal policy has been active, with various stimulus checks and industry-specific bills;
- Fiscal deficits are at wartime levels despite full employment;
- The economy exhibits a K-shaped divergence, with financial markets decoupling from the real economy.
How Do the Storms Form?
Combining all these changes, the successive market bubbles are an inevitable outcome.


