






Gate Institutional Weekly: BTC Volatility Rises, LST Sector Sees Widespread Decline


- Key Takeaway: Last week, driven by stronger-than-expected U.S. CPI data, a lack of breakthroughs in US-China talks, and heightened tensions in the Strait of Hormuz, market risk appetite dramatically reversed. This caused U.S. stocks to rally and then retreat, with BTC and ETH ETFs recording net outflows of approximately $996 million and $255 million, respectively. The derivatives market entered a deleveraging phase, with BTC funding rates turning negative and protective demand for options increasing, as the market reassesses macro policy paths.
- Key Elements:
- Sharp Macro Shift: The U.S. April CPI rose 3.8% year-over-year, exceeding expectations. The 10-year Treasury yield climbed to 4.58%. Combined with geopolitical risks in the Middle East, risk assets came under pressure.
- ETF Capital Outflows: BTC ETFs saw a net weekly outflow of ~$996 million, and ETH ETFs saw ~$255 million outflow. Institutional capital shifted towards defensive allocations, though overall AUM remains at historically high levels.
- Traditional Finance Dominance: TradFi on-chain and CEX derivatives trading continue to be led by safe-haven assets like gold. The share of equity-related trading rebounded to ~30% following increased U.S. stock market volatility.
- On-Chain Lending Deleveraging: Aave's mainnet lending contracted for the second consecutive week. The LST sector's TVL on the ETH side retreated by ~10%, with capital migrating to new chains like Plasma.
- Derivatives Pricing Risk: BTC funding rates turned from positive to negative, with open interest (OI) falling back to around $25.5B. The 25-delta skew across all tenors was deeply negative, and the DVOL center rose above 41, signaling increased pricing for downside risk.
- Gate Institutional Counter-Trend Growth: Institutional spot market share grew 10% month-over-month. Full-margin lending volume increased by 10%, and core trading system latency was optimized by 91%.
Summary
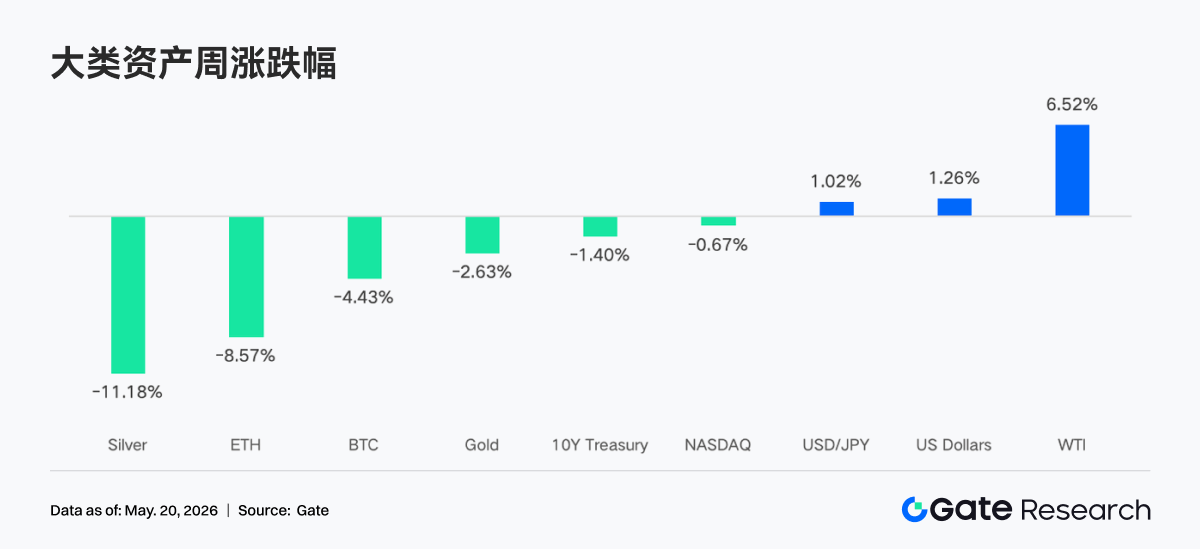
• Last week, the market saw a sharp reversal. The US April CPI exceeded expectations, a lack of substantial breakthroughs in US-China talks, and renewed tensions in the Strait of Hormuz, collectively pushing US bond yields higher and risk assets into a correction. The S&P 500 and Dow Jones, which had hit new all-time highs, experienced a notable decline on Friday, prompting the market to reassess the policy trajectory of the Fed under the Walsh era.
• BTC ETFs saw net outflows of approximately $996 million for the week, while ETH ETFs saw net outflows of about $255 million, both a clear weakening compared to the previous week as institutional funds adopted a phase of defense. However, the overall AUM for both BTC and ETH ETFs remains near historical highs.
• TradFi on-chain and CEX derivatives trading continues to be dominated by safe-haven assets like gold. The higher-than-expected US CPI and geopolitical risks led to increased trading volume in gold-linked perpetual contracts. Concurrently, the share of trading related to equities and tech stocks rebounded, reflecting a stronger macro-driven characteristic.
• On-chain liquidity continues to concentrate on top DEXs like PancakeSwap and Raydium, while volume in deep liquidity pools and stablecoin swap protocols shrunk noticeably. The stablecoin market is leaning towards dollar-denominated assets with stronger attributes of compliance, payments, and banking channels.
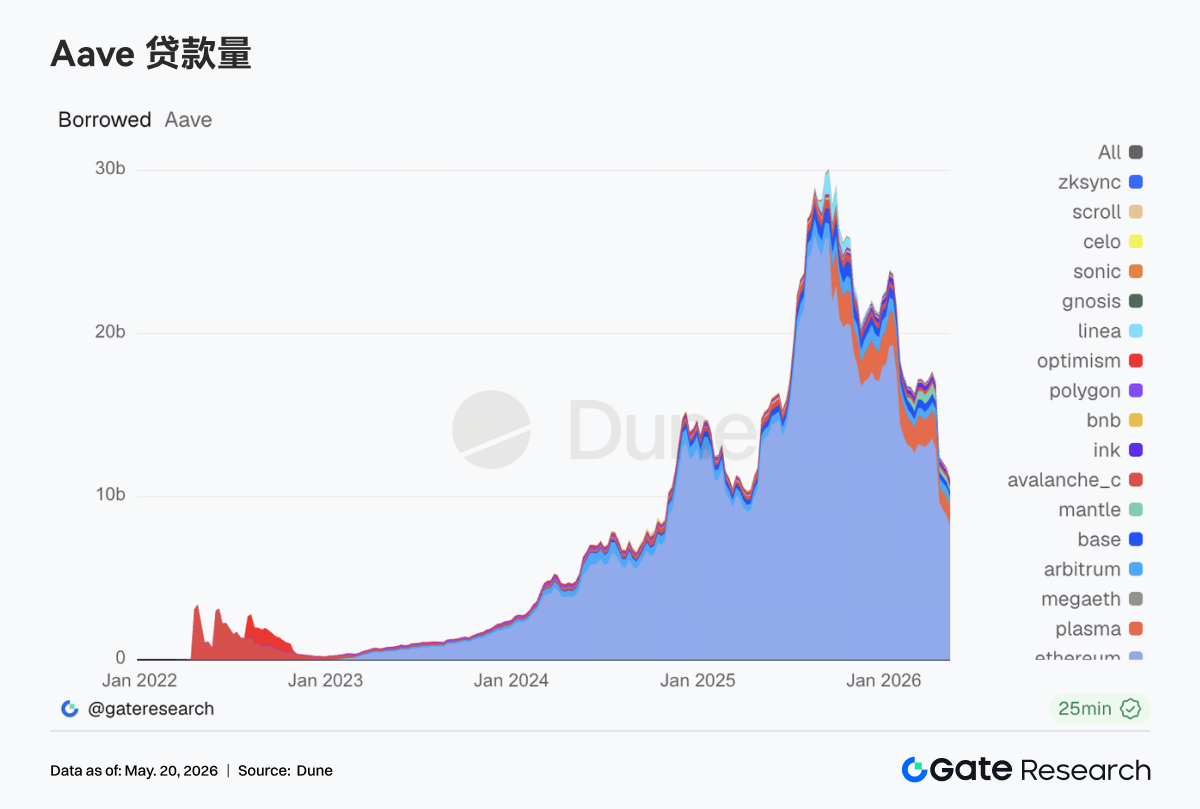
• Borrowing on Aave's mainnet and the LST sector retreated, with demand for leveraged positions on ETH and Solana cooling simultaneously. Meanwhile, new chains like Plasma and MegaETH continued to absorb structural capital migration.
• The derivatives market entered a deleveraging phase. BTC funding rates turned negative, OI continued to decline, the Put volume ratio and 25D Skew both expanded further into negative territory, and the DVOL center of gravity oscillated higher, indicating a significant rise in market pricing for downside risk and volatility.
• Gate's institutional spot market share increased against the trend, rising 10% month-over-month. Cross-margin lending volume grew 10% week-over-week. The Spot SBE launch is expected in June, and order placement/cancellation latency at key CrossEx exchanges dropped from 16.6ms to 1.5ms, a 91% improvement.
1. Market Focus Analysis
The past week saw a dramatic reversal in market conditions, with stronger-than-expected inflation data and heightened policy uncertainty challenging the rally in risk assets. On Thursday, US stocks hit record highs, with the S&P 500 closing above 7,500 points for the first time and the Dow Jones returning to the 50,000-point milestone. However, they gave back significant gains on Friday as markets reassessed the inflation and policy backdrop. First, the April CPI data released Tuesday was stronger than expected, with headline inflation rising 3.8% year-over-year, above the consensus estimate of 3.7% and 0.6% month-over-month. Second, the US-China bilateral talks on Wednesday and Thursday failed to yield substantial policy breakthroughs. Third, geopolitical tensions escalated again, with renewed military conflict in the Strait of Hormuz on Friday, amplifying fears that the de-escalation process could deteriorate.
Interest rate markets reacted sharply. With a significant repricing in federal funds futures and expectations of tighter policy, the 10-year US Treasury yield rose 28 basis points on the week to 4.58%, its highest level since September 2025. The USD/JPY pair continued to climb on the back of a stronger dollar. Markets reduced expectations for easing and began to price in the possibility of further tightening. The Powell era officially ended last Friday, as Jerome Powell's term as Fed Chair concluded on May 15, and Kevin Walsh was sworn in as his successor over the weekend. Walsh will preside over the FOMC meeting on June 16-17, which will release updated Summary of Economic Projections and revised dot plots, providing the market with its first formal look at the policy outlook under Walsh's leadership.
2. Liquidity Analysis
2.1 BTC ETF Scale Continues to Expand
Last week, the BTC ETF market exhibited clear capital outflows. At the start of the week, May 11 still saw net inflows of about $27.2 million, but market sentiment quickly turned negative. May 12 and May 13 recorded significant net outflows of approximately $233.2 million and $630.4 million respectively, indicating concentrated institutional capital flight from risk assets. Overall, last week's cumulative net outflows from Bitcoin ETFs were approximately $995.5 million, close to the $1 billion mark. Compared to net inflows of roughly $623 million in the prior week (May 4 - May 8), there was a clear reversal in market risk appetite, with institutional investors generally favoring profit-taking and phase-based hedging.
The ETH ETF market also faced pressure. Over the past week, ETH ETFs recorded net outflows for multiple consecutive trading days, with cumulative weekly net outflows of approximately $255.2 million, a stark contrast to the roughly $70.49 million in net inflows the week before. This suggests that amidst macroeconomic uncertainty and heightened market volatility, ETH assets were also affected by capital reductions, with overall sentiment weaker than previously expected.
• Aggregate AUM: As of May 14, cumulative net inflows for BTC ETFs had reached approximately $58.63 billion, with an AUM of around $107.75 billion. Cumulative net inflows for ETH ETFs were roughly $11.9 billion, with an AUM of about $13.45 billion. Despite short-term fluctuations in capital flows, the overall scale of ETFs remains near historical highs, indicating no fundamental reversal in institutional allocation demand.
• Institutional Movements: Capital divergence was prominent last week. On the BTC ETF side, BlackRock's IBIT saw net outflows of about $317.1 million for the week, while Morgan Stanley's MSBT bucked the trend with net inflows of about $39.1 million, reflecting some institutions engaging in structural rebalancing and bottom-fishing. On the ETH ETF side, BlackRock's ETHB saw slight net inflows, whereas ETHA experienced relatively large outflows, highlighting market divergence in terms of liquidity, fee structures, and long-term allocation value across different products.
2.2 TradFi Liquidity
• TradFi Perp DEX: Over the past week, the trading structure of TradFi assets on Perp DEXs continued its pattern of "commodities dominance, indices auxiliary, equities recovery." Looking at trading volume share, commodities remained the absolute core, with their overall share generally maintaining in the 45% to 65% range during the week. While slightly lower than the peak period in March-April, they remain the primary source of liquidity for on-chain TradFi derivatives trading. Within this, gold-related assets continued to be the core trading focus, reflecting the market's sustained preference for safe-haven assets and macro themes against the backdrop of persistent inflation, rising geopolitical risks, and fluctuating US interest rate expectations. Meanwhile, the share of equity-linked assets rebounded significantly over the past week, rising from below 10% to nearly 30%. This indicates that with the renewed expansion of US stock market volatility, on-chain user demand for trading tech stocks, US equity indices, and AI-related concepts has picked up. The current on-chain TradFi Perp user base remains dominated by crypto-native traders with a preference for high volatility and high leverage, rather than a wholesale migration of traditional macro capital.
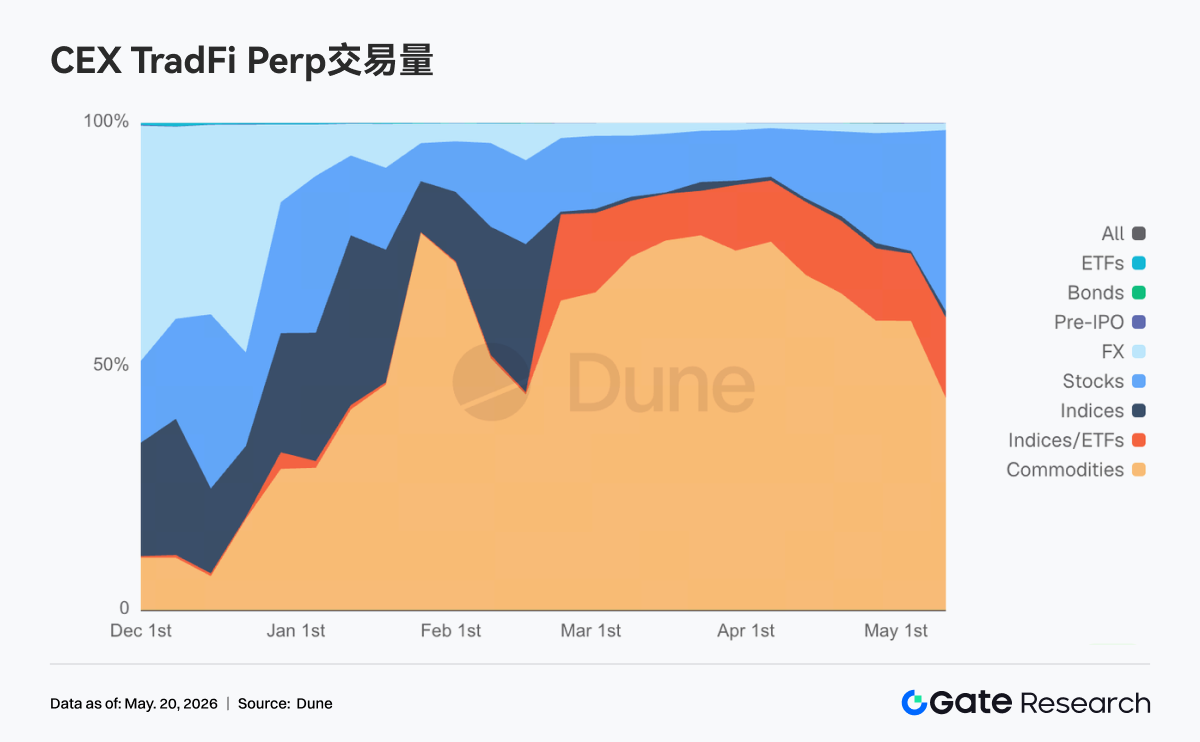
• TradFi Perp CEX: Last week, overall trading activity in the CEX TradFi perpetual contracts market remained high, but the structure showed a clear characteristic of "precious metals dominance, equities auxiliary, low activity in other sectors." Based on the daily volume distribution for TradFi Perps, assets in the Metals category like gold continued to hold the absolute core position. On most trading days, volume remained in the $300 million to $700 million range, occasionally exceeding $1 billion during volatile periods. Notably, there was a phase in mid-to-late March with peak volumes over $1.5 billion. While overall volume last week decreased from those earlier extremes, it remained significantly higher than early February levels, indicating robust demand for safe-haven and macro trading. Regarding the pace, volume showed a clear increase in the second week of May, especially against the backdrop of higher-than-expected US CPI, escalating Middle East geopolitical risks, and fluctuating USD rate expectations, with gold-related perpetuals becoming the primary trading direction for capital. Concurrently, trading in equity-linked assets also rebounded, more reflective of short-term trading demand stemming from volatility in US equity indices and tech stocks. Overall, the current CEX TradFi Perp market has gradually shifted from a purely crypto beta trading focus to a stronger macro-driven, cross-asset allocation logic.
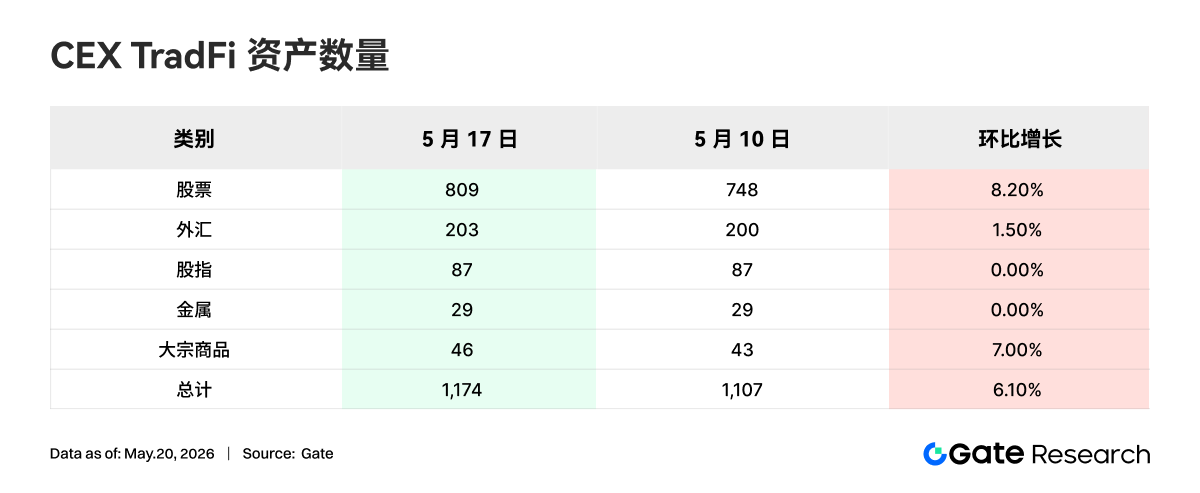
• Number of CEX TradFi Assets: The number of TradFi asset categories on CEXs expanded further in the past week. The total number of TradFi assets (counting only TradFi and CFD sectors, excluding perpetuals) across three major CEXs increased from 1,107 to 1,174, a month-over-month increase of 6.10%. Equities saw the most significant growth, rising from 748 to 809, a month-over-month increase of 8.20%. Among the three CEXs, Gate recorded the highest growth rate, with its equity TradFi category increasing by 62, or 16.71% month-over-month.
• TradFi Order Book Depth: We selected XAUT, the TradFi asset with the highest trading volume, for order book depth (Delta) analysis. Last week, liquidity in the XAUT order book exhibited a clear characteristic of "initial phased inflow of safe-haven capital followed by weakening." Between May 6 and May 12, XAUT's price oscillated near the $4,700 high level, accompanied by multiple instances of significant positive Delta inflows. Particularly around May 12, there was a net liquidity increase close to $2.8 million, suggesting that amidst higher-than-expected US CPI and escalating Middle East geopolitical risks, capital briefly concentrated in gold-related assets for safe-haven allocation. However, after May 13, the market structure reversed sharply. The order book experienced consecutive large negative Deltas, with single-day outflows exceeding $2 million. XAUT's price concurrently broke below $4,650 and fell back to the $4,520-4,550 range, reflecting that early safe-haven capital began to take profits in phases. Notably, between May 15 and May 17, despite the continued price weakness, the order book showed a succession of moderate positive Delta accumulations, indicating some capital attempting to buy the dip. The market hasn't entered a unilateral liquidity withdrawal phase. Overall, XAUT currently appears to be in a "high-level rebalancing phase after the cooling of safe-haven sentiment." Short-term trends will remain highly dependent on macro variables such as Fed rate cut expectations, the dollar interest rate path, and the situation in the Strait of Hormuz.
3. On-Chain Data Insights
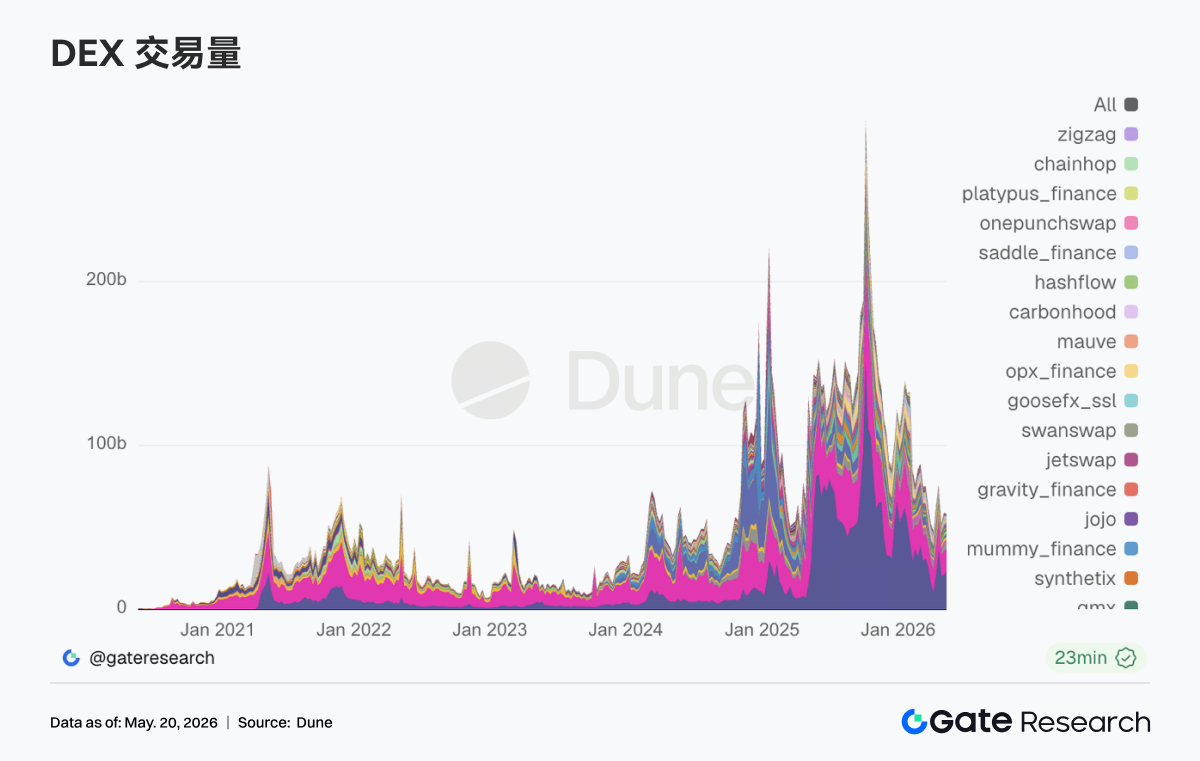
3.1 Leading DEX Volume Concentrates on PancakeSwap, but Vertical Protocol Divergence Intensifies
PancakeSwap experienced about a 12% increase compared to last week, with the BNB chain side being the main battleground for institutional and retail spot trading volume. Uniswap saw about a 7% decline compared to last week. Aerodrome on Base grew about +3% week-over-week. Solana side activity remains, with the structure leaning towards high transaction counts and medium dollar volumes. Raydium saw an increase of about $1.26 billion compared to last week, while Meteora was roughly flat. The high number of on-chain transactions suggests that Meme and routing-type trades haven't completely died down. Vertically focused DEX protocols for deep liquidity and stablecoin swaps, such as Fluid and Curve, saw a significant volume decrease this week.
3.2 Compliant and Payment Stablecoins Perform Relatively Well; Synthetic Dollar Variants Show Increased Volatility
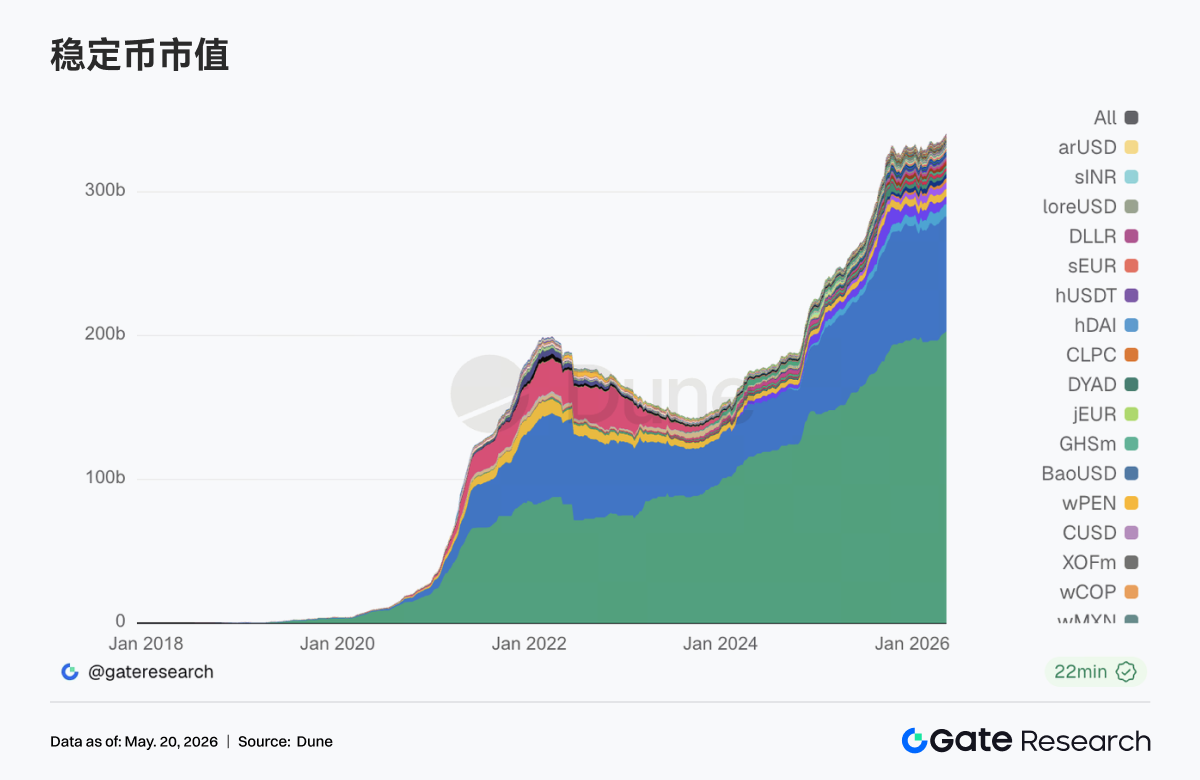
With USDT and USDC dominating, second-tier stablecoins like PYUSD, RLUSD, EURC, and USDG—which are closely tied to payments, custodial compliance, and banking channels—are outperforming older on-chain dollar stablecoins like DAI in terms of growth rate. USDe saw significant expansion this week, reflecting demand for yield-bearing and synthetic dollars in volatile markets for arbitrage and staking, particularly cross-network deployment. Furthermore, following the enactment of the GENIUS Act, institutional capital expenditure on stablecoin infrastructure has noticeably accelerated. Institutions like Bitwise have publicly stated that GENIUS reduces regulatory uncertainty for stablecoins and tokenization projects, positioning subsequent market structure legislation like the Clarity Act as a key variable for growth.
3.3 Broad LST Sector Retreats, Solana-Based Assets Fall Deeper
On the ETH side, LST protocols like Lido, Rocket Pool, and StakeWise all recorded mid-to-high single-digit to approximately 10% TVL drawdowns, reflecting the simultaneous contraction of staking tokens and ETH during the beta downturn. On the Solana side, high-beta LSTs like jupSOL and Sanctum saw even deeper declines, as capital prioritized reducing high-volatility staking exposure when risk appetite fell. Overall, LSTs remain a slow-moving tool for long-term ETH/SOL allocation. However, during this past week of deleveraging, the leading Ethereum protocol, by virtue of its scale and liquidity, still showed slightly better drawdown resilience compared to smaller-cap LSTs.
3.4 Aave Mainnet Lending Continues to Contract; Plasma / MegaETH Absorb Structural Migration
The Ethereum main market remains the absolute core but has shrunk for the second consecutive week. This suggests that after the rsETH-related risk event in April, institutions and whales remain cautious in the mainnet collateral market. Concurrently, older L2 powers like Arbitrum and Ink weakened in tandem. Relatively bright spots are found in Plasma and MegaETH. Capital continues to migrate towards incentives on new chains and closed-loop collateral scenarios. This aligns with the recent direction of Aave's risk team, which has been increasing caps on new assets. The growth engine is shifting from mainnet leverage expansion to stablecoins with clearer regulatory attributes and closed loops on new chains.
3.5 Aave Core Borrowing Rates Return to Normal; WETH Leverage Retreat is Most Pronounced
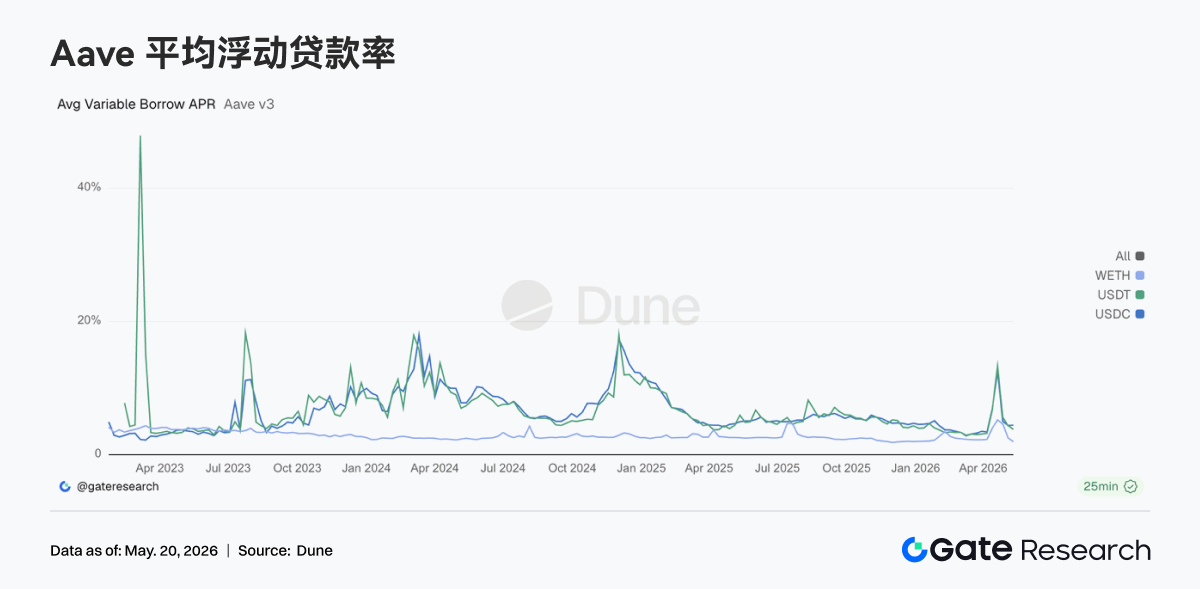
Stablecoin borrowing costs returned to the mid-single digits, reflecting eased liquidity stress and receding liquidation waves. WETH saw the most significant decline, corroborating the rapid decline in ETH leverage demand and the decline in mainnet lending stock. Market behavior shifted from scrambling for liquidity and maintaining positions to selectively borrowing stablecoins. The stablecoin side still benefits from structured arbitrage, cross-border dollar demand, and new chain incentive mining; the ETH side is actively deleveraging. This also explains why the protocol layer is more willing to raise caps on compliant stablecoins and new chain dollars, rather than simply stimulating WETH loop lending.
3.6 Stablecoin Issuance is the Ballast; Hyperliquid Expands Event Contract Trading
Tether and Circle contribute the most stable cash flows, consistent with the dominant role of existing dollar stablecoins. Circle is enhancing vertical integration among issuers, settlement chains, and agent payments through the Arc financing and Agent Stack. Hyperliquid's revenue decreased slightly month-over-month, but its absolute value still places it in the top tier of on-chain derivatives. It continues to expand product lines like Bitcoin outcome markets, with the market still paying for a comprehensive financial stack comprising perpetuals, prediction/outcome markets, and validator/reserve narratives. Aave's revenue this week declined notably compared to last week, coinciding with a contraction in lending stock and normalization of interest rates, i.e., a decrease in risk premiums but also fewer active borrowers.
4. Derivatives Tracking
4.1 BTC Funding Rate Turns Negative; OI Decline Suggests Rising Deleveraging Pressure
From May 11 to May 17, 2026, BTC's price showed an overall spike-and-dip pattern. At the start of the week, prices remained around 81K. From May 11 to May 13, funding rates were mostly in slight positive territory, indicating some sustained long-side sentiment. However, prices failed to break higher, quickly weakening after May 14 and falling back to around 77K by May 17, shifting the market from high-level consolidation to a retracement adjustment.
Regarding OI, the week showed a general downward trend. Around May 11, OI was near 26.8B. It


