
Gate Research: Liquidity Evolution and Trading Strategies for Crypto Leveraged ETFs
- Core Thesis: The introduction of crypto ETFs has injected institutional-grade liquidity into the market, reducing the volatility of mainstream assets like Bitcoin. In this context, leveraged ETFs on centralized exchanges have emerged as a high-leverage tool without margin requirements. By employing trading strategies centered on "right-side entry" and volume-driven momentum breakouts, it is possible to control volatility decay while achieving a dynamic balance between risk and returns.
- Key Elements:
- ETFs curb price deviations through the Authorized Participant (AP) arbitrage mechanism. The entry of institutional capital (e.g., BlackRock's IBIT) has altered market structure, lowering Bitcoin's volatility center and compressing maximum drawdowns from historical 70-80% to within 50%.
- The core difference between crypto leveraged ETFs and traditional leveraged ETFs lies in the "volatility decay" caused by their daily rebalancing mechanism, creating a non-linear compound interest relationship. In a highly volatile, choppy market where the underlying asset's price remains unchanged, the net asset value (NAV) of a 5x leveraged ETF could plummet by over 90%.
- Crypto leveraged ETFs are most suitable for one-sided trending markets. The optimal holding period is 1-5 days and should not exceed one month. When the daily asset volatility reaches 4%, the theoretical decay of a 5x ETF over 20 days can be as high as 40%.
- Based on Gate MCP data analysis, 5x leveraged products (e.g., XRP5L, SOL5L, ETH5S) offer excellent liquidity, making them the preferred choice for strategies. The 90-day correlation coefficient between ETH5S and ETH spot remains stable between -0.91 and -0.97, making it a reliable hedging tool.
- The strategy framework centers on "right-side entry," combining a triple resonance signal: technical breakdown (e.g., daily price closing below the 20-day moving average with a 2% deviation), sentiment volatility (rising 7-day volatility), and a shift in contract capital (perpetual funding rate positive for 3 consecutive days).
- The exit mechanism employs a time-based stop-loss (single position holding not exceeding 5 days) and a trailing take-profit (reduce position by 50% when profit reaches 20% and move the take-profit level up), to control volatility decay and avoid the self-consumption of NAV from long-term holding.
- Backtesting of the ETH5S momentum breakout strategy shows that, based on signals of trading volume breaking above the 20-day average by 3x and price breaking a trendline, the win rate is approximately 67% with an expected return ratio of about 1.2:1. Combined with a 15-20% position limit and a -15% stop-loss, it can achieve positive expected returns.
This report delves into the evolution of liquidity in the crypto ETF market, its profound impact on the volatility of underlying assets, and the mechanisms and usage scenarios of leveraged ETFs. Additionally, it provides a detailed comparison between leveraged ETFs in the crypto market and those in traditional financial markets. Based on real-time trading data from Gate, practical trading strategies are constructed. These strategies center on "right-side entry," supplemented by volume-driven momentum breakout signals to generate excess returns. Through phased position building, momentum-based position adding, and strict exit mechanisms, the strategies achieve a dynamic balance between risk and return while controlling volatility decay.
1. Introduction: Amidst the Development of Crypto ETFs, Who is Actually Buying?
The early crypto market resembled a series of fragmented private transactions, relying primarily on over-the-counter (OTC) matching. Liquidity was highly dispersed, bid-ask spreads were enormous, and even a moderately large order could trigger violent price swings. With the advent of derivatives markets, particularly the introduction of short-selling mechanisms and the popularization of basis arbitrage strategies, price discovery in the crypto market became more efficient, and bid-ask spreads narrowed significantly. Perpetual swaps on centralized exchanges, in particular, led to an explosive expansion in trading volume.
The catalyst that truly brought the market into the mainstream was the listing of crypto spot ETFs. ETFs introduced a key player – the Authorized Participant (AP). They act as market regulators: when the ETF price is above its net asset value (NAV), APs create shares and sell them on the market, suppressing the premium; conversely, when the price is below NAV, they redeem shares. This arbitrage mechanism not only nearly eliminates ETF premiums and discounts but, more importantly, injects institutional-grade deep liquidity into the entire market continuously.
Take BlackRock's IBIT as an example. It took only 47 trading days since its listing to surpass $10 billion in assets under management. In comparison, the gold ETF GLD, which previously held the record for the fastest growth, took nearly three years to reach the same scale. In 2025, a breakout year for Treasury strategies (DAT), the capital absorbed by all newly issued spot crypto ETFs and crypto asset treasuries accounted for over 12% of the total circulating market supply. This proportion signifies that institutional holdings have transformed from a negligible factor into a critical force capable of influencing market supply and demand.
As the dominant players in the market shift from high-frequency traders and crypto-native users to institutions, the market's rhythm subtly changes. Traditional financial theory offers two opposing hypotheses regarding the impact of ETF introduction: one suggests that the ETF "arbitrage transmission mechanism" smoothens the volatility of the underlying asset, while the other worries that ETF scale expansion amplifies market co-movement and herding behavior through a "common ownership effect."
However, empirical data from the crypto market reveals a dynamic mechanism more complex than either hypothesis suggests. Using Bitcoin as an example, we can divide its volatility history into three distinct periods and compare them using the objective metric of Realized Volatility (RV).
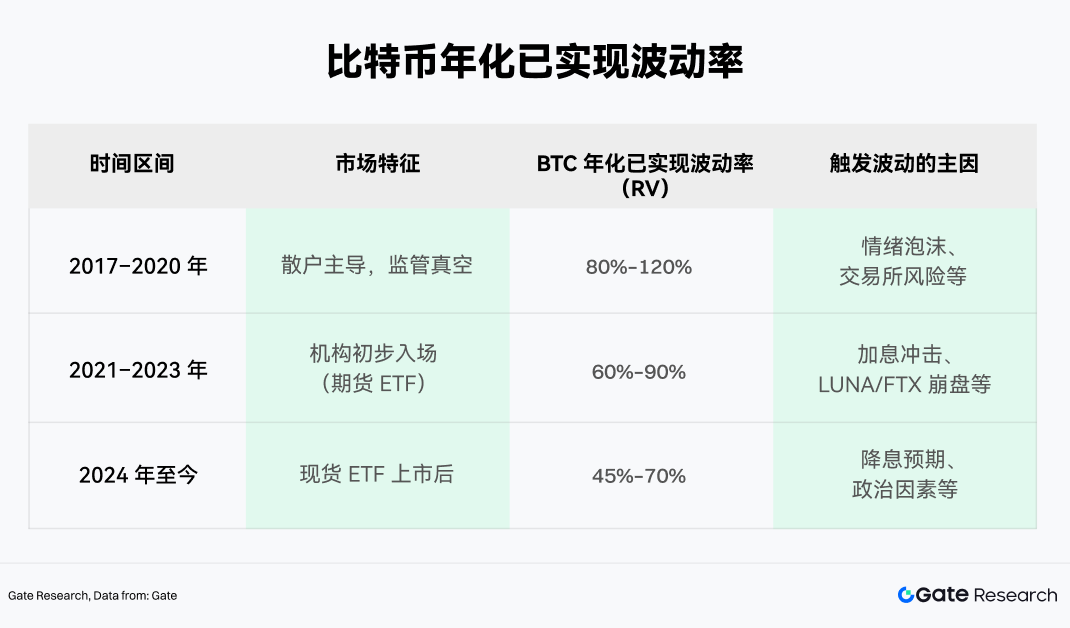
Data shows that since 2024, the median of Bitcoin's annualized realized volatility has trended downwards. Although its absolute value remains high compared to equity markets, the peaks of volatility have been significantly suppressed. The mechanism behind this is the persistent presence of ETF arbitrage capital. Arbitrage funds enable faster mean reversion from extreme price deviations, while quarterly inflows of institutional capital provide periodic support for prices.
Concurrently, Bitcoin spot ETFs have a visibly buffering effect against extreme volatility. In the market cycle from 2022 to early 2026, Bitcoin's maximum drawdown from peak to trough never exceeded 50%, a stark contrast to historical plunges of 70% to 80%. This volatility contraction effectively locks long-term, price-insensitive capital into the market via ETFs. When retail panic triggers selling, the ETF holdings held by institutions act as a "liquidity backstop," effectively absorbing the selling pressure.
2. Analysis of Mechanisms and Characteristics of Crypto Leveraged ETFs
With arbitrage capital and institutional allocation becoming the market's main forces, overall market volatility has indeed converged. Interestingly, this stability itself paves the way for more complex financial structures – especially when market risk appetite increases and capital seeks higher return elasticity, simple spot exposure becomes insufficient. Thus, leveraged ETFs, marketed for amplifying returns and volatility, entered the radar of crypto market investors.
Since the approval of the first Bitcoin leveraged ETF in 2023, this sector has accelerated. Current leveraged products can be broadly categorized into two camps:
• SEC-regulated compliant ETFs, such as those issued by ProShares and Volatility Shares.
• Leveraged tokens issued by centralized exchanges (CEX), such as ETH5S and BTC3L.
In the compliant leveraged ETF space, BITX (Volatility Shares' 2x Bitcoin ETF) currently holds the top position with an AUM of nearly $969 million. However, its expense ratio is also high at 2.38%. ProShares' BITU (also a 2x Bitcoin ETF) has an expense ratio of 0.98% and an AUM of approximately $422 million.
It is worth noting that leveraged tokens issued by CEXs have also begun to emerge in recent years, gradually gaining market attention. Compared to traditional ETFs, they offer structural advantages such as no margin requirements, no liquidation risk, and the ability to trade directly as spot assets. Furthermore, their trading hours, listing speed, and strategic flexibility are more aligned with the needs of crypto-native users, making them an important tool connecting high-frequency trading and risk hedging.
2.1 Core Differences Between Crypto Leveraged ETFs and Traditional Financial Leveraged ETFs
Despite similar operational mechanisms, the unique characteristics of crypto assets expose crypto leveraged ETFs to distinctly different risk profiles compared to traditional products.
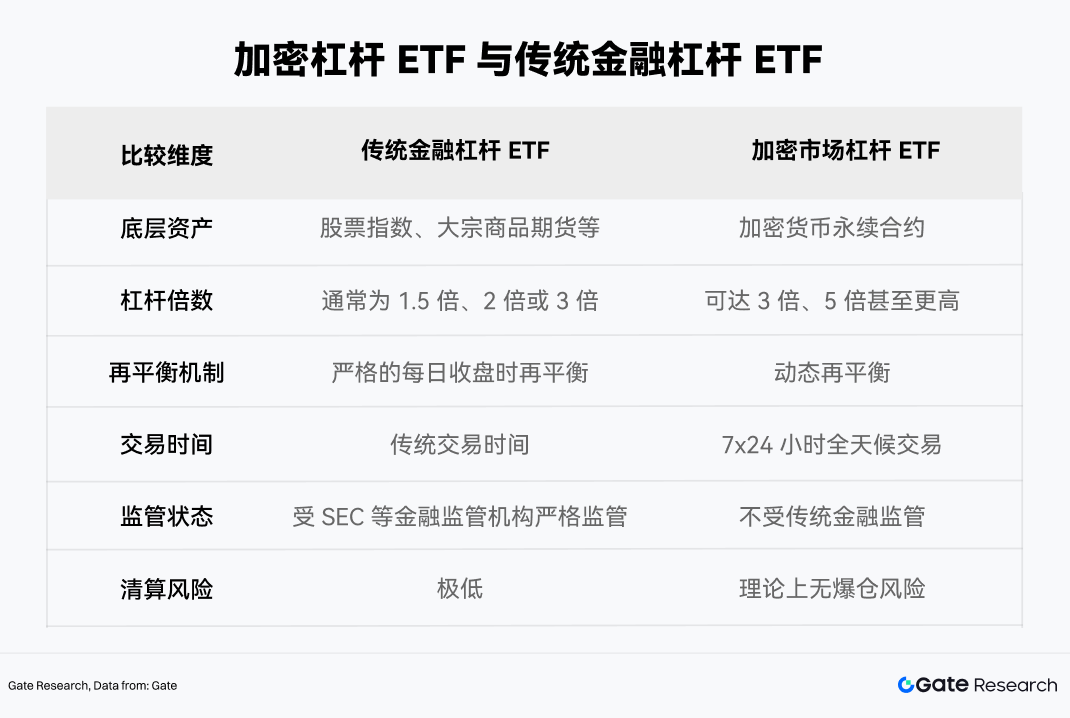
While both rely on rebalancing and derivative positions structurally to achieve leverage, the 24/7 trading, high volatility, and weaker regulatory environment of the crypto market cause the risks of crypto leveraged ETFs to exhibit stronger non-linearity and tail amplification effects. Furthermore, compared to traditional leveraged ETFs, crypto leveraged ETFs are more prone to net asset value erosion due to "volatility decay" during sustained trending markets, and can even see their NAV go to zero in extreme scenarios.
2.2 Daily Rebalancing Mechanism and "Volatility Decay"
The "daily reset" feature is the most significant difference between leveraged ETFs and ordinary leverage. To ensure the fund precisely provides a multiple of the underlying asset's exposure at the start of each trading day, it must undergo daily rebalancing.
Many investors fall into the misconception that "if the underlying asset rises 10%, a 2x ETF rises 20%." While this holds true for a single day, the relationship becomes non-linear over multiple days due to the compounding effect of daily rebalancing.
Specifically, if Bitcoin rises on day T, the 2x ETF's NAV increases, causing the total exposure ratio to fall below 2x. The fund must then "buy high" before the T+1 open, purchasing more Swaps or futures contracts. Conversely, if it falls on day T, the fund must "sell low" to reduce positions. This mechanical "buy high, sell low" behavior is the root cause of NAV decay in choppy, range-bound markets.
Assume the underlying asset rises 10% on the first day and falls 9.09% on the second (returning exactly to its starting point):
• Underlying Asset: $100 × 1.10 × 0.9091 = $100 (0% return)
• 2x ETF: $100 × 1.20 × 0.8182 = $98.18 (-1.82% loss)
• 3x ETF: $100 × 1.30 × 0.7273 = $94.55 (-5.45% loss)
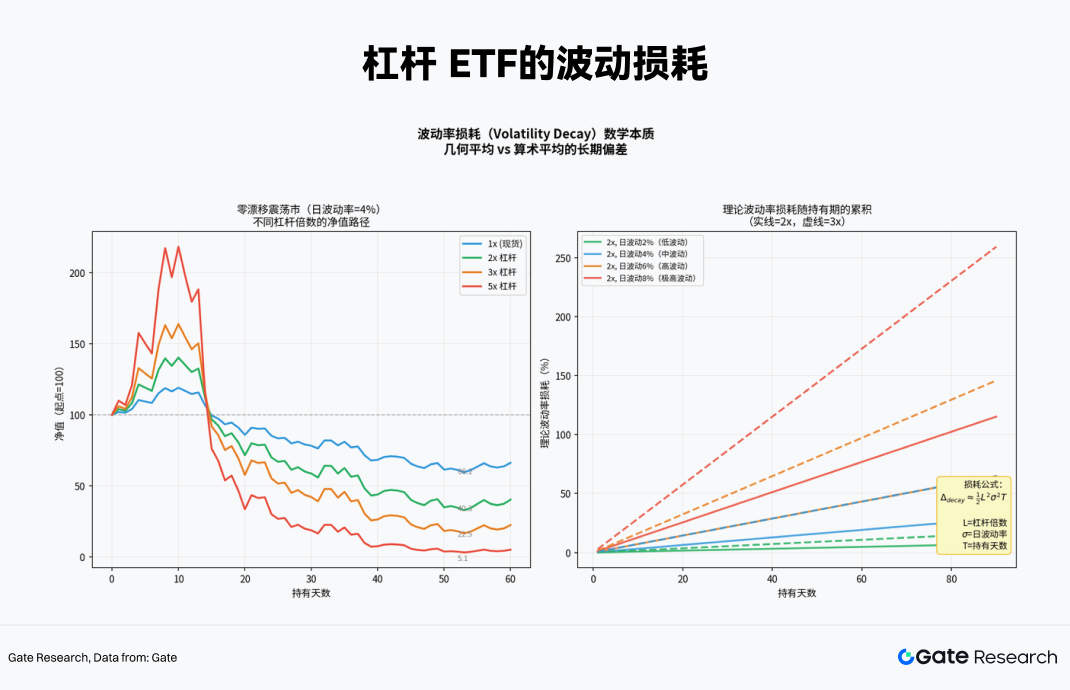
In a highly volatile, zero-drift (returning to the start) market, the higher the leverage multiple, the more the long-term decay amplifies exponentially. For instance, after 60 days, the NAV of a 5x leveraged product might be just 5.1% of its initial value.
2.3 Market Conditions Suitable for Crypto Leveraged ETFs
To determine suitable market conditions for crypto leveraged ETFs, we employed a 60-day rolling Monte Carlo simulation to depict the performance differences of products with various leverage multiples across different market environments.
During the simulation, using the historical returns and volatility of the underlying asset (in this case, ETH) as base parameters, we generate numerous price paths through random sampling. For each path, we calculate the daily compounded NAV changes for different leveraged ETFs (±1x, ±2x, ±3x, ±5x), incorporating a volatility decay mechanism. This yields return distributions under various market structures. Based on this method, one can intuitively compare the long-term performance of different leveraged products within the same market environment.
Empirical results show distinct return differences for various leverage multiples under three typical market scenarios:
1. Strong Trending Market: This is the only environment where leveraged ETFs generate positive excess returns. Due to daily buying on strength, the base position continuously increases, creating a compounding effect. Holding a 3x or 5x ETF yields returns far greater than manually levering 3x via financing (which lacks this compounding effect).
2. High-Volatility Range-Bound Market: A "meat grinder" for leveraged ETFs. The underlying asset's price may remain unchanged after 60 days, yet both a 5x long and a 5x short ETF could plummet over 90%. Volatility decay completely devours the capital. The longer the holding period, the more certain the loss.
3. Low-Volatility Range-Bound Market: Decay exists but is relatively manageable. Sometimes, -1x or -2x products can even generate slight positive returns due to minor trends or funding rate advantages, making them suitable for short-term, event-driven hedging.
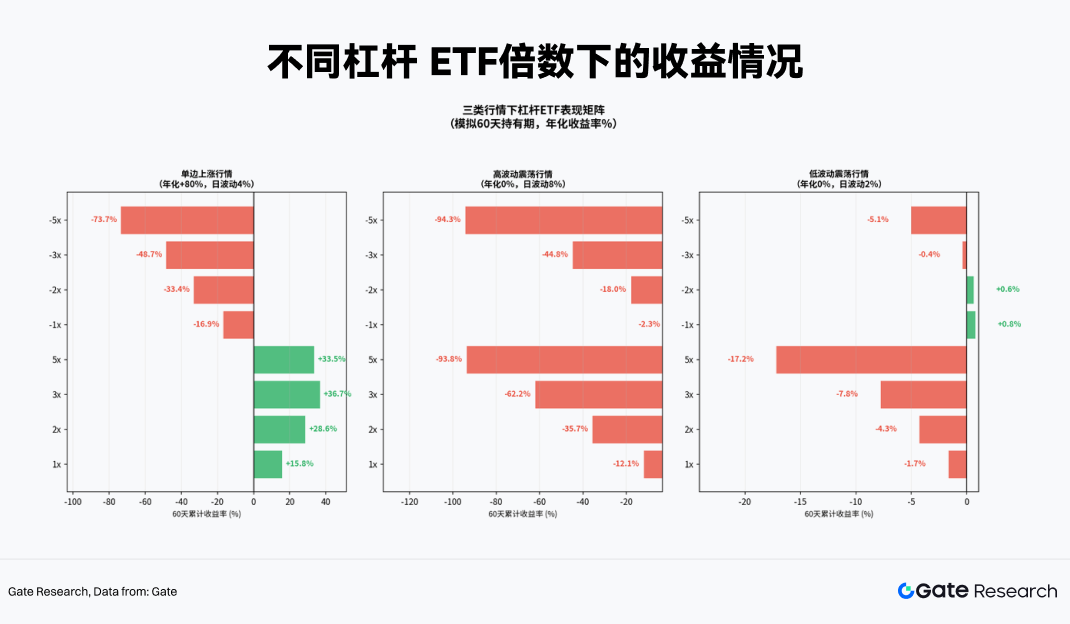
Therefore, the most favorable environment for crypto leveraged ETFs is a strong, sustained trending market. To avoid NAV erosion in fluctuating markets, leveraged ETFs are more suited for short-term tactical allocation rather than long-term core positions.
So, how long can a leveraged ETF be held? This question is clearly illustrated by the heatmap below, which shows different volatility levels and leverage multiples:
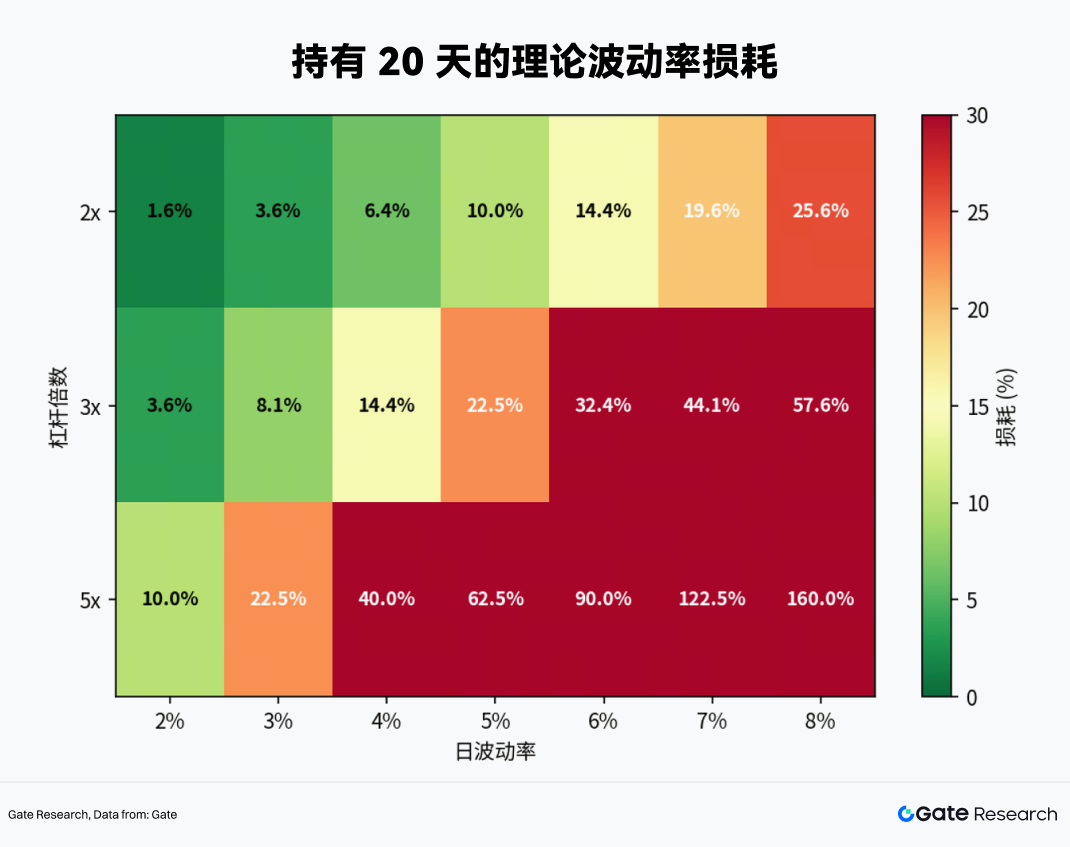
• When daily volatility reaches 4% (the norm for the crypto market), the theoretical decay for a 2x ETF reaches 6.4% in 20 days, 14.4% for a 3x ETF, and a staggering 40% for a 5x ETF.
• The 30-day mark is a critical threshold. Unless the underlying asset has an extremely strong uptrend, under normal volatility, 2x and 3x ETFs struggle to survive 30 days before starting to erode principal.
The conclusion is simple: the holding period for crypto leveraged ETFs should never exceed one month, with the optimal tactical cycle being 1–5 days.
3. Real-World Test of Leveraged ETF Trading Based on Gate MCP
To put theory into practice, we accessed real-time data from the current crypto market via the Gate MCP interface and conducted an in-depth analysis.
3.1 Underlying Asset Screening
Liquidity is the primary prerequisite for the feasibility of any leveraged ETF strategy. Products with low trading volume face slippage risk, and their prices are more prone to deviating from NAV, leading to distorted strategy signals. Therefore, we extracted trading volume data for all leveraged ETF products from the start of 2026 to the end of March via the Gate MCP interface, using it as the first filter for underlying asset selection.
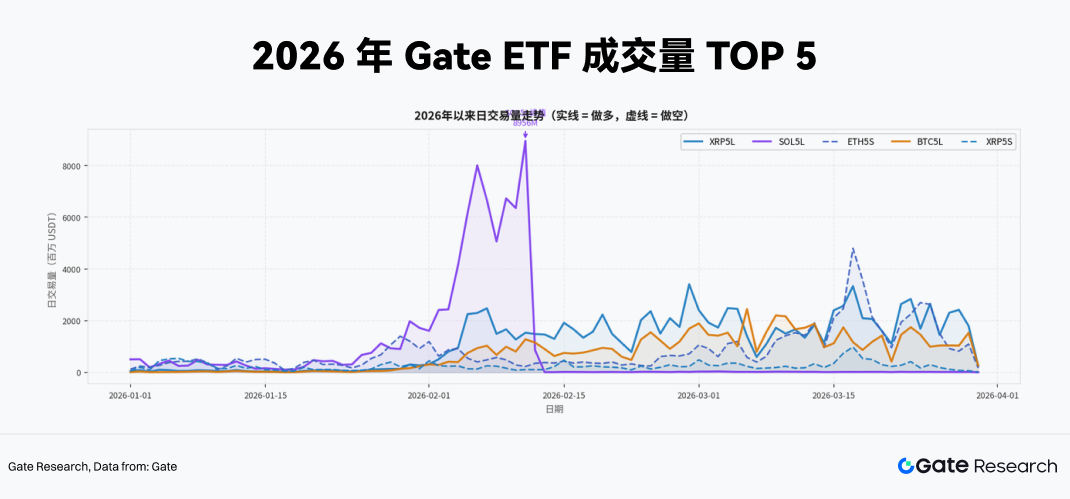
The latest cumulative trading volume rankings show the absolute dominance of 5x leveraged products. The top 5 products (XRP5L, SOL5L, ETH5S, BTC5L, XRP5S) are all 5x leveraged. This indicates that, in the current crypto market environment, capital participating in leveraged ETF trading exhibits a very high risk appetite, preferring to use extreme leverage to speculate on short-term volatility or implement high-intensity spot hedging. Additionally, observing the daily volume trend, SOL5L experienced an extreme peak in early February with daily volume approaching 9 billion USDT. Such liquidity spikes are often closely tied to major fundamental events in the underlying asset, representing typical event-driven trading surges.
In summary, when constructing actual trading strategies, we target these 5x leveraged products with multi-billion USDT daily average volumes. They offer entry depth and exit efficiency unmatched by lower-leverage or less popular products, effectively absorbing the impact cost of large orders to a certain extent.
3.2 Dynamic Hedging and Momentum Breakout Strategy Design for High-Leverage ETFs
The biggest pain point for investors holding spot crypto positions is protecting against downside exposure in a low-cost, liquidation-free manner during macro event shocks or technical breakdowns. Traditional solutions typically involve three methods: opening an equivalent short position in perpetual swaps, buying put options, or converting to stablecoins.
However, each of these three methods has significant drawbacks. First, perpetual swaps require margin and carry the risk of forced liquidation due to wick spikes. Second, options premiums are expensive in high implied volatility environments. Third, converting to stablecoins means completely forfeiting potential upside gains. Leveraged ETFs like XRP5L, SOL5L, and ETH5S offer a fourth path with unique structural advantages under specific conditions:
• No Margin Requirement: Buying an inverse ETF is essentially a spot trade, limiting the maximum loss to the initial principal. This mechanism structurally eliminates the common "wick liquidation" risk found in derivatives markets.
• Extreme Capital Efficiency: 5x leverage means hedging an equivalent notional spot exposure requires only 20% of the capital. The remaining 80% can be allocated to other yield-generating assets or held as liquidity reserves.
• Hedging Precision: For example, ETH5S's actual correlation coefficient with ETH is consistently stable between -0.91 and -0.97, making its hedging effect highly reliable in the short term (as will be verified later).
Based on the above analysis, we construct the following trading strategy framework for high-liquidity, high-leverage (5x) crypto ETFs like XRP5L, SOL5L, and ETH5S.
3.2.1 Entry Signal Design
One of the core risks of leveraged ETFs is rapid NAV decay due to incorrect directional judgment. Therefore, right-side positioning is the first principle of strategy design. Before trading, set relevant buy signals. For example, before macro events like Fed decisions or NFP data releases, or when a crypto spot price breaks above/below a key support level (e.g., 20-day moving average) and a volatility indicator (e.g., 7-day annualized volatility) starts to turn, buy the corresponding leveraged ETF.
Using a 5x short ETF for hedging or speculation as an example, the following triple resonance conditions must be met simultaneously:
1. Technical Breakdown: The daily close of the underlying asset (e.g., ETH or SOL) breaks below its 20-day Simple Moving Average (SMA) with a deviation exceeding 2%.
2. Sentiment Spike: The 7-day annualized realized volatility of the underlying asset has risen sharply compared to the previous week (e.g., by more than 15%), indicating increased market sentiment and attention.
3. Derivatives Capital Shift (Short Perspective): The perpetual swap funding rate has been positive for 3 consecutive days, meaning long positions are still paying fees. This suggests longs haven't fully deleveraged, and shorting momentum hasn't been fully released, making a long squeeze highly probable. The opposite logic applies for a long perspective.
Regarding position building rhythm: on the first day the signal triggers, only establish 50% of the target position. If the downtrend is confirmed by the close of the next day, add the remaining 50% to reach full position, avoiding being faked out by a false breakdown.
3.2.2 Momentum Breakout Detection
Beyond structural hedging, high-leverage ETFs themselves are excellent tools for capturing extreme trending markets. As shown earlier with SOL5L's volume surge in early February, high-leverage ETFs can generate astonishing excess returns during major events.
The core signal for a momentum breakout strategy comes from an abnormal surge in the ETF's own trading volume. In genuine extreme market moves, capital inflow often leads price indicators:
• Trigger Condition: When a specific 5x ETF's daily volume exceeds 3 times its 20-day average volume, and the price simultaneously breaks out of its recent consolidation range or resistance line.
• Position Management: Such speculative operations should be strictly limited to


