
BitMart VIP Insight | บทสรุปตลาดคริปโตเดือนเมษายน และการวิเคราะห์ประเด็นร้อน
- มุมมองหลัก: ในเดือนเมษายน ตลาดคริปโตเกิดการปรับโครงสร้างเชิงบวกในรูปแบบ "มูลค่าตลาดพุ่งทะลุ ปริมาณการซื้อขายตามติด" ภายใต้บรรยากาศความตึงเครียดทางภูมิรัฐศาสตร์ที่ผ่อนคลายลงและความคืบหน้าของกฎระเบียบ โดย BTC มีกำไรรายเดือน 13% ซึ่งเป็นระดับสูงสุดในปีนี้ แต่กำลังเผชิญแนวต้านสำคัญที่ 80,000 ดอลลาร์ ส่วนตัวแปรหลักของเดือนพฤษภาคมคือสัญญาณนโยบายหลังจากการเปลี่ยนประธานธนาคารกลางสหรัฐฯ ความคืบหน้าของร่างกฎหมาย CLARITY และการแก้ไขปัญหาความปลอดภัยของ DeFi
- ปัจจัยสำคัญ:
- การประชุม FOMC เดือนเมษายนคงอัตราดอกเบี้ยไว้ แต่การพ้นตำแหน่งของพาวเวลล์ (Powell) และการรับตำแหน่งต่อของวอร์ชทำให้เกิดความไม่แน่นอนด้านนโยบาย โดยการประชุม FOMC วันที่ 6-7 พฤษภาคมซึ่งวอร์ชจะเป็นประธานครั้งแรกถือเป็นจุดเปลี่ยนสำคัญ สัญญาณเชิงคุมเข้มใดๆ หรือเงินเฟ้อที่ปรับตัวสูงขึ้นครั้งที่สองอาจกดดันสินทรัพย์เสี่ยง
- มูลค่าตลาดคริปโตในเดือนเมษายนเพิ่มขึ้นจาก 2.43 ล้านล้านดอลลาร์เป็น 2.70 ล้านล้านดอลลาร์ (+11.5%) โดยมีปริมาณการซื้อขายเฉลี่ยต่อวันประมาณ 9.8 หมื่นล้านดอลลาร์ ขนาดของกองทุน Bitcoin Spot ETF ทะลุ 1 แสนล้านดอลลาร์ (1.012 แสนล้านดอลลาร์) โดยมีเงินไหลเข้าสุทธิรายเดือน 8.44 พันล้านดอลลาร์ และกองทุน ETH ETF มีเงินไหลเข้าสุทธิ 1.75 พันล้านดอลลาร์
- การหยุดยิงระหว่างสหรัฐฯ และอิหร่านเป็นตัวเร่งหลักของตลาด โดย BTC ดีดตัวจากจุดต่ำสุดที่ 65,000 ดอลลาร์ ขึ้นมาใกล้ระดับ 79,000 ดอลลาร์ แต่แนวต้านที่ 80,000 ดอลลาร์ยังไม่ถูกทำลาย ส่วน SOL มีผลงานค่อนข้างอ่อนแอ ถูกถ่วงโดยเหตุการณ์โจมตี Drift จำเป็นต้องจับตาดูแนวต้านที่ 90 ดอลลาร์และการฟื้นฟูความเชื่อมั่นในระบบนิเวศ
- เหตุการณ์ด้านความปลอดภัยของ DeFi ในเดือนเมษายนเกิดขึ้นบ่อยครั้ง การโจมตีสองครั้งที่ Drift และ KelpDAO ทำให้เกิดความเสียหายรวมกว่า 600 ล้านดอลลาร์ เผยให้เห็นความเสี่ยงเชิงระบบของโอราเคิลและสถาปัตยกรรมข้ามเชน ส่งผลให้เกิดการถอนเงินทุนออกไปประมาณ 1.3 หมื่นล้านดอลลาร์
- ร่างกฎหมาย CLARITY เสร็จสิ้นการทำเครื่องหมาย (Markup) ในคณะกรรมการการธนาคารของวุฒิสภา โดย Polymarket คาดการณ์ว่าโอกาสที่กฎหมายจะผ่านภายในปีนี้เพิ่มขึ้นเป็นมากกว่า 85% หากผ่านในเดือนพฤษภาคม จะยุติข้อพิพาทเขตอำนาจศาลระหว่าง SEC และ CFTC ซึ่งจะผลักดันให้เงินทุนจากสถาบันไหลเข้าสู่ตลาดเร็วขึ้น
- อุปทาน Stablecoin โดยรวมเพิ่มขึ้นเล็กน้อยเป็น 2.884 แสนล้านดอลลาร์ แต่มีโครงสร้างที่แตกต่างกัน: USDT ยังคงเป็นผู้นำการขยายตัว (+3.2%) ในขณะที่ USDe หดตัวลงอย่างมากถึง 37.7% เนื่องจากอัตราผลตอบแทนที่ลดลง สะท้อนให้เห็นถึงการปรับสมดุลของเงินทุนระหว่างผลตอบแทนและความเสี่ยง
- ในเดือนพฤษภาคม ให้ความสำคัญกับปัจจัยขับเคลื่อนระยะกลางถึงยาว เช่น ความคืบหน้าด้านกฎระเบียบในภูมิภาคเอเชียแปซิฟิก (กรอบการอนุญาต Stablecoin ของฮ่องกง) การขยายตัวของทุนสำรอง BTC ขององค์กรอย่างต่อเนื่อง (MicroStrategy ถือครองมากกว่า 530,000 BTC) และการแปลงสินทรัพย์จริงเป็นโทเค็น (RWA) เช่น กองทุน BUIDL ของ BlackRock

TL,DR
- The April FOMC held rates steady, but the change in Chairmanship introduces policy uncertainty. Inflation rose due to oil price shocks, while a recovering job market supported the economy. US stocks rebounded overall as risk appetite improved. In May, the market will focus on the new Chair's policy signals, inflation, and oil price trends. Concurrently, crypto market momentum and legislative progress will also be key variables.
- April's crypto market trading volume exhibited a "low open, volume surge, high-level consolidation" structure. Multiple volume spikes were driven by ceasefire news, maintaining healthy volume amidst price increases. Total market cap rose from approximately $2.43 trillion to $2.70 trillion. After an early-month dip, it reversed under the ceasefire catalyst and trended upward with consolidation. Compared to March's pressured consolidation, April saw a structural improvement characterized by "market cap breakthroughs with volume support," with the market's center of gravity clearly shifting higher.
- In April, both BTC and ETH spot ETFs recorded significant net capital inflows, driving prices higher simultaneously. The BTC ETF scale surpassed $100 billion for the first time, marking a new phase in institutional allocation. Overall, the market showed a "price-led, capital-following" characteristic, with institutional funds still clearly favoring BTC over ETH. Meanwhile, the total stablecoin supply grew modestly but with intensified structural divergence: USDT dominated the expansion while USDe contracted sharply, reflecting a rebalancing of capital between yield and risk.
- In April, BTC recorded its strongest single-month performance of the year. It rallied strongly amid geopolitical easing but remained capped by the key resistance level of $80,000. ETH's trajectory was largely synchronized with BTC, rebounding supported by institutional demand and upgrade expectations, but it still faces the test of $2,400 resistance in the short term. SOL followed the market rebound but underperformed, dragged down by ecosystem security incidents. Key subsequent signals will be confidence recovery and a breakout above $90 resistance.
- The US-Iran ceasefire alleviated geopolitical risks and spurred a strong BTC rally, which rose approximately 13% in April, driving significant returns in overall crypto market cap and ETF fund flows. Concurrently, attacks on Drift and KelpDAO led to DeFi losses exceeding $600 million and triggered a massive exodus of funds, exposing systemic risks in oracle and cross-chain architectures. On the policy front, the CLARITY Act completed a key advancement, significantly raising expectations for passage within the year, signifying the accelerating formation of a crypto market regulatory framework.
- In May, the market's core focus will be on Kevin Warsh's first FOMC meeting and policy signal changes, coupled with inflation and oil price trends. These will directly determine whether risk assets and BTC can sustain their strength. Concurrently, the CLARITY Act moves to a full Senate vote; if passed, it would significantly drive institutional capital entry and reshape the crypto regulatory landscape. Asia-Pacific regulatory progress, corporate BTC reserves, and accelerating RWA tokenization collectively form important drivers for medium-to-long-term capital inflows and industry development.
1. Macro Perspective
Policy Direction
The FOMC held its third policy meeting of the year on April 28-29. The market expected the federal funds rate target to remain unchanged in the 3.50%–3.75% range. This meeting did not include a dot plot update, so every word of the statement was subject to intense market scrutiny. It was also the last FOMC meeting chaired by Fed Chair Jerome Powell – his term officially expires on May 15. His nominated successor, Kevin Warsh, completed his Senate Banking Committee hearing on April 21. On April 26, Senator Tillis, the last key holdout, withdrew his objection, moving the confirmation vote to its final stage. The market broadly focused on whether Powell would provide forward guidance on the subsequent policy path during his final press conference and whether a shift in monetary policy signals would occur after Warsh took over. Overall, the April FOMC delivered no policy surprises based on the "hold steady" baseline, but the uncertainty premium introduced by the leadership transition will extend into May.
US Stock Market Trends
The US stock market overall showed a recovery pattern of first declining and then rising, primarily driven by geopolitical easing. Late March continued the high oil prices and inflation concerns from the previous month, putting pressure on the S&P 500. Following the announcement of the US-Iran ceasefire agreement on April 8, which led to a partial resumption of shipping in the Strait of Hormuz, market risk appetite quickly rebounded. The tech sector and consumer discretionary stocks led the gains, with the S&P 500 surging sharply within days of the ceasefire. The March CPI, released on April 10, surged to 3.3%, causing a brief pullback, but the market quickly digested this, characterizing it as a supply-side shock rather than demand-pull inflation. The Q1 earnings season became the core driver in mid-to-late April. The S&P 500 recorded positive returns for four consecutive weeks and hit a new cyclical high on April 24. Major tech company earnings generally exceeded expectations, and sustained expansion in AI capital expenditure further boosted sentiment. Overall, the S&P 500 posted a positive monthly return in April. The VIX fear index fell from an early-month high of 31.65 to around 18.5 by month-end, indicating a significant improvement in market sentiment.
Inflation Data
The US Bureau of Labor Statistics released the March 2026 CPI data on April 10. CPI rose 3.3% year-over-year, a significant increase of 0.9 percentage points from February's 2.4%, with a month-over-month increase of +0.9%, the largest monthly gain since 2022. Core CPI (excluding food and energy) rose 0.2% month-over-month and approximately 2.6% year-over-year, which was relatively moderate. The primary driver of the sharp inflation jump was the surge in energy prices due to the US-Iran war – gasoline prices rose 21.2% in March alone, the largest monthly increase since 1967, pushing the overall energy component significantly higher. The pass-through effect of tariffs also began to appear in imported goods categories. The mainstream market interpretation of this data was a supply-side shock rather than demand-pull inflation. The relatively controlled core CPI suggests the Fed is unlikely to change its policy path. However, if the US-Iran conflict persists, keeping oil prices high, the risk of secondary pass-through of inflationary pressures to core components cannot be ignored.
Employment Data
The US Department of Labor released the March 2026 non-farm payrolls report on April 3. Non-farm payrolls increased by 178,000, significantly beating the market expectation of 59,000 and representing a substantial turnaround from the revised February figure of -133,000 (initial estimate -92,000). The unemployment rate edged down to 4.3% from 4.4%, while the labor force participation rate dipped slightly to 61.9%. The main contributors to the employment recovery were the healthcare industry (+76,000, primarily due to healthcare workers returning after strikes ended), construction, and transportation/warehousing. Average hourly earnings grew 3.5% year-over-year and +0.2% month-over-month, indicating moderate wage inflation pressure. Overall, the March employment data alleviated market concerns about a rapid deterioration in the labor market, providing new support for the "soft landing" narrative and somewhat easing the pressure on the FOMC to cut rates quickly. However, the decline in the labor force participation rate suggests part of the employment improvement stems from workers leaving the workforce, so the underlying resilience of the labor market remains to be seen.
Political Factors
Political factors affecting crypto and macro market sentiment were primarily centered on the US-Iran geopolitical situation. On April 8, the US and Iran announced a temporary ceasefire agreement brokered by Pakistan. Shipping through the Strait of Hormuz gradually resumed partial operations. Brent crude oil fell sharply from its near $120/barrel peak since the war began, with WTI dropping over 16% on the day of the ceasefire. However, the good news was short-lived. Ceasefire negotiations progressed slowly. In late April, Iran's Foreign Minister reiterated a hardline stance, and Brent crude oil moved back into the $107-108/barrel range on April 26-27. The fragility of the ceasefire posed a continued tail risk, with the market fearing a potential impact on Brent reaching $150 if the Hormuz disruption lasted until the end of June. In the crypto sector, the CLARITY Act completed its markup in the Senate Banking Committee before the April 25 deadline. A substantive impasse was resolved through the Tillis-Alsobrooks stablecoin yield compromise proposal, and expectations for legislative passage significantly warmed toward the end of the month. The uncertainty surrounding the monetary policy transition period, as Powell prepares to leave and Warsh takes over, became a key new concern for the market in late April. Overall, the ceasefire was the most important positive catalyst, but rising oil prices and uncertainty during the policy transition period were the main negative variables.
Next Month Outlook
Looking ahead to May, Kevin Warsh will chair his first FOMC meeting as Fed Chair on May 6-7 (Powell officially steps down on May 15). The market will be extremely sensitive to the statement's wording and Warsh's policy signals during the press conference – any noticeable deviation from Powell's language could trigger significant volatility in risk assets. April CPI and PCE data will be released in May. A key observation point will be whether the March oil price shock causes a secondary uptick in core inflation. If core components remain moderate (month-over-month ≤ 0.2%), rate cut expectations will likely stabilize. After the CLARITY Act's committee markup in April, it will enter the preparation phase for a full Senate vote in May. Senator Moreno's target deadline for passage by the end of May makes the legislative timeline highly tight. For crypto assets, whether BTC can achieve an effective breakout above the key $80,000 level and whether ETF inflows remain positive are important indicators for judging whether the April bullish momentum can extend into May. The direction of US-Iran negotiations and whether oil prices can fall back below $100 will be the core macro variables determining whether market risk appetite can expand further.
2. Crypto Market Overview
Token Data Analysis
Trading Volume & Daily Growth Rate
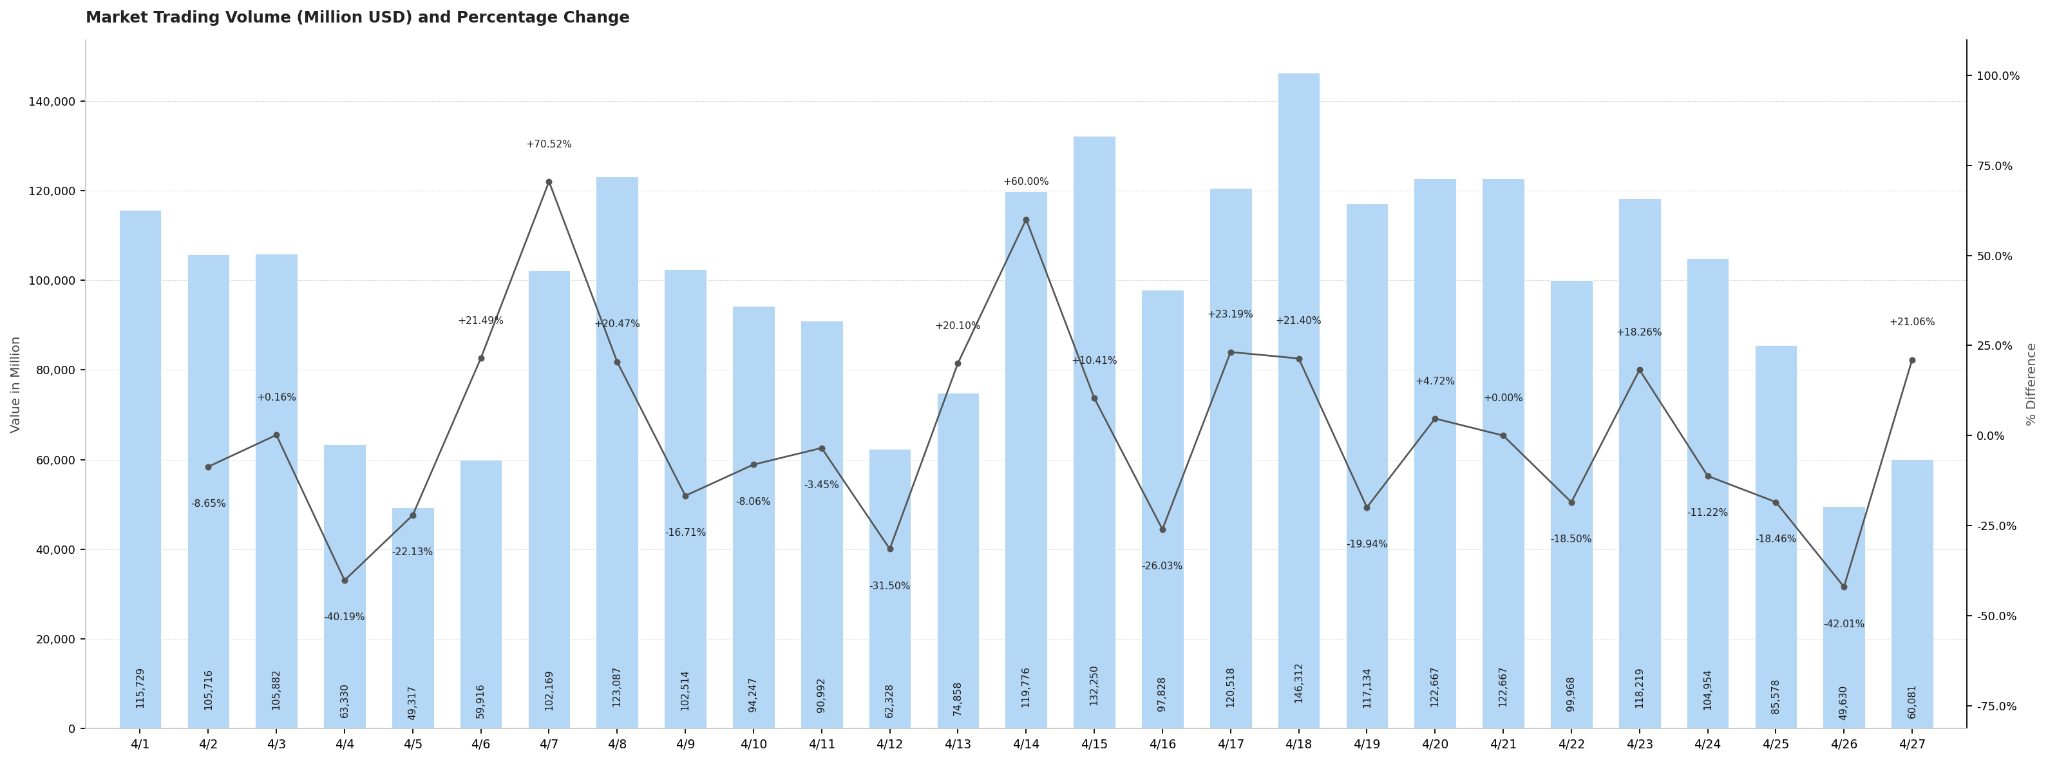
The average daily trading volume in the crypto market for April was approximately $98 billion, exhibiting a "low open, volume surge, high-level consolidation" fluctuation structure. The month started with a volume of around $115.7 billion on April 1, which subsequently fell due to the weekend effect, hitting monthly lows on April 4-5 (approximately $63.3 billion and $49.3 billion respectively). Volume quickly recovered on weekdays, surging 70.52% day-over-day to approximately $102.2 billion on April 7. The US-Iran ceasefire news on April 8 further propelled volume to about $123.1 billion, significantly warming market sentiment. As the market continued to rise on April 14-15, volume remained high for two consecutive days (approximately $119.8 billion and $132.3 billion). It hit a monthly peak of around $146.3 billion on April 18, the most active trading day of the month, coinciding with a new cyclical high in crypto market cap, showing a significant volume-price resonance. At the end of the month, volume fell back to lows on April 25-26 due to the weekend (approximately $85.6 billion and $49.6 billion), before recovering slightly to $60.1 billion on April 27 to close the month. Overall, weekday trading volume generally remained in the $90-130 billion range, while it regularly contracted to $50-65 billion on weekends. Market activity showed a phased upward trend with price increases, with a healthy volume structure.
Total Market Cap & Daily Change
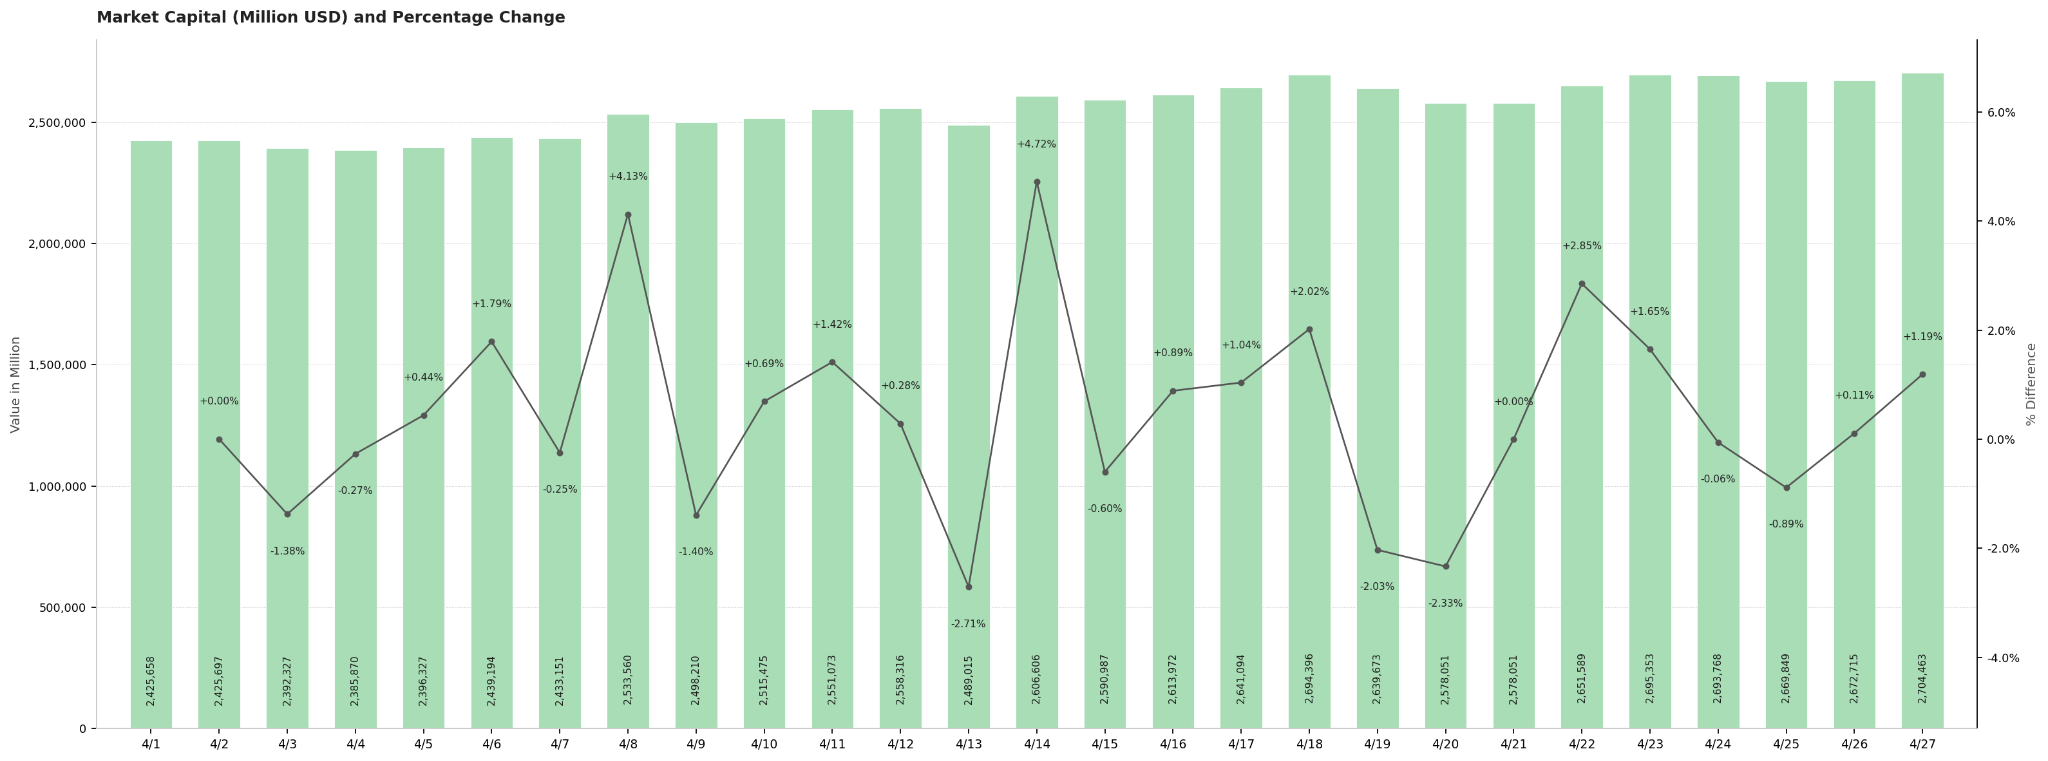
The total crypto market cap in April steadily climbed from approximately $2.43 trillion at the start of the month to around $2.70 trillion at the end, an intra-month increase of about 11.5%. The month's trajectory clearly showed a three-phase structure: "initial decline and bottoming, reversal on ceasefire, volatile upward trend." From the beginning of the month to April 5, weighed down by high oil prices and inflationary pressures, the market cap dipped slightly to around $2.39 trillion (the monthly low). The announcement of the US-Iran ceasefire agreement on April 8 marked the most important turning point of the month, with the market cap surging 4.12% day-over-day, breaking through the $2.53 trillion level and signaling a substantial restoration of risk appetite. Subsequently, the market cap entered a volatile upward channel. Driven by sustained capital inflows on April 14, it rose another 4.73% day-over-day, reaching a cyclical high of about $2.69 trillion on April 18. Towards the end of the month, the market cap strengthened further to around $2.70 trillion on April 22-23 and closed at $2.70 trillion on the last trading day of April, the highest closing point of the month. It is worth noting that the largest single-day pullback of the month occurred on April 13 (-2.72%), corresponding to short-term panic triggered by the KelpDAO security incident. However, the market quickly digested this and resumed its upward trajectory, reflecting the resilience and dominant position of bullish forces in this round of the market.
Comparison with March Data
Compared to March, the crypto market in April showed clear improvement in both market cap and trading volume. Regarding market cap, pressured by hawkish FOMC signals and high oil prices in March, the total market cap oscillated widely within the $2.3 trillion to $2.6 trillion range without achieving an effective breakout. In April, spurred by the US-Iran ceasefire, it completed a structural uplift, steadily climbing from $2.43 trillion at the start to $2.70 trillion, an intra-month increase of about 11.5%. The upper boundary of the range expanded by approximately $100 billion compared to March, and the market's center of gravity shifted northward. Regarding trading volume, March's average daily volume was between $80 billion and $100 billion, characterized by low activity and cautious waiting. April's average daily volume remained around $98 billion, roughly flat with the March average. However, the month witnessed multiple periods of high activity with single-day volumes breaking $120 billion (April 8, April 14-15, April 18). The peak of about $146.3 billion on April 18 far exceeded any single-day level in March, demonstrating a volume-price resonance structure that amplified as prices rose. Overall, March was a consolidation pattern of "pressured market cap and shrinking volume," while April achieved a structural shift featuring "market cap breakthroughs with volume support," a stark contrast between the two months.
Hot Tokens in April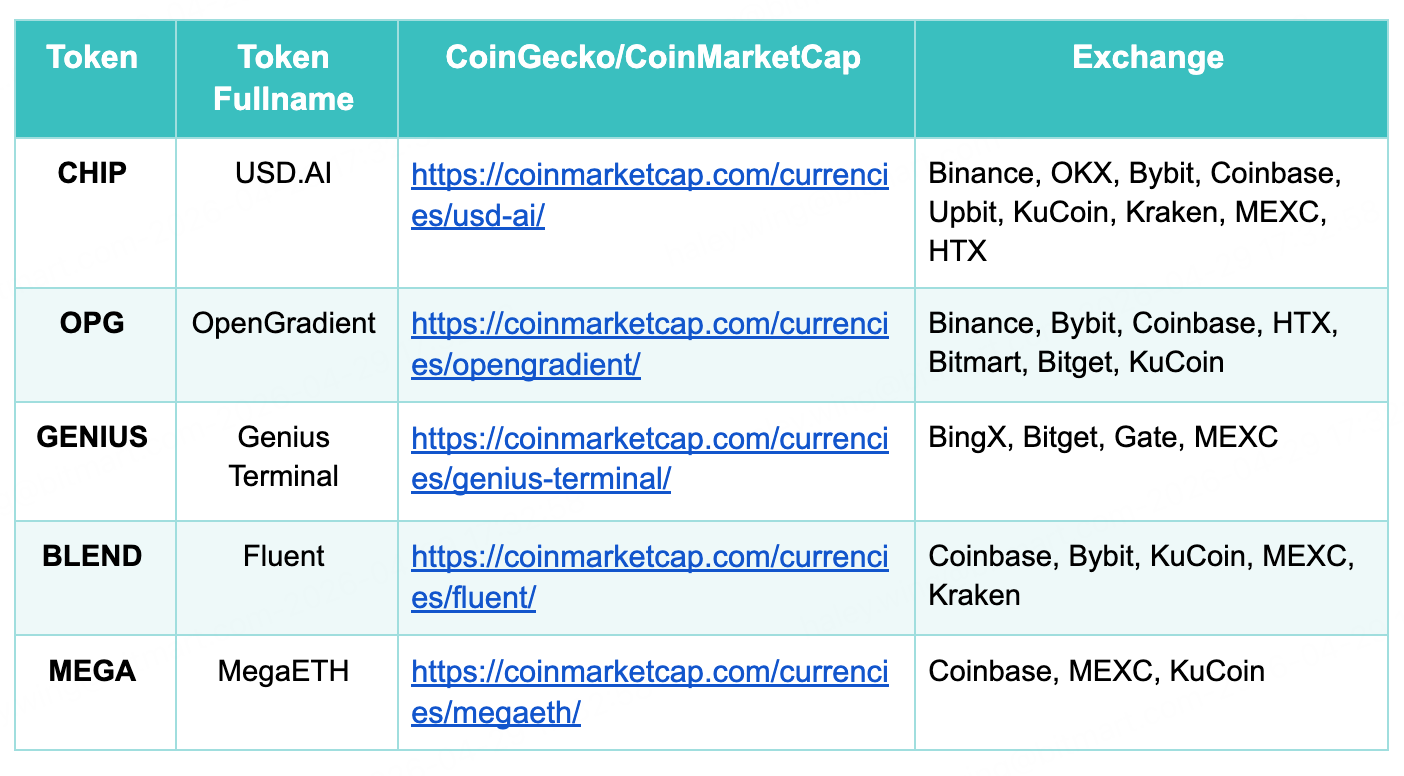
In April 2026, the crypto market saw the launch of several high-profile new tokens, with overall strong performance. In terms of launch scale, CHIP (USD.AI) and OPG (OpenGradient) saw first-day trading volumes exceed $1.4 billion and $1 billion respectively, setting the peak liquidity for new tokens in April and indicating simultaneous influx of institutional and retail funds. GENIUS (Genius Terminal) opened first on April 13. Backed by a multi-hundred-million-dollar investment from YZi Labs and the market effect of CZ serving as an advisor, its price surged over 65-fold on the first day, with a 24-hour trading volume of $1.1 billion, generating hype comparable to the former two.
From a sector perspective, the three top projects respectively cover AI lending infrastructure (CHIP), decentralized AI inference networks (OPG), and on-chain trading terminals (GENIUS). All are highly aligned with the AI narrative, confirming the market's sustained enthusiasm for the AI+Web3 direction. BLEND (Fluent Network) and MEGA (MegaETH), as new Ethereum Layer 2 projects, completed their TGEs on April 24 and April 30 respectively, with relatively moderate trading volumes. However, Coinbase's endorsement provided strong compliance credibility. Overall, April's hot new tokens centered on two main themes: AI infrastructure and Ethereum scaling. Top projects boasted ample first-day liquidity and broad exchange coverage, reflecting the market's strong capacity to absorb high-quality new projects.
3. On-Chain Data Analysis
BTC and ETH ETF Inflow/Outflow Analysis
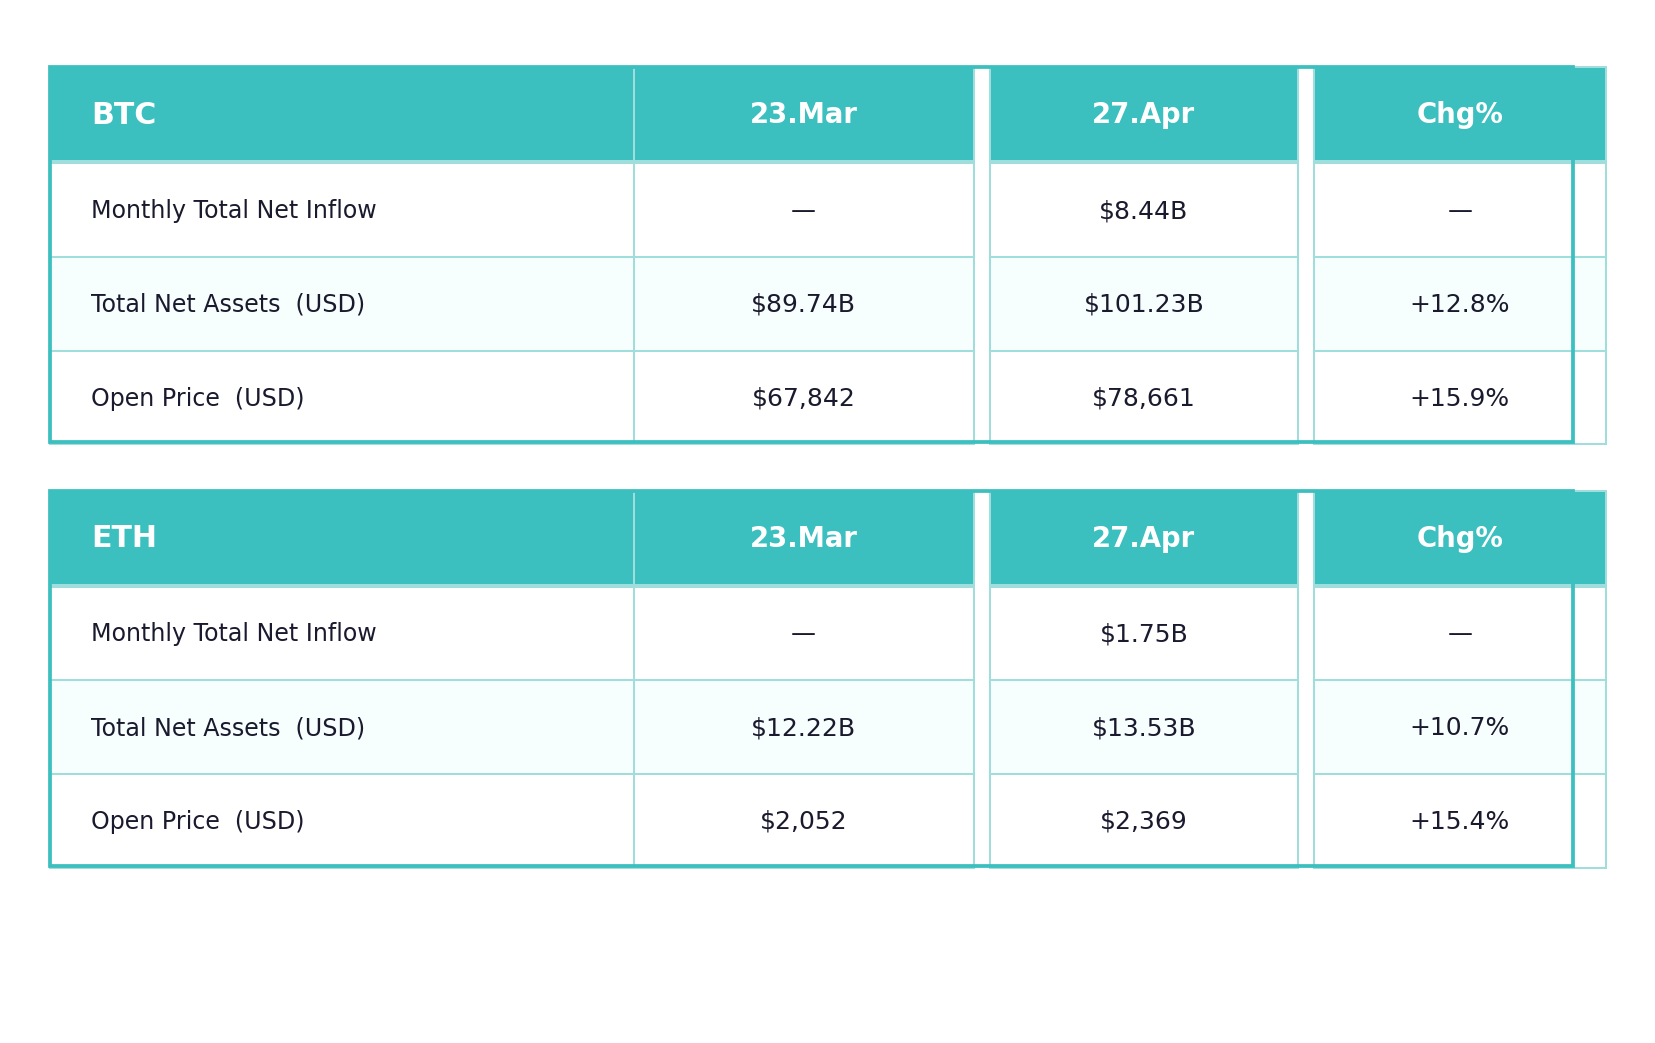
In April, both BTC and ETH spot ETFs continued their net capital inflow trend, with institutional allocation willingness significantly recovering. BTC spot ETFs recorded a monthly total net inflow of $8.44 billion, pushing total net assets from $89.9 billion at the end of March to $101.2 billion, a month-over-month increase of 12.8%. This marked the first time breaking through the $100 billion threshold, setting an all-time high. During the same period, BTC's opening price rose from $67,842 to $78,661, a monthly increase of 15.9%, the best single-month performance in the past year. ETH spot ETFs also recorded a monthly net inflow of $1.75 billion, with total net assets rising from $12.2 billion to $13.5 billion (+10.7%). The ETH price rose from $2,052 to $2,369 (+15.4%),


