
Glassnode:比特币市场正经历前所未有的低波动周期
原文作者:Checkmate, Glassnode
原文编译:深潮 TechFlow
摘要
比特币价格以其波动而著名,然而目前市场正经历着极度的波动率压缩。
期货市场明显平稳,比特币和以太坊的交易量都达到历史低点,现货交易和套利收益率为 5.3% ,略高于无风险利率。
期权市场的隐含波动率正在经历显著的波动率压缩,波动率溢价仅为 2021-22 年基准的一半以下。
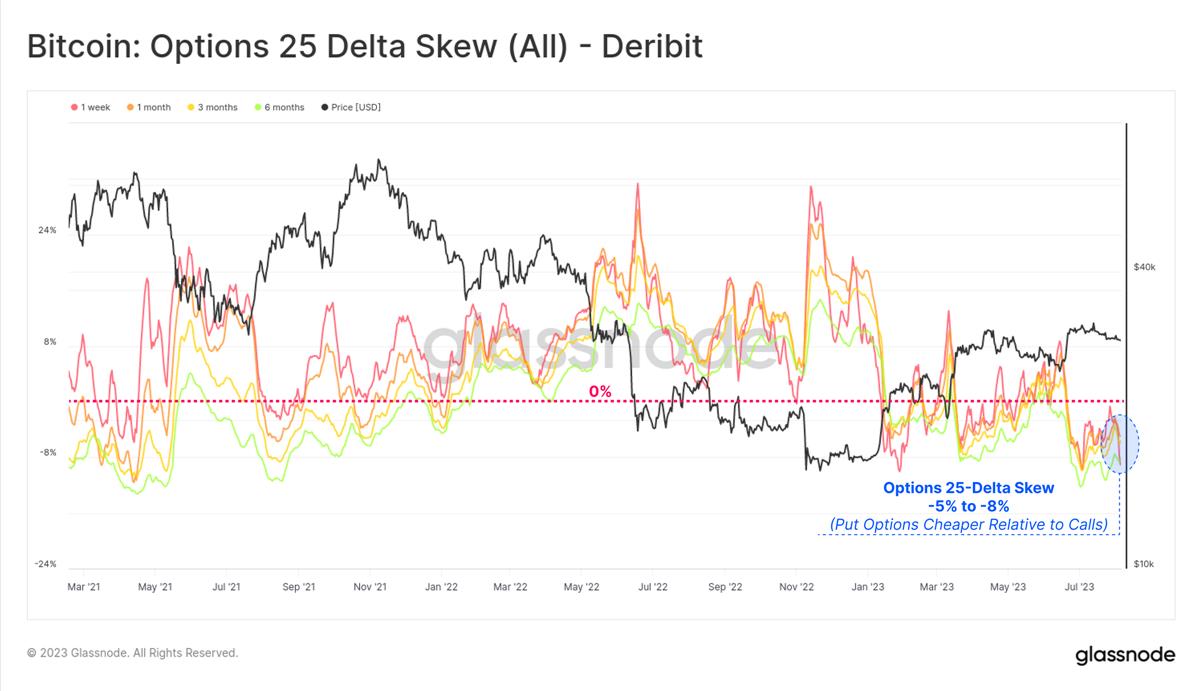
看跌/看涨比率和 25-delta 偏度指标均处于历史低位,表明期权市场偏向看涨,而看跌期权的定价表明未来波动性非常小。
一个平静的时期
比特币市场正经历着一个非常平静的时期,许多波动性指标都降至历史低位。在本文中,我们将从历史的角度探讨这段安静时期的非凡之处,然后探讨衍生品市场如何对其进行定价。
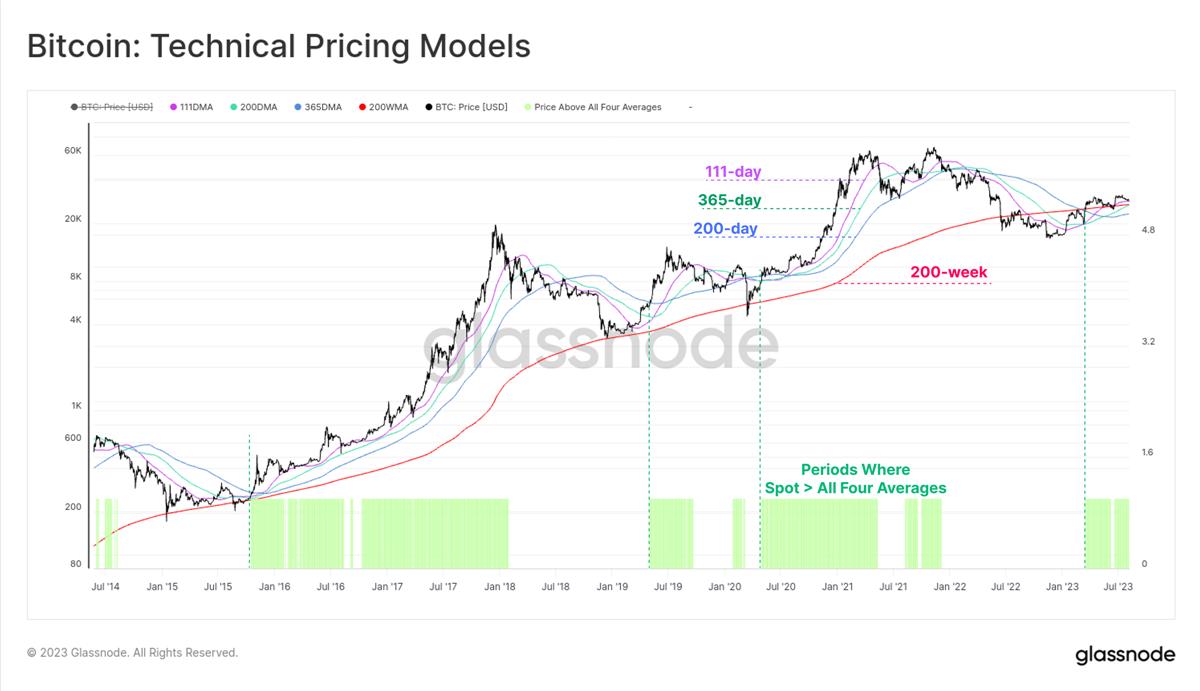
首先,我们注意到比特币现货价格高于行业广泛观察的一些长期移动平均线(111 天、 200 天、 365 天和 200 周)。这些平均值的范围从最低 23, 300 美元 (200 DMA) 到最高 28, 500 美元 (111 DMA)。该图表还突出显示了过去两个周期中的类似时期,这些时期往往与宏观上升趋势保持一致。
我们可以使用链上实现价格来观察非常相似的情况,这些价格模拟了三个群体的成本基础:
🟠 整个市场(实际价格)。
🔴 短期持有者(持有时间小于 155 天的币)。
🔵 长期持有者(持有时间超过 155 天的币)。
现货价格再次高于这三个模型,并与上述经典技术分析工具显示出强烈的一致性。
自 2021 年 4 月牛市高点以来已经过去了 842 天。与历史相比, 2023 年的复苏情况实际上要好一些,与历史最高点相比,下跌幅度为 -54% ,而历史上的下跌幅度为 -64% 。
我们还注意到,在市场加速突破 -54% 的回撤水平之前, 2015-16 和 2019-20 周期都经历了 6 个月的横盘无聊期。这也许表明了未来可能会出现的无聊。
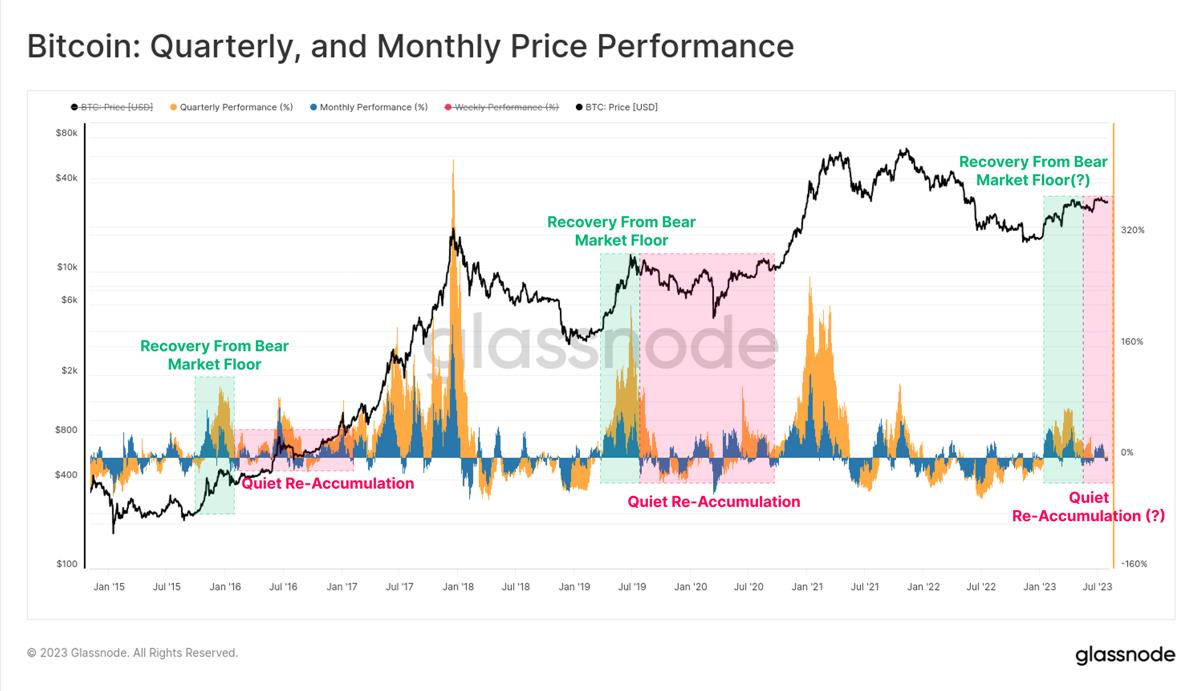
在 2023 年初火热的开局之后,季度和月度价格表现都有所降温。我们再次可以看到与之前周期的许多相似之处,即底部反弹的初期势头强劲,但随后进入了一个持续的震荡整理期。
比特币分析师通常将这个时期称为重新积累期。
波动性崩溃
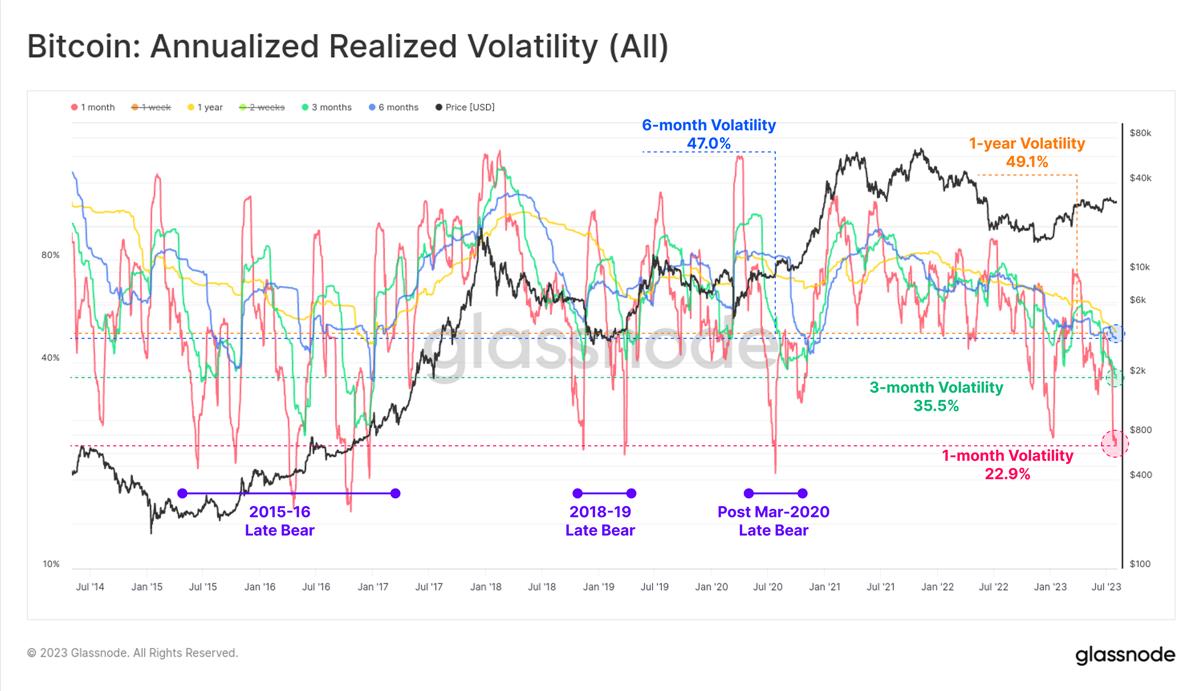
比特币在 2023 年的 1 个月到 1 年的观察窗口内的实现波动性大幅下降,达到了多年低点。1 年的波动性水平现在处于自 2016 年 12 月以来未曾见过的水平。这是第四个极端波动率压缩期:
2015 年末的熊市进入 2016 年的重新积累期。
2018 年末阶段的熊市发生在 11 月抛售 50% 之前。然而,这之后在 2019 年 4 月出现了复苏反弹,三个月内从 4, 000 美元上涨到 14, 000 美元。
2020 年 3 月后,随着世界适应了新冠肺炎 (COVID-19) 的爆发,市场出现整合。
2022 年年底的市场休整,当时市场正在消化 FTX 的失败,以及我们当前的市场情况。
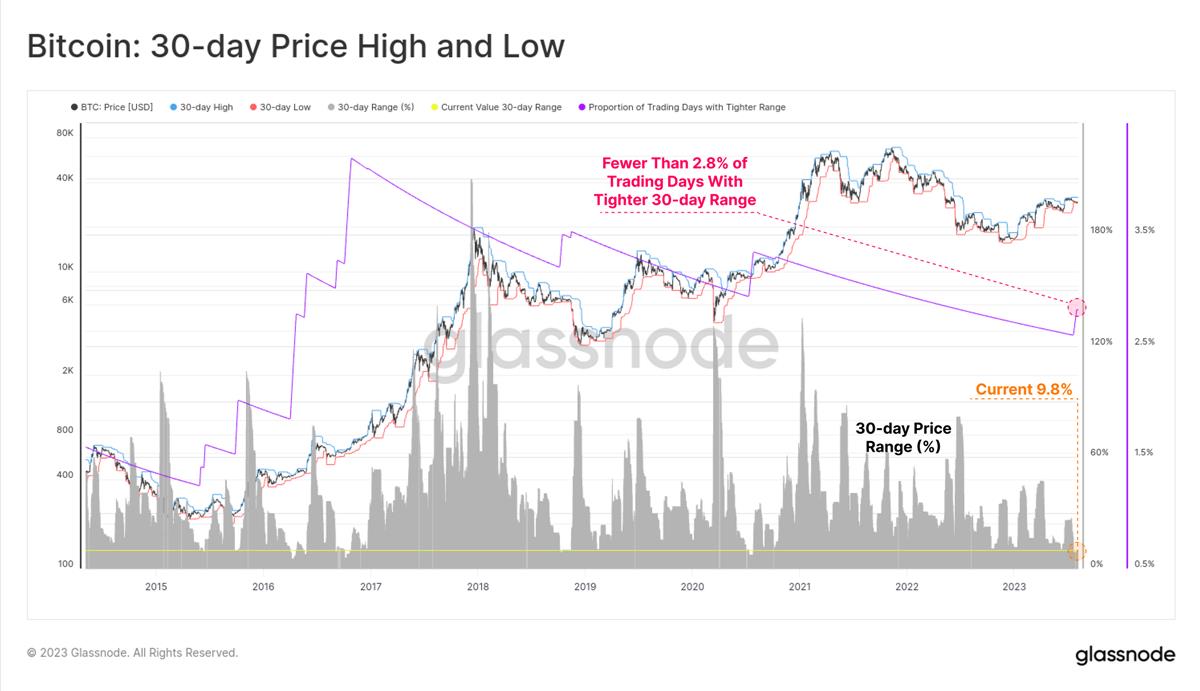
7 天内的最高价和最低价之间的价格范围仅为 3.6% 。只有 4.8% 的交易日曾经经历过更小的周交易范围。
30 天的价格范围更加极端,过去一个月内价格仅在 9.8% 的区间内波动,而只有 2.8% 的月份比这个范围更小。对于比特币来说,这种程度的整固和价格压缩是非常罕见的事件。
这个平静时期也在比特币和以太坊的衍生品市场上可见。对于这两种资产,期货和期权的交易量都接近或达到历史低点。
比特币的衍生品交易量目前为 190 亿美元,而以太坊市场每天只有 92 亿美元的交易量,创下了 2023 年 1 月的低点。
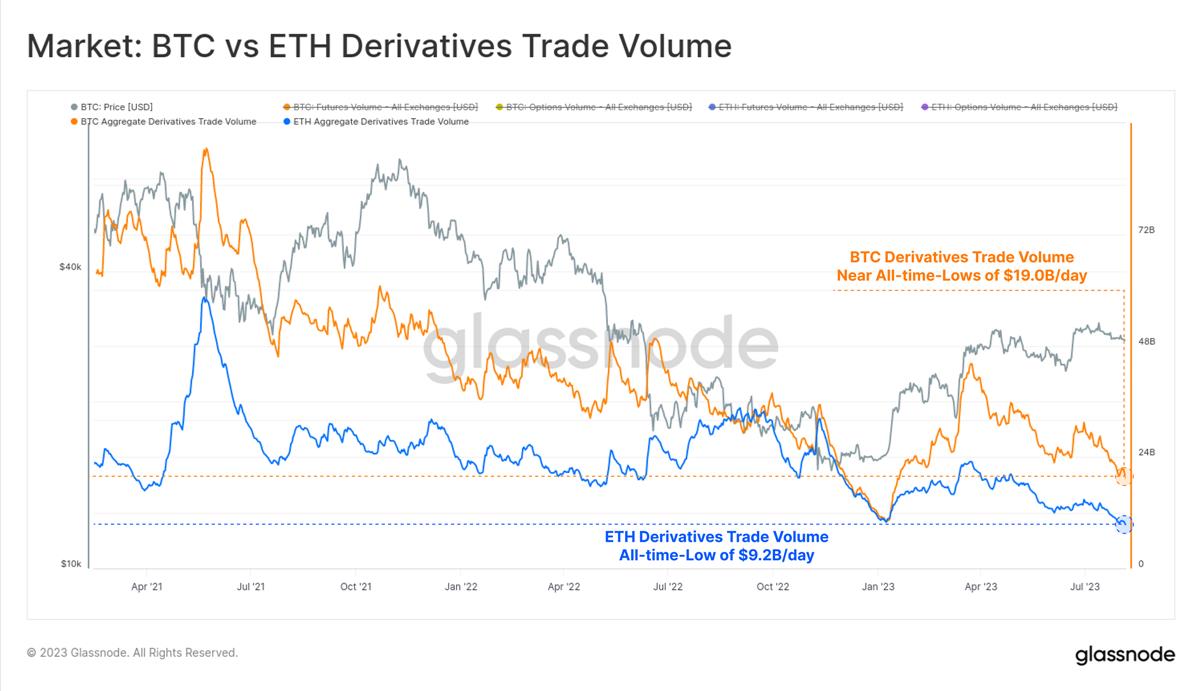
市场还保持着相对风险规避的立场,比特币在期货市场中的主导地位逐渐提高。在 2021 年至 2022 年期间,相对于比特币,以太坊期货市场的交易量和持仓量稳步增加,并在 2022 年下半年达到 60 BTC : 40 ETH 的峰值。
今年比特币再次占据了优势,表明流动性较低和风险偏好降低仍然是推动资金向风险曲线上移的力量。
在过去一个月中,比特币在期货市场的持仓量也相对稳定,为 121 亿美元。这与 2022 年下半年的水平相似,当时比特币价格比今天便宜约 30% ,而 FTX 交易所仍然活跃。这也与 2021 年 1 月的上涨时期相似,当时比特币价格比现在高出 30% ,市场不太成熟,杠杆投机才刚刚升温。
从比较的角度来看,期权市场在主导地位和增长方面出现了显著增长,过去 12 个月的持仓量增加了一倍以上。现在,期权市场在持仓量规模上与期货市场不相上下。
另一方面,期货市场的持仓量自 2022 年底(FTX 崩溃时)以来一直稳步下降, 2023 年仅略有增加。
由于期货市场的交易量很少且活动乏力,下一个目标是确定哪些机会使交易者在数字资产衍生品领域保持活跃。
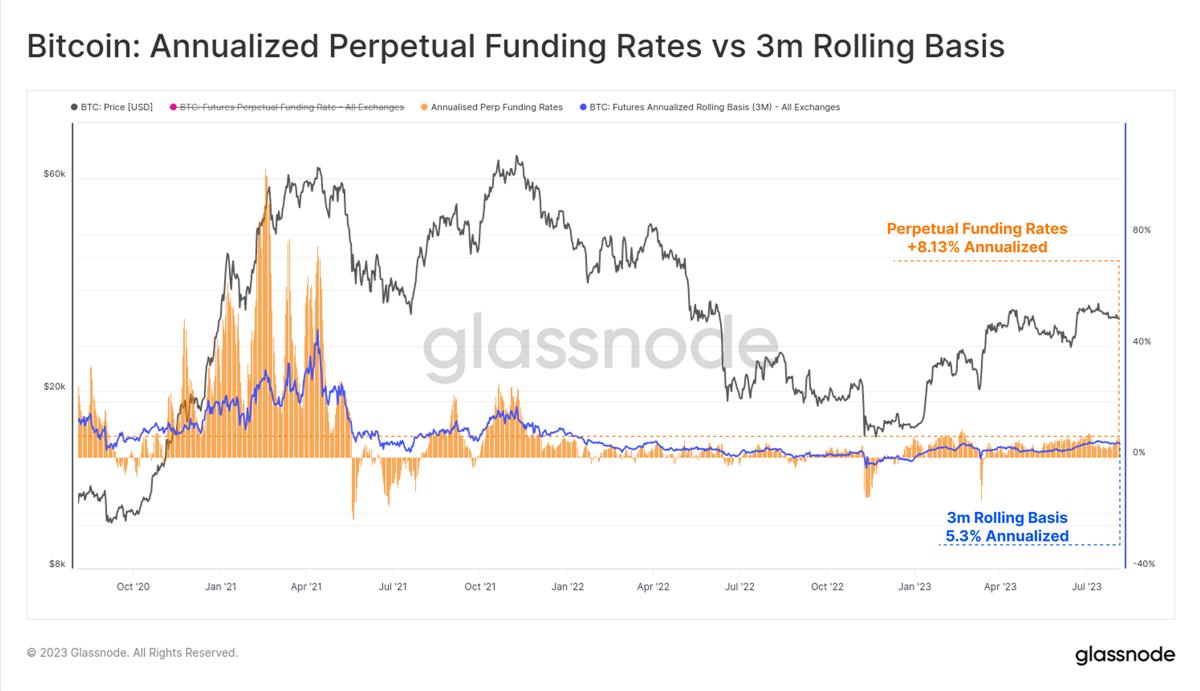
在期货市场中,期限结构表明通过现货套利策略可以获得年化收益率在 5.8% 至 6.6% 之间。然而,这只是略高于短期美国国债或货币市场基金的收益率。
永续合约市场是数字资产中最流动的交易场所,交易员和市场做市商可以锁定资金费率溢价,以套利期货和现货价格。这种现货套利形式更加波动和动态,但考虑到这种额外风险,目前的年化收益率为 8.13% ,更具吸引力。
值得注意的是,自从 2022 年底以来,资金费率一直保持稳定的正增长,这表明市场情绪发生了显著变化。
在期权市场中,我们可以看到波动率压缩的严重程度,所有合约到期的隐含波动率都降至历史低点。
比特币市场的波动性非常大, 2021-22 年大部分时间里,期权交易的隐含波动率在 60% 到 100% 以上之间。然而目前,期权定价的波动性溢价是历史上最小的,IV 介于 24% 至 52% 之间,不到长期基线的一半。
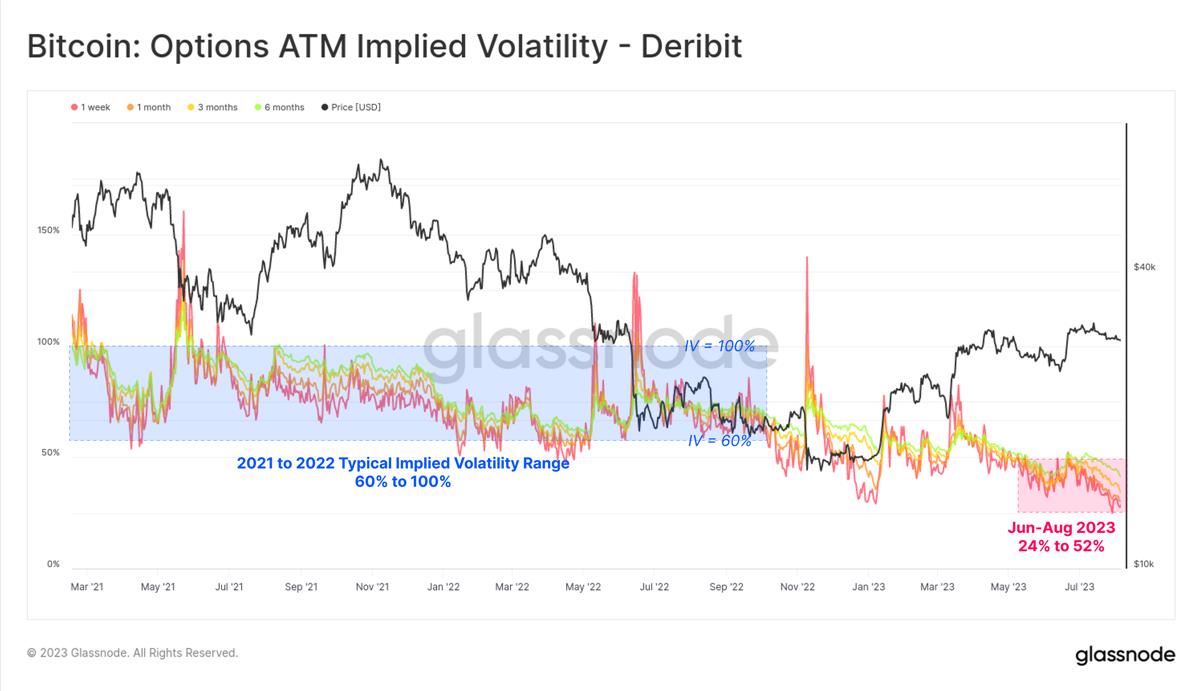
IV(隐含波动率)期限结构显示,在过去的两周中,波动率溢价正在收缩。仅在过去的两周中, 12 月合约的隐含波动率就从 46% 下降到了 39% 。到 2024 年 6 月到期的期权的波动率溢价略高于 50% ,这在历史上是相对较低的水平。
无论是在成交量还是持仓量指标上,看跌/看涨比率都处于或接近历史低位,交易区间在 0.42 至 0.48 之间。这表明市场上存在净多头情绪,对看涨期权的需求仍然占主导地位。
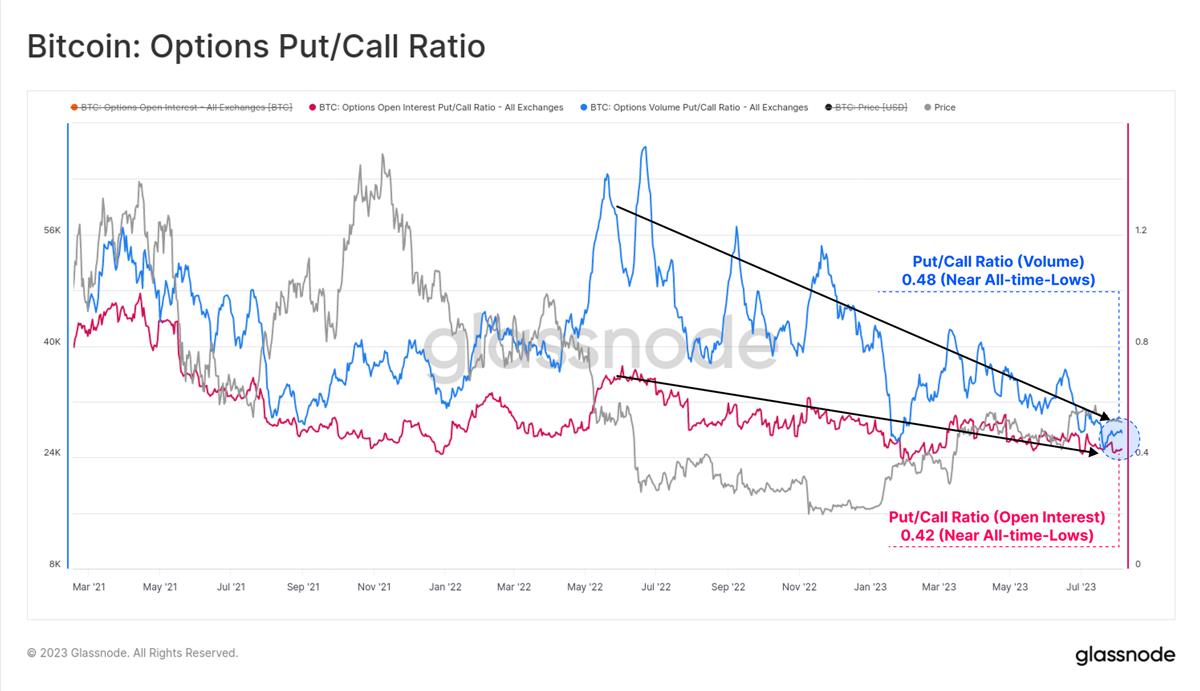
因此,相对于看涨期权而言,看跌期权变得越来越便宜,这反映在 25-delta 偏斜度指标的历史低点上。总体而言,这表明期权市场(现在规模与期货市场相当)认为未来的波动性将处于历史低位。
总结与结论
很少有新闻标题宣称比特币是一个价格稳定且非波动性的资产,这使得每月交易范围低于 10% 的情况显得异常突出。目前,市场的波动性可以说是有史以来最低的,这引发了对未来是否真的会出现加剧的波动性的质疑。
期货现金套利收益率在 5.3% 至 8.1% 之间,略高于短期美国国债的无风险利率。期权市场的隐含波动率溢价处于历史最低水平,尤其是看跌期权的需求最为清淡。
考虑到比特币的波动性,我们是否迎来了比特币价格稳定的新时代,或者波动性被错误定价了?


