Original: Medium
In this post, I show how to extract implied volatility for any asset using daily volume and liquidity information directly from a Uniswap v3 pool.
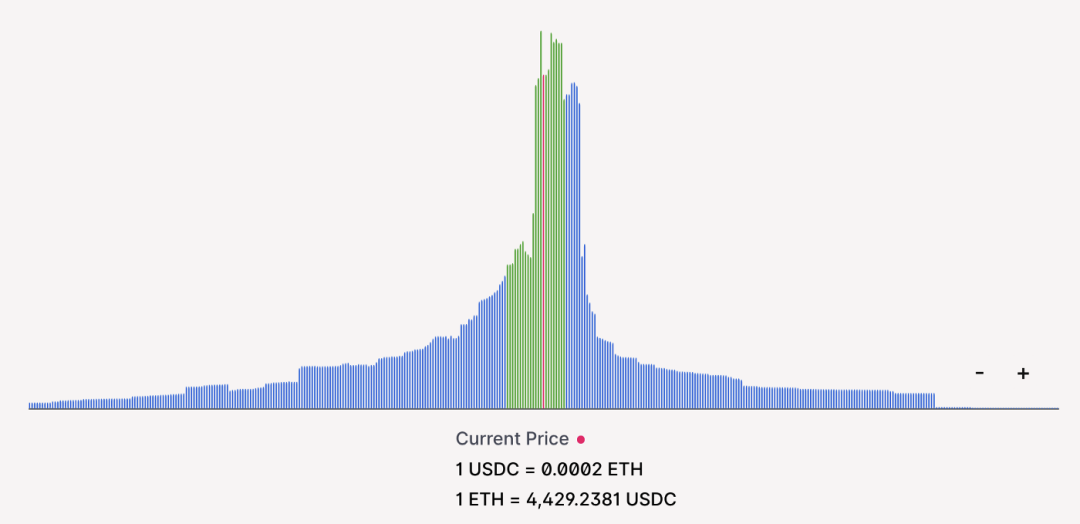
ETH-USDC-0.3% Pool liquidity. The green bar shows the 7-day expected movement, calculated using an on-chain implied volatility measure.
In my last post, I demonstrated that lending out a Uni v3 LP position as an option can be more profitable than holding it. That's because the premium received for selling options may exceed the amount of fees accrued in LP tokens. In my analysis, I came up with the following equation:
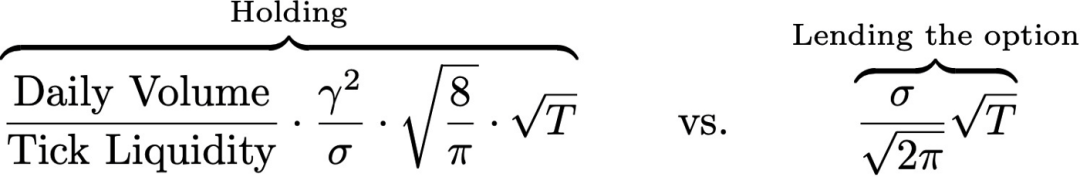
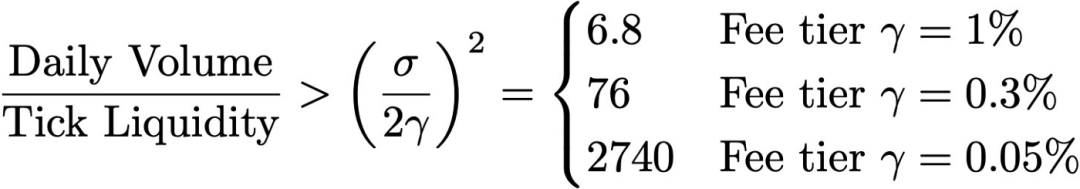
Some rearranging resulted in the following conditions to guide whether an asset should be lent or held as an option for a fee:
However, I made an unnatural assumption in my analysis: I assumed that the on-chain volatility of an asset matched the "market" volatility of the same asset on exchanged centralized options.
Specifically, I assumed annualized volatility hovering around 100% and used that number to extract ratios of 6.8, 76, and 2749. Recall that these ratios should tell you what the volume to liquidity ratio should be so that, assuming 100% implied volatility, it is more beneficial to hold LP tokens than to sell the position as an option.
I stipulate that the annualized volatility of all assets on Uniswap is 100%. For an ETH-stablecoin pair, 100% might be accurate, but for a stable-stablecoin pair, it would be a gross overestimate. Likewise, the annualized realized volatility of some highly volatile assets can be in the hundreds of percent.
general speaking:
general speaking:
The efficient market hypothesis (EMH) is an assumption in financial economics that states that asset prices reflect all available information. An immediate implication is that it is impossible to consistently "beat the market" on a risk-adjusted basis, since market prices should only respond to new information. (Source: Wikipedia)
So, given this framework, can we assume that all participants have already priced in the holding costs and expected returns of LP positions, which means we can only assume that LP returns exactly match their option premiums.
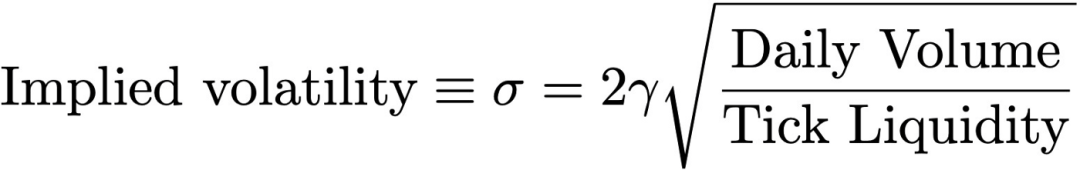
In other words, we can look at the daily volume and tick liquidity of any Uniswap v3 pool, and use the criteria I derived earlier to calculate the pool's implied volatility (IV):
first level title
1
Calculating Implied Volatility from Uniswap v3
How accurate is the assumption that all DeFi users are "rational". Depending on who you're asking, it's probably pretty low, but let's take a closer look.
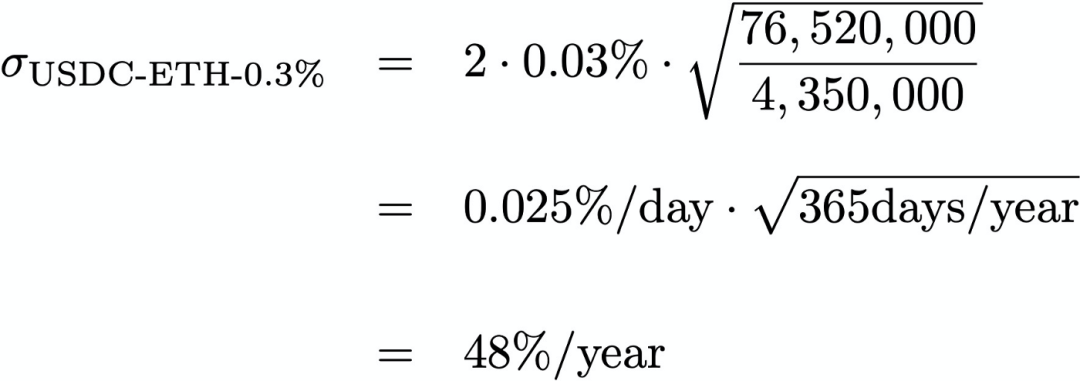
To calculate the implied volatility for the USDC-ETH-0.3% pool, we have to divide the daily trading volume (76,520,000) by the square root of the liquidity amount of the current price change (4,350,000), then multiply by 2*0.3 % and √365days Get the annualized volatility:
Here is the same implied volatility calculation by TVL for the top 15 pools in Uniswap v3:
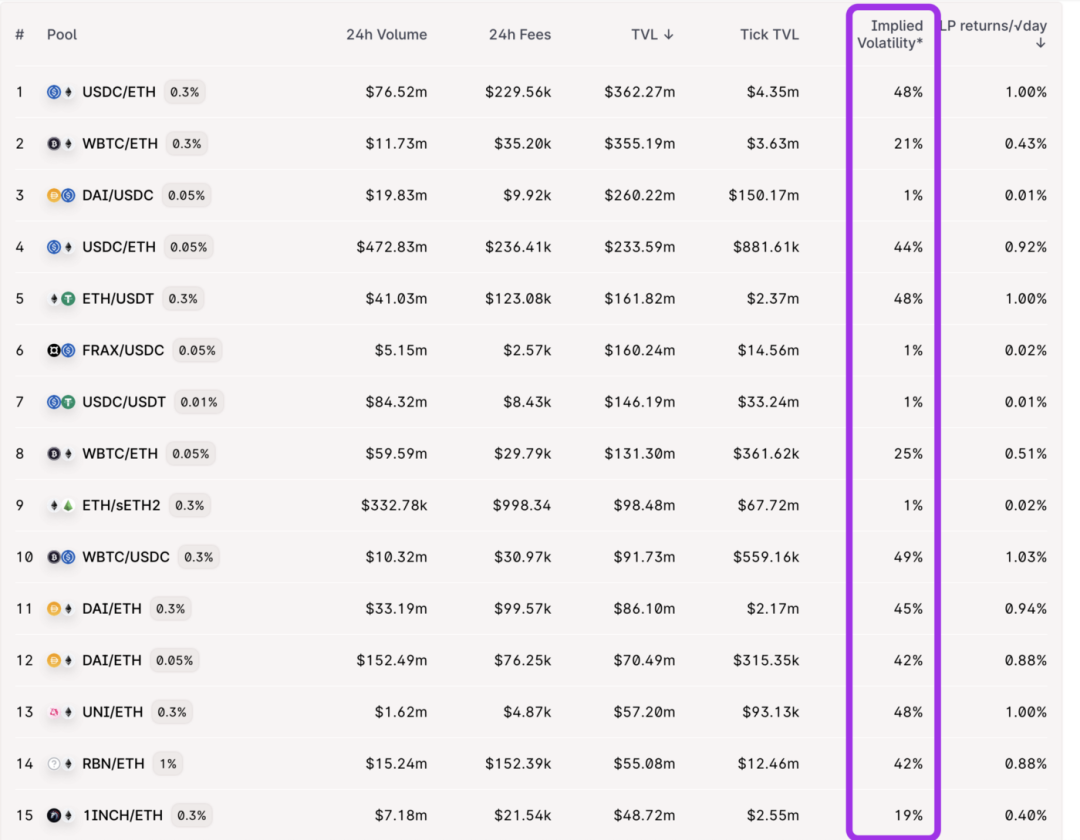
View at http://info.yewbow.org
Implied volatility ranges from 49% for the WBTC/USDC pair to as low as 1% for the stablecoin-stablecoin pair (DAI/USDC) and ETH/sETH2 pair.
2
How good is this approximation?
In a previous post, I scraped daily open-close price data from Coingecko to extract real volatility for several assets, all denominated in USDC or ETH:
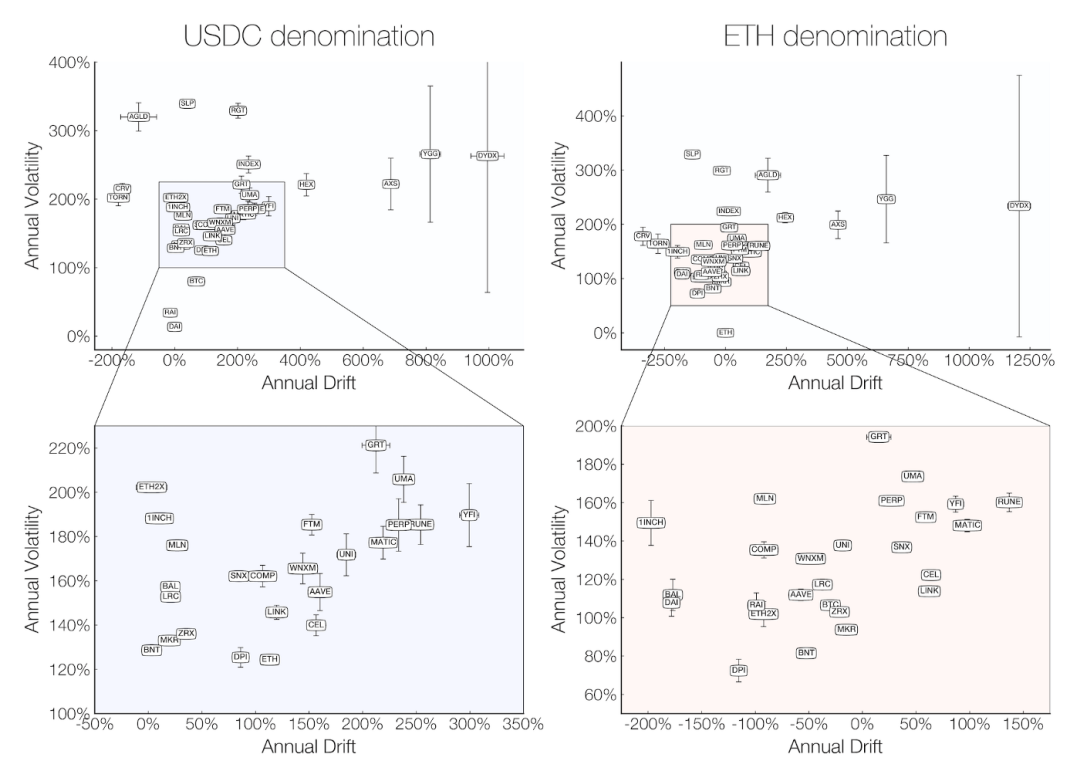
In ETH terms, realized volatility for most assets hovers between 75% and 200%. If we compare this to an IV drawn from a Uniswap v3 pool, we get:
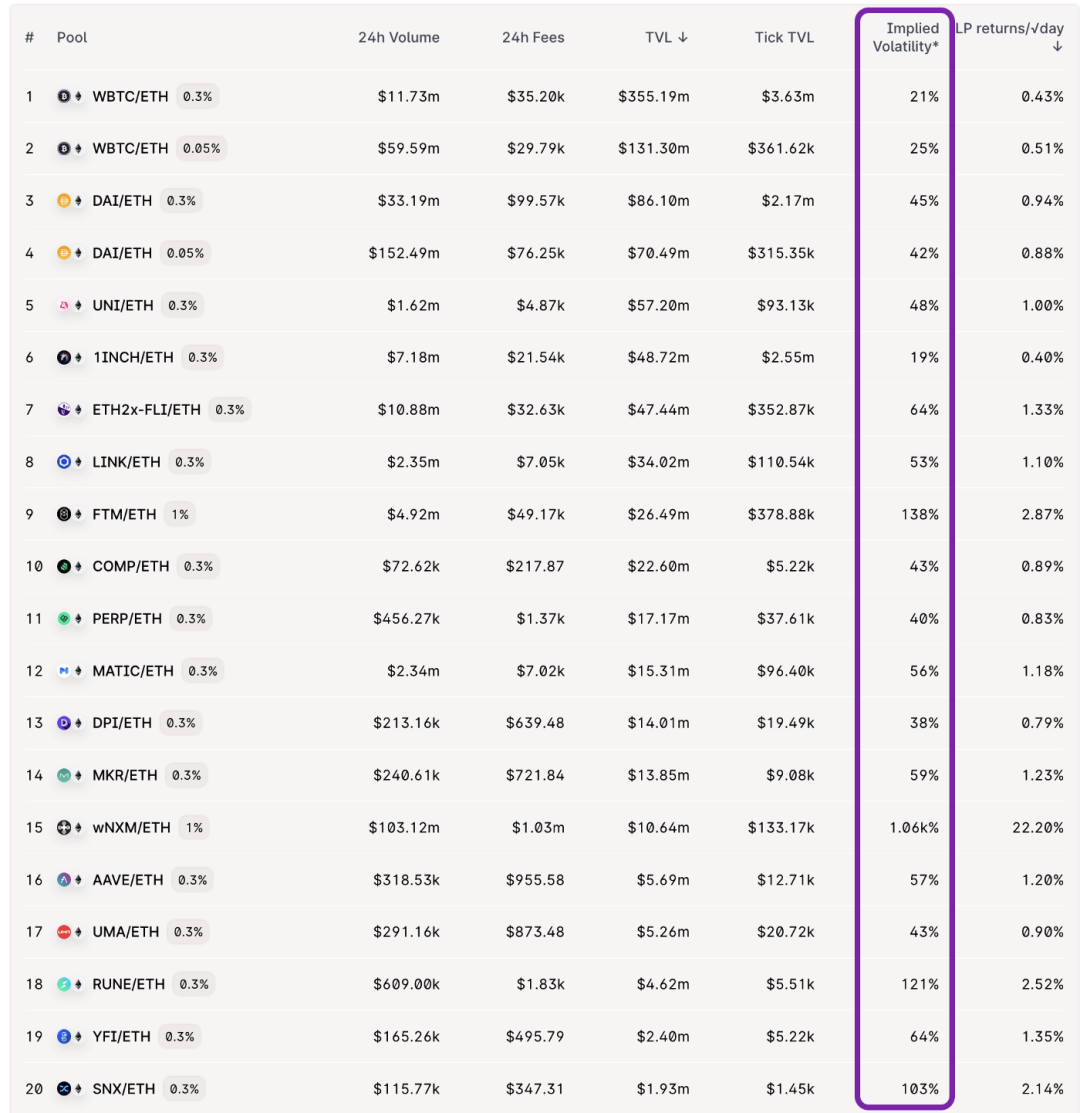
Note that for most assets the volatility is slightly lower, perhaps around 2.5x.
I'm not sure where this difference comes from. Maybe it's because DeFi users aren't all rational, or users don't trade as much on-chain compared to centralized exchanges, or maybe it's because I took this screenshot on a Sunday, and volume is just lower Low.
Additionally, WNXM appears to be an outlier with an annualized volatility of over 1,000%. This may be due to the relatively low liquidity of ticks:
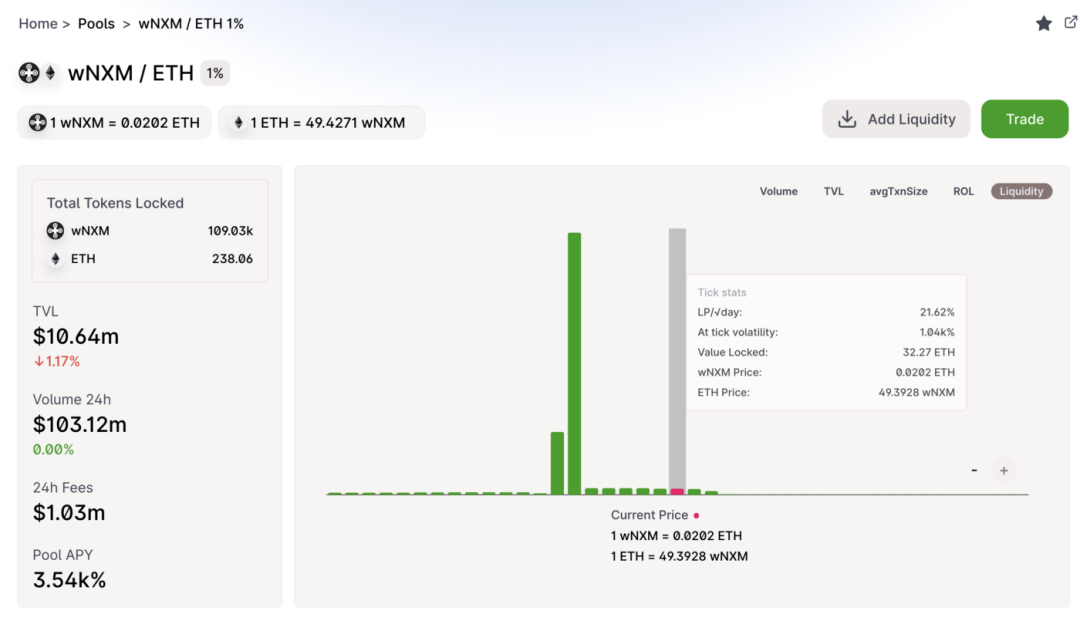
Or if there is a lot of volume for the day ($103m), I think the Uniswap theGraph instance reports 24h volume as volume combined with add+delete in liquidity tokens. A quick overview of the daily exchange volume is closer to about 1 million, which corresponds to an implied volatility of 32%/year, which is a bit more realistic.
3
Using IVs to Help Deploy Liquidity Efficiently
Why should we care about IVs? In fact, implied volatility is very useful for estimating the expected price movement of any asset:
See this post and this post for more details on choosing the best Uniswap v3 LP location. Specifically, understanding IV should also help determine where to deploy liquidity in a Uniswap v3 pool.
For example, ETH-UNI-0.3% has a total value locked of $57 million, but only ~$2 million is locked in the 7-day expected movement. In other words, an average of 96% of deployed liquidity will not be touched for the next 7 days.
The next step is to directly calculate the realized volatility per trade using on-chain data and compare it to the IV calculated using volume + liquidity.
This is a slightly more complicated problem than I expected, and I've been working on it for the past few weeks. However, along the way, I made a couple of interesting movies showing the link between exchange + liquidity + fees for some highly volatile assets:
This article comes from Tao of Yuan Universe, reproduced with authorization.
This article comes from Tao of Yuan Universe, reproduced with authorization.