标普低波指数「逆势而行」,美股要变天了?


- 핵심 의견: S&P 500 저변동성 지수가 역사상 처음으로 비정상적인 움직임(시장 하락 시 상승, 상승 시 하락)을 보이면서, 시장이 FOMO(상승 추세를 놓칠 것에 대한 두려움)와 NBO(하락장에서 빠져나오지 못할 것에 대한 두려움)라는 이중 불안에 의해 움직이고 있음을 드러냈습니다. 역사적 데이터는 이는 일반적으로 주식 시장과 기술주의 미래 부진한 성과를 예고합니다.
- 핵심 요소:
- S&P 500 저변동성 지수는 지난 6개월 동안 S&P 500이 하락한 날에는 평균 상승하고, 상승한 날에는 평균 하락하는 흐름을 보였습니다. 이러한 긍정/부정 가격 반응 조합은 1990년 이후 처음 있는 일입니다.
- 이러한 이상 현상은 투자자 심리가 양분되어 있음을 시사합니다. 상승장일 때는 FOMO로 인해 저변동성 주식을 매도하고 고위험 자산을 추격하는 한편, 하락장일 때는 NBO로 인해 저변동성 주식을 매수하여 위험을 회피하는 것입니다.
- 역사적 데이터에 따르면, 저변동성 지수의 성과 스프레드가 최하위 4분위에 속할 때, S&P 500의 향후 1주일 연평균 가격 상승률은 3.92%에 불과했으며, 이는 최상위 4분위의 17.26%에 크게 못 미치는 수치입니다.
- 저변동성 스프레드가 최하위 4분위에 있을 때, 구경제 섹터가 신경제 섹터(기술 및 통신 서비스)보다 우수한 성과를 보였으며, 투자 스타일은 방어적 자산 배분으로 전환해야 할 수 있습니다.
- 현재 기술주(예: Mag 7)의 수익성은 여전히 견고하지만, 2024년 중반 이후 시장 대비 성과는 소폭 우위에 그쳤으며, 주식 시장 변동성은 심화되고 있습니다(예: 2025년 봄 S&P 500이 약 20% 하락). 이는 위험 증가를 시사합니다.
Original Author: Jim Paulsen
Original Translation: TechFlow
TechFlow Intro: The S&P 500 Low Volatility Index has recorded an unprecedented anomaly for the first time in history: it rises when the market falls, and falls when the market rises. This unprecedented price behavior reveals the schizophrenic state of the current market—investors are torn between Fear Of Missing Out (FOMO) on the AI rally and Fear Of Not Getting Out (NBO) at the top. Historical data suggests that this signal often indicates poor performance for both the broader stock market and tech stocks in the near future.
The recent unique price action of the S&P 500 Low Volatility Index suggests investors are simultaneously caught in two anxieties: the fear of missing out (FOMO) and the fear of not getting out (NBO).
Recently, the performance of the S&P 500 Low Volatility Index has set an unprecedented record. Typically, low-volatility stocks rise less when the S&P 500 goes up and fall less when it goes down. However, over the past six months, low-volatility investments have, on average, risen on days when the S&P 500 falls, and fallen on days when the S&P 500 rises. In other words, a daily decline in the S&P 500 not only allows defensive low-volatility stocks to outperform by "falling less," but directly pushes their prices higher; conversely, on S&P 500 up days, low-volatility stocks haven't just underperformed, but have actually declined in price.
In my view, this recent unprecedented and extreme price action in the S&P 500 Low Volatility Index suggests investors are simultaneously gripped by the dual anxieties of Fear Of Missing Out (FOMO) and Fear Of Not Getting Out (NBO). Historically, this kind of price behavior in low-volatility stocks often serves as a warning sign for the broader stock market and technology stocks.
What is the S&P 500 Low Volatility Index?
The S&P 500 Low Volatility Index is designed to measure the performance of the 100 least volatile stocks in the S&P 500. The index comprises various defensive securities, including high-quality stocks with stable earnings, safe dividends, and low price beta. It is a typical buy for fearful investors and something to be quickly sold during bullish periods. It is specifically designed to rise less during bull markets and fall less during bear markets, catering to conservative investors who want to participate in the market but fear not getting out in time.
But what does it mean when low-volatility investments rise on down days and fall on up days? In my view, this paints a picture of a market driven not by excessive bullishness or bearishness, but by investors simultaneously fearing FOMO and NBO. Excessive bullishness leads low-volatility stocks to underperform, while excessive bearishness makes them winners. But when the dual fears of FOMO and NBO are prominent simultaneously, low-volatility stocks paradoxically "rise" on down days and "fall" on up days. With FOMO and NBO coexisting, market up days see buying in high-risk stocks accompanied by selling in low-volatility stocks; market down days simultaneously trigger selling in high-risk stocks and buying in low-volatility stocks.
Performance of the S&P Low Volatility Index on S&P 500 Up and Down Days
Chart 1 shows the average daily percentage price change of the S&P 500 Low Volatility Index over rolling 6-month periods on all S&P 500 up days (blue line) and down days (red line) since 1990. As shown, in almost all rolling six-month periods, the average percentage price change of the S&P 500 Low Volatility Index is positive when the S&P 500 rises, and negative when the S&P 500 falls.
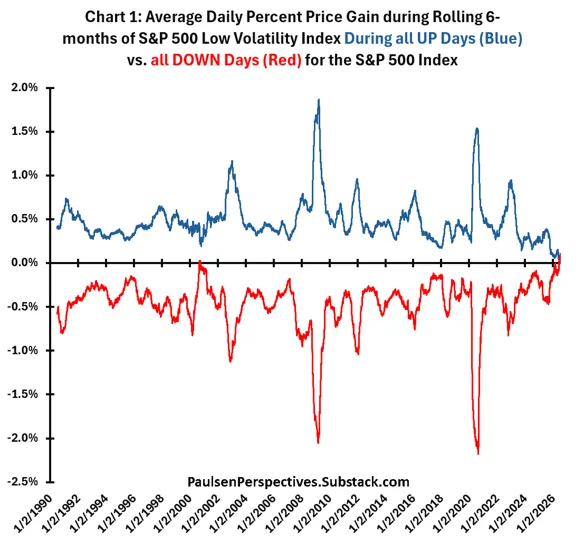
Except for the current situation, only briefly in 2000 was the rolling six-month percentage price change of the low volatility index "positive" during S&P 500 daily up days, and it has never shown a "negative" reading during S&P 500 daily down days. Although the low volatility index almost always underperforms during S&P 500 up markets and outperforms during S&P 500 down markets, aside from the current era, it has never risen on all S&P 500 down days and fallen on all S&P 500 up days in the past six months. In other words, over the last six months, the performance of the S&P 500 Low Volatility Index has been "unique" compared to any other period since 1990—it has, on average, risen on all S&P 500 down days (red line) and fallen on all S&P 500 up days (blue line) over the past six months! This could reflect a milestone, or at least a very rare, investor mindset or sentiment driving the stock market—my guess is the FOMO/NBO combination.
Historical Average Performance of Low Volatility Index on Up Days Minus Down Days
Chart 2 illustrates this unique shift in the performance of the S&P 500 Low Volatility Index from a slightly different angle. It shows the average performance difference of the low volatility index over the past 26 weeks between all S&P 500 up weeks and all S&P 500 down weeks. This is essentially the difference between the red line and blue line in Chart 1. As shown, in the current era, this difference is "uniquely" negative (meaning the low volatility index rises less during S&P 500 up periods than it does during S&P 500 down periods).
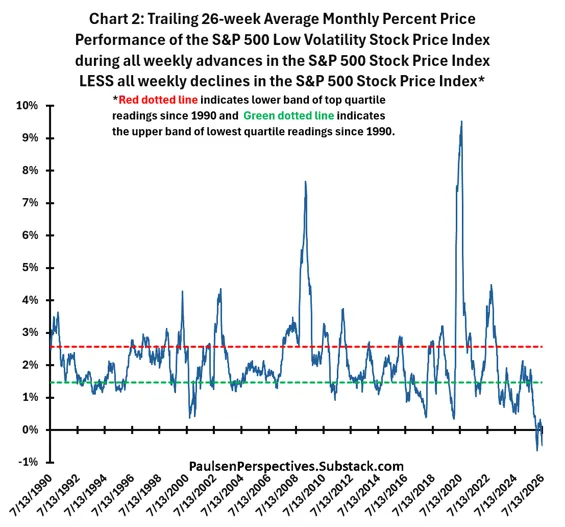
While this performance spread has never been negative like today, it has frequently fallen into the lowest historical quartile (i.e., below the green dashed line) near several major stock market peaks—such as mid-2000, 2007, 2018, early 2020, and late 2021. It has also often surged to the highest quartile (above the red dashed line) near several major stock market bottoms—such as early 1991, late 2002, March 2009, mid-2020, and late 2022.
FOMO/NBO and Future S&P 500 Performance
What does the performance difference of the S&P Low Volatility Index on S&P 500 up days minus down days imply for the future performance of the overall S&P 500? Chart 3 highlights that, since 1990, the average annualized price return of the S&P 500 over the next week has been highly sensitive to the quartile of the low volatility spread difference. When the low volatility spread is in the highest quartile (i.e., above the red dashed line in Chart 2), the future average annualized price return for the S&P 500 is a robust 17.26%. When the spread is in the middle two quartiles, the average annualized return over the next week falls to 10.12%. Finally, when the low volatility spread is in the lowest quartile, the average annualized price return for the S&P 500 over the next week plummets to a disappointing 3.92%.
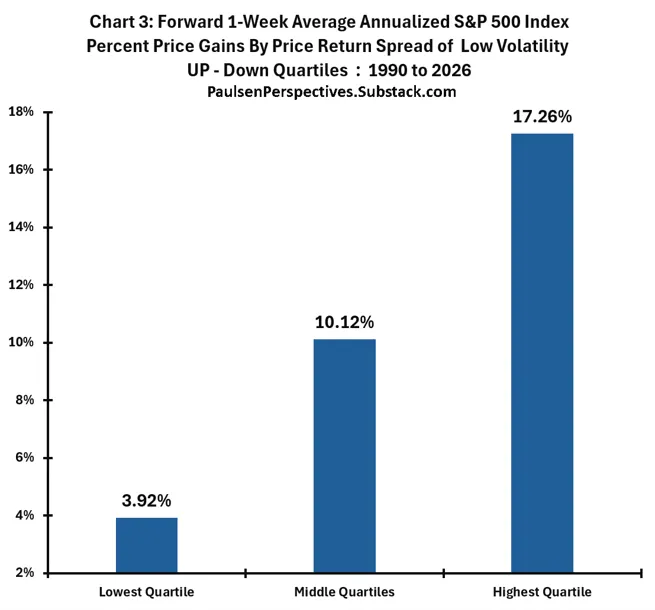
Clearly, the performance difference of the low volatility index during overall market upswings and downswings has historically been important for the future performance of the S&P 500. Essentially, as long as low-volatility investments perform significantly better in up markets than in down markets, the S&P 500 typically delivers solid results. However, when low-volatility investments perform better on market down days relative to up days, the future performance of the S&P 500 usually struggles.
Overall, I believe this indicator serves as a proxy for investor mindset. The performance of low-volatility investments shows the degree of importance investors place on risk aversion. When low-volatility investments begin to perform much better in down markets than in up markets, it indicates that investors are placing a higher premium on capital preservation—meaning their biggest fear is not getting out in time. And in the unique position we are in today—where low-volatility prices are negative on up days because FOMO leads investors to sell them for riskier alternatives, and positive on down days because falling markets genuinely scare investors about NBO—it suggests a near-schizophrenic anxiety mindset is driving the stock market.
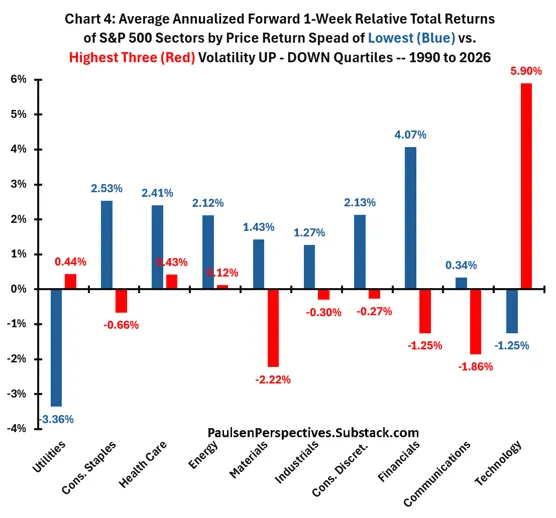
Finally, Chart 4 shows the performance of the ten major S&P 500 sectors since 1990 (Real Estate is excluded due to its shorter history) when the low volatility performance spread is in the lowest quartile (blue bars) versus when it is in the top three quartiles (red bars). Except for the Utilities sector, the results from the lowest quartile are particularly favorable for the Old Economy sectors of the S&P 500, while the New Economy sectors (i.e., Technology and Communication Services) tend to perform much better when the low volatility performance spread is in the top three quartiles. Therefore, if the low volatility spread remains in the bottom quartile, based on historical experience, investors should not only expect the S&P 500 to underperform but should also consider increasing exposure to Old Economy sectors and be more cautious with overweight positions in Technology and Communication Services.
Final Thoughts
This is the first time in this bull market that the New Economy trade has shown cracks. Although Technology/Communications sectors continue to lead the stock market and have received a significant boost recently from the AI narrative, market volatility has increased—as evidenced by the S&P 500's nearly 20% decline in the spring of 2025 and its nearly 10% decline in the first quarter of 2026. Despite earnings results—especially from New Economy companies—remaining stellar, the performance of S&P 500 Tech stocks and the Mag 7 index has only marginally outperformed the broader market since mid-2024. Furthermore, for the first time in this bull cycle, "broader market plays" like small-cap stocks, value stocks, and international stocks have been performing more closely in line with New Economy stocks over the past year.
Investor sentiment indicators show that investors are neither excessively enthusiastic nor extremely pessimistic. The CNN Fear & Greed Index is slightly below average, while the AAII Sentiment Survey is slightly above average.
No one wants to miss out on the AI takeover (FOMO?), but many are also increasingly uneasy about high valuations, concentrated holdings, and wildly aggressive future expectations for earnings (NBO?). The result? The performance spread between up days and down days for the low volatility index is negative for the first time in history, reflecting a stock market that seems increasingly and perhaps schizophrenically driven by both FOMO and NBO! This suggests investors may need to exercise caution in the coming months.