
8만 달러의 비트코인: 회복은 확실하나, 상승장 신념은 아직 부족
- 핵심 의견: 비트코인이 8만 달러 위로 반등한 것은 ETF 자금 유입, 현물 수요 증가 및 포지션 개선 덕분이지만, 자본 유입 강도가 약하고 8만 6천 달러 부근의 공급 압박으로 인해 시장 신뢰가 아직 이전 강세장 수준으로 회복되지 않았음을 시사합니다. 현재는 돌파적 상승보다는 구조적 회복에 더 가깝습니다.
- 핵심 요소:
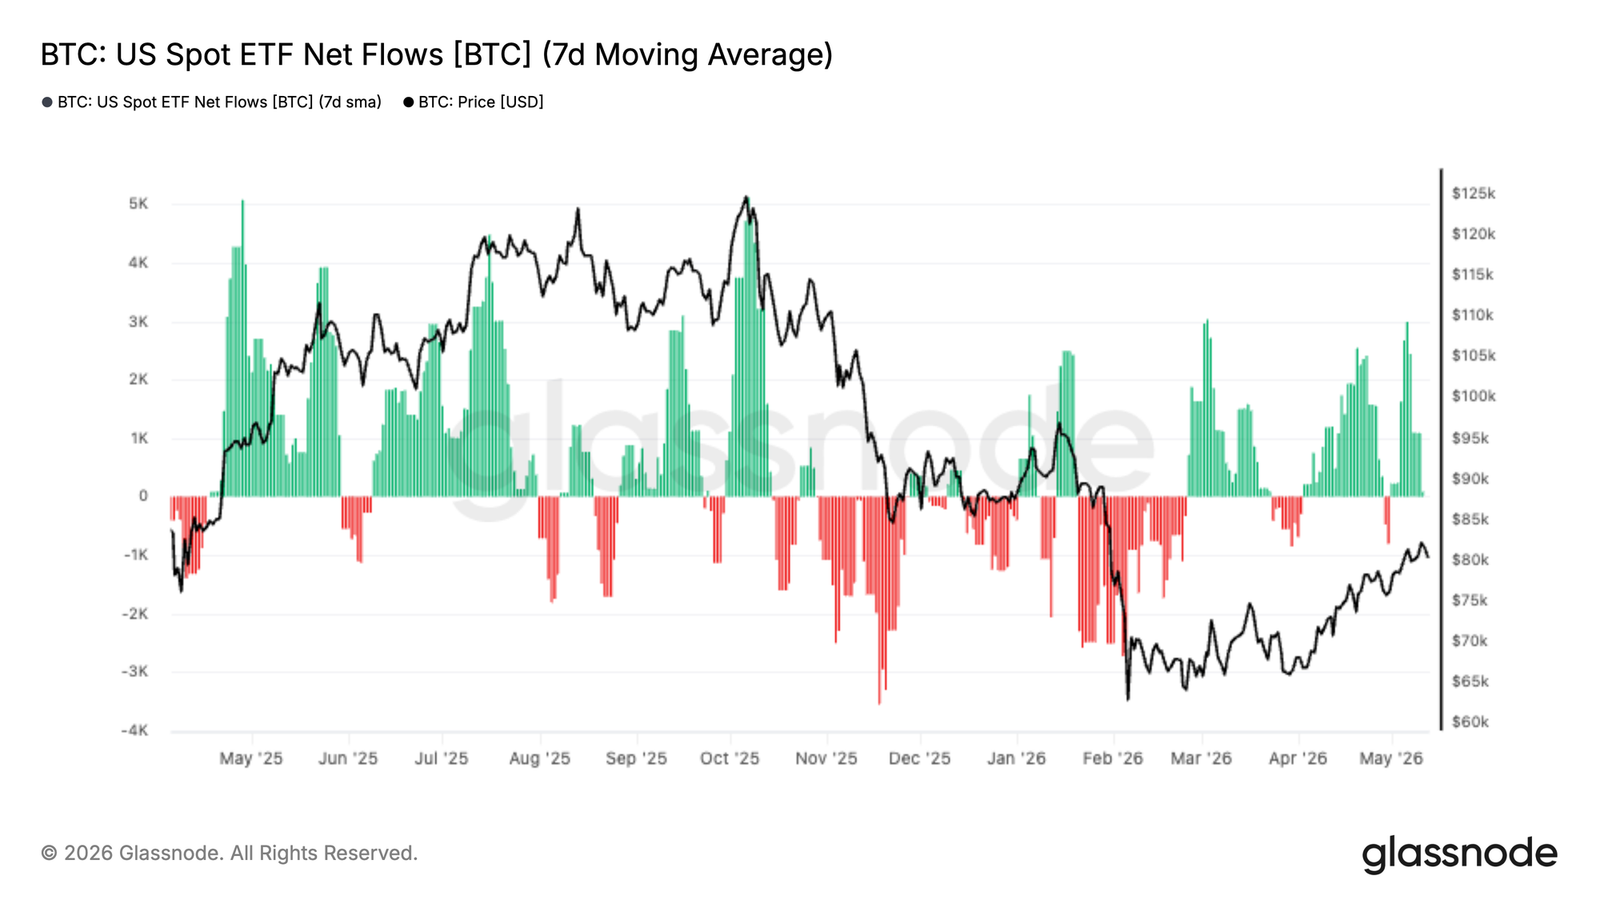
- 미국 현물 비트코인 ETF로의 자금 유입이 명확한 플러스로 전환되어 기관 수요가 다시 살아나고 있지만, 규모는 여전히 이전 강세장 단계의 월 100억 달러 이상 수준에 미치지 못해 자본 유입 강도가 부족함을 보여줍니다.
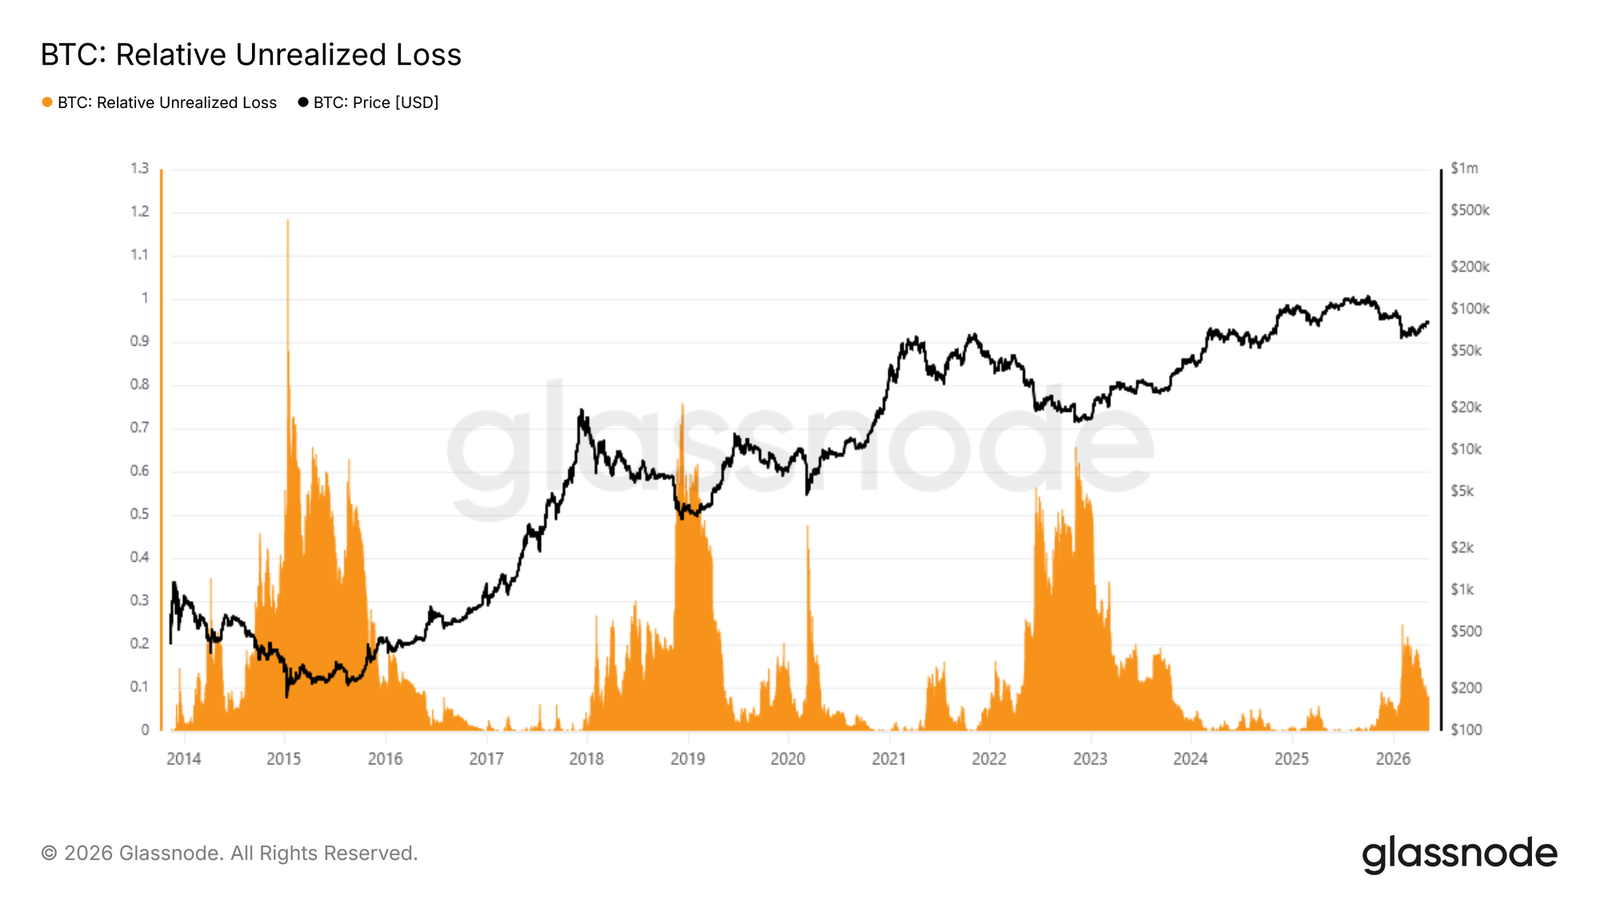
- 상대 미실현 손실은 2월 매도 국면에서 시가총액의 25%까지 정점을 찍었다가 이후 8%로 축소되었으며, 6만 달러가 지지된다면 이번이 얕은 약세장이라는 관점을 뒷받침합니다.
- 30일 코스트 베이스(원가 기준)인 7만 6900달러는 단기 지지선을 형성하는 반면, 11월부터 2월까지의 축적 구간인 8만 6900달러는 최근의 주요 저항선으로 위쪽의 무거운 공급 압박을 반영합니다.
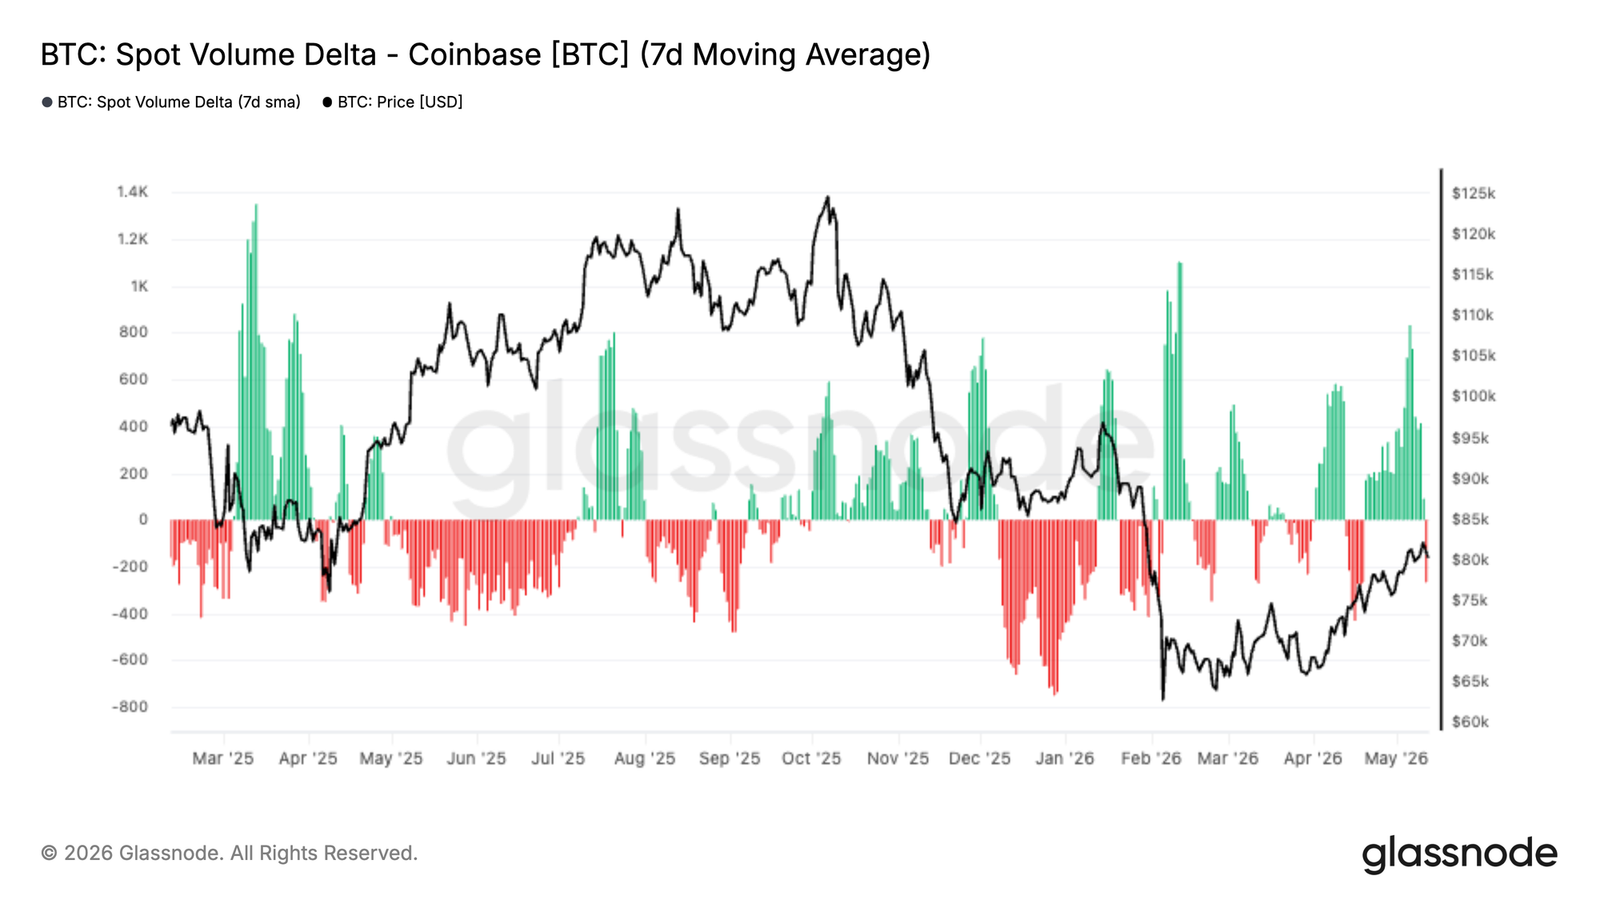
- 코인베이스 현물 거래량 델타가 긍정적으로 상승하며 ETF 자금 유입과 동조화되어, 미국 내 및 기관 매수자들이 다시 참여하고 있음을 나타내며 현물 수요가 증가했습니다.
- 내재 변동성이 지속적으로 압축되고 Skew(변동성 차이)가 정상화되어, 시장이 보다 평온한 단기 국면을 가격에 반영하고 있으며 하락 헤징 수요가 줄어 선물 옵션 구조가 더 균형을 이루고 있음을 시사합니다.
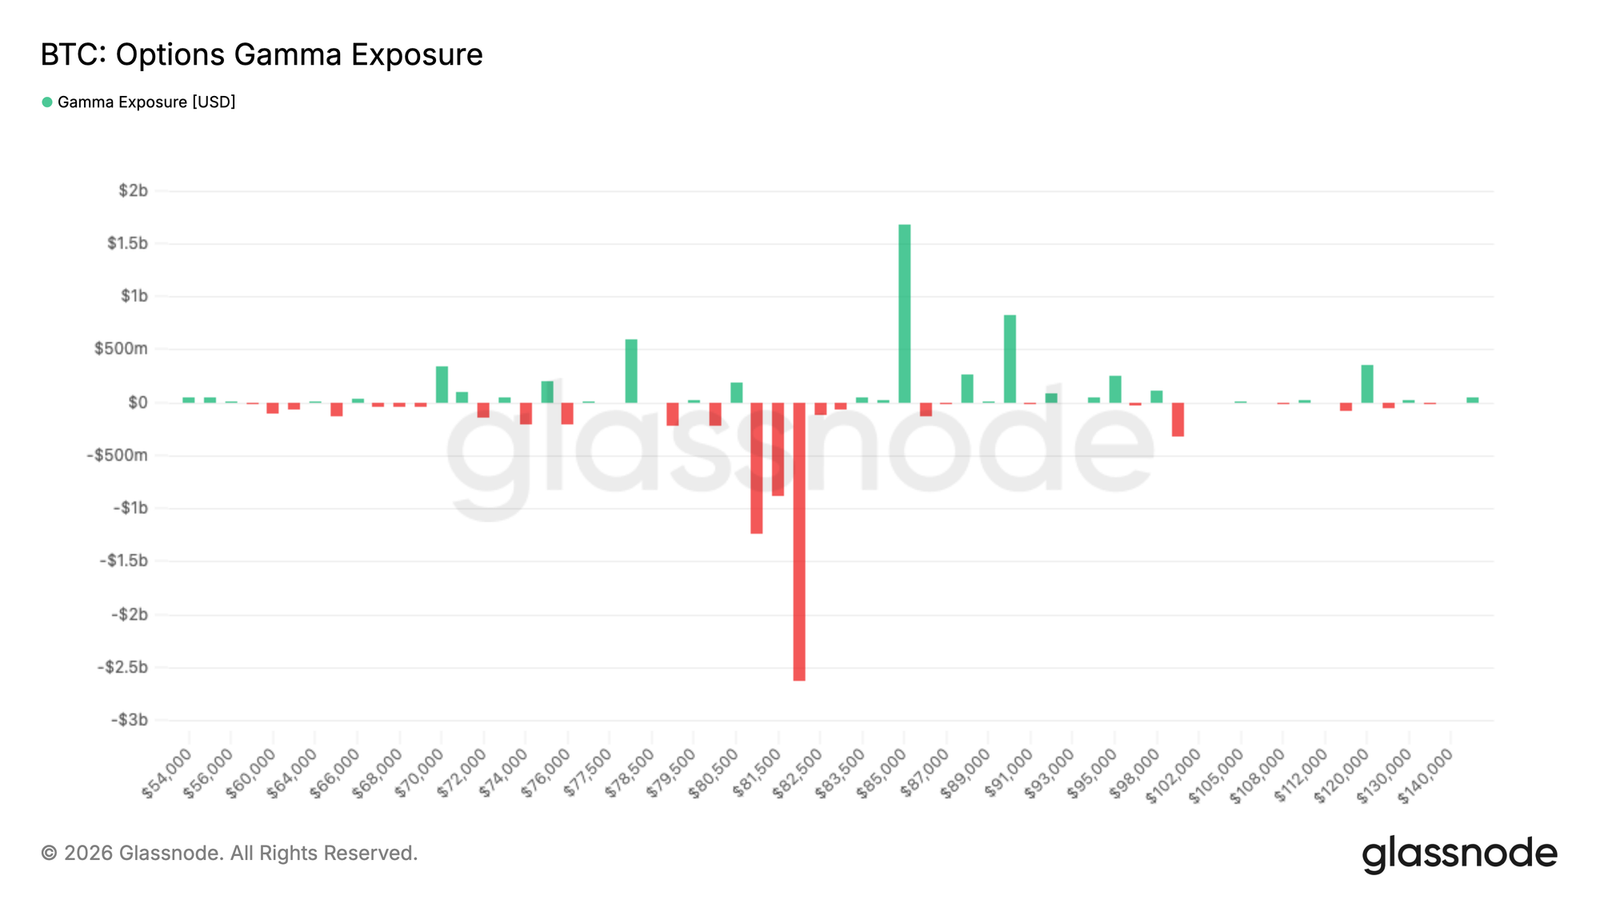
- 마켓 메이커 포지션의 경우, 8만 2천 달러 부근에 상당한 네거티브 감마 클러스터가 존재하여, 현물이 다시 이 영역에 진입할 경우 가격 변동성을 증폭시켜 단기 민감도를 높일 수 있습니다.
Original Author: Glassnode
Original Translation: AididiaoJP, Foresight News
Bitcoin has returned above $80,000, with improvements in ETF inflows, spot demand, and positioning. However, weak capital inflows and heavy overhead supply near $86,000 continue to keep market conviction below levels seen in previous bull market phases.
Summary
- Inflows into US spot Bitcoin ETFs have turned decisively positive again, with institutional demand reigniting as Bitcoin recovers from the mid-$60,000s to the low $80,000s.
- Bitcoin's Relative Unrealized Loss peaked at 25% of market cap during the February sell-off, before compressing to 8% after reclaiming $80,000. This supports the view that the correction remains a shallow bear cycle, provided $60,000 holds.
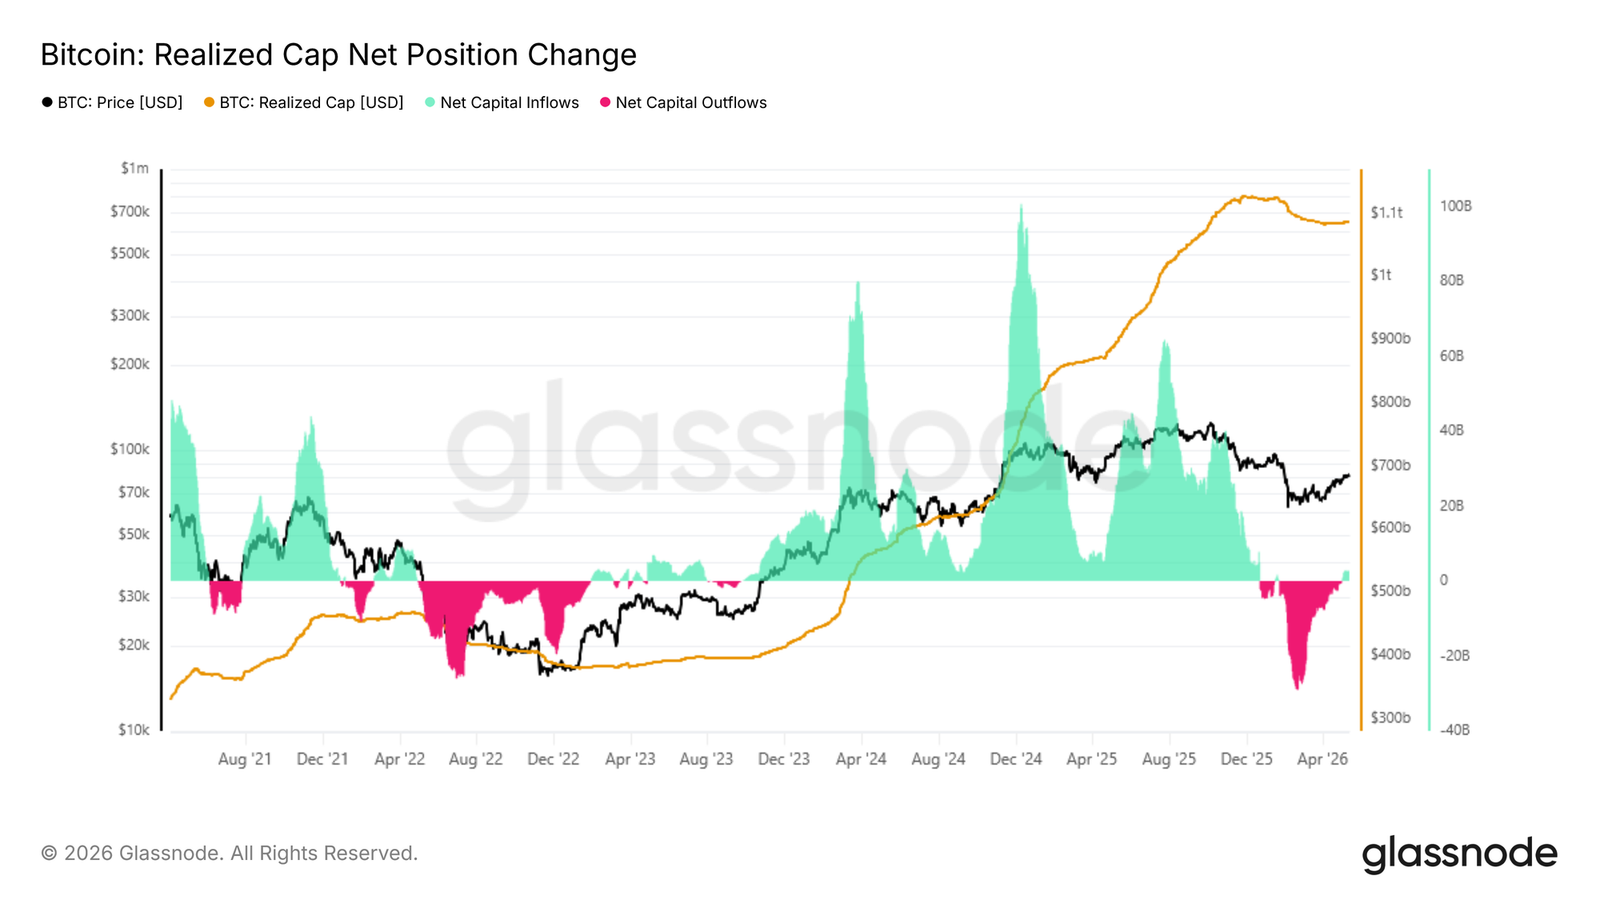
- The 30-day net position change in Realized Cap has recovered to $2.8 billion per month, indicating improving capital inflows, though still well below the >$10 billion monthly levels seen during previous bull market expansions.
- The 30-day cost basis sits at $76,900, offering immediate short-term support, while the $86,900 level, representing the accumulation zone from November to February, remains a key near-term resistance for the recovery.
- Coinbase Spot Volume Delta has turned sharply positive over the past two weeks, signaling increasingly aggressive buyer activity and strengthening spot market demand.
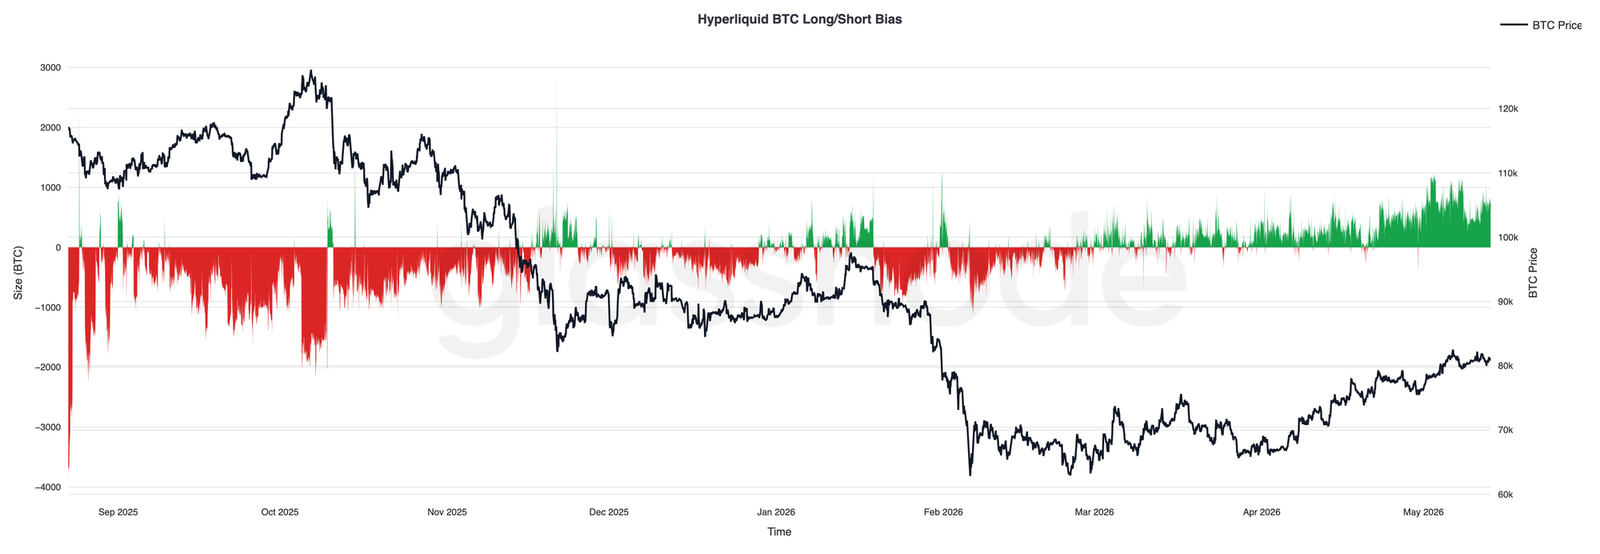
- Hyperliquid traders have steadily rebuilt long exposure as prices rise, reflecting improving speculative sentiment and growing confidence in further upside continuation.
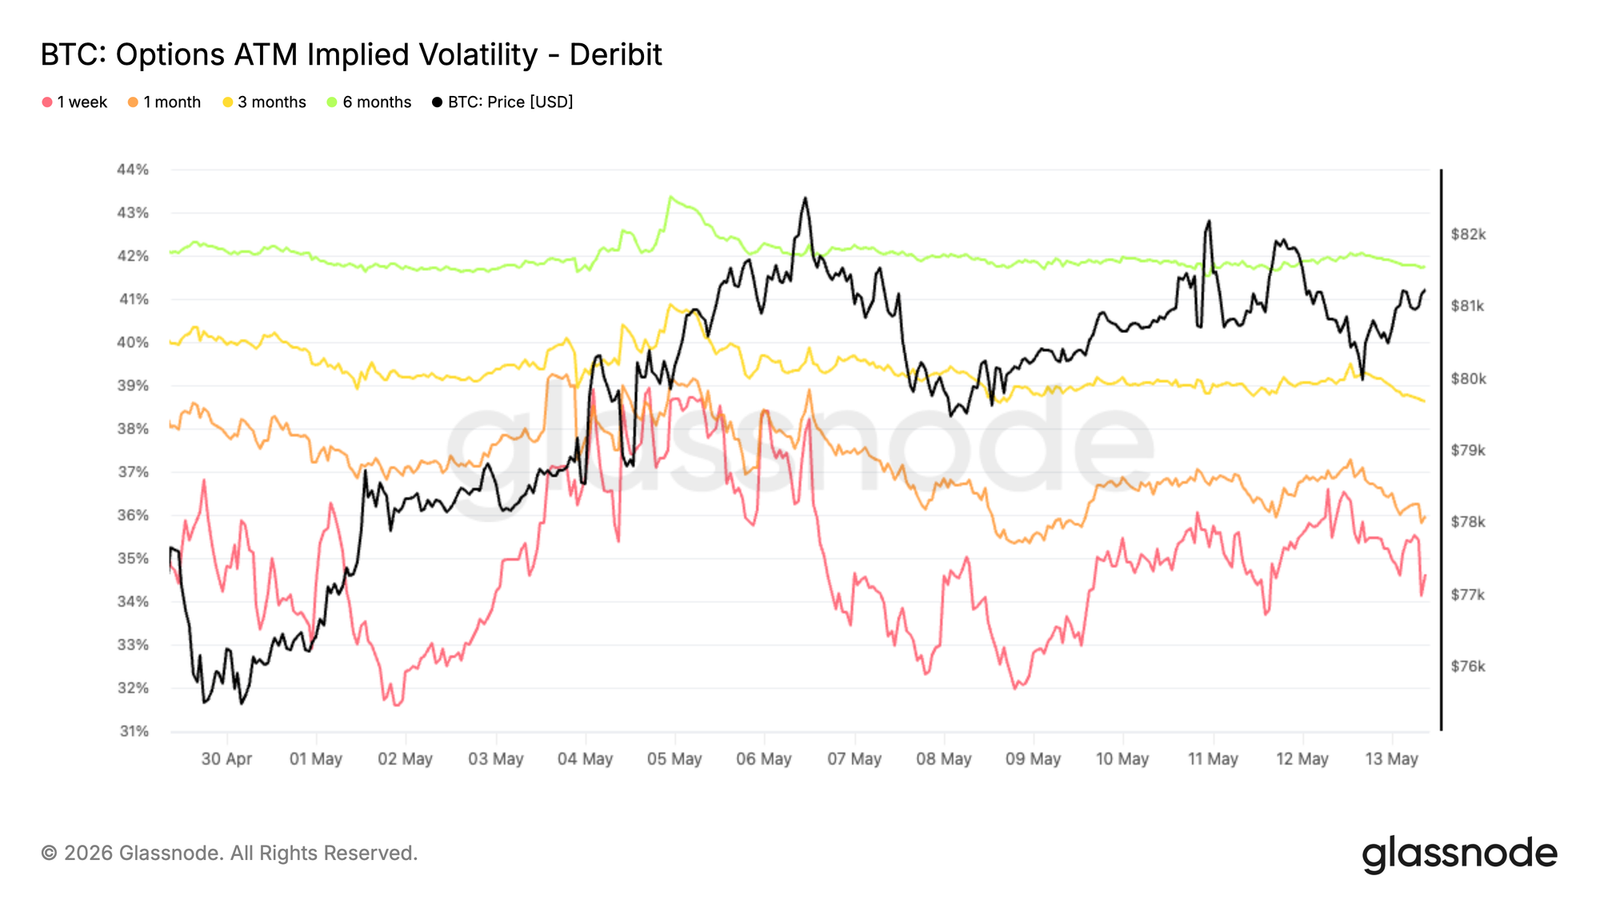
- Implied volatility continues to compress across all tenors of the curve, led by the front end, while realized volatility trends lower, with the market pricing in a calmer short-term environment.
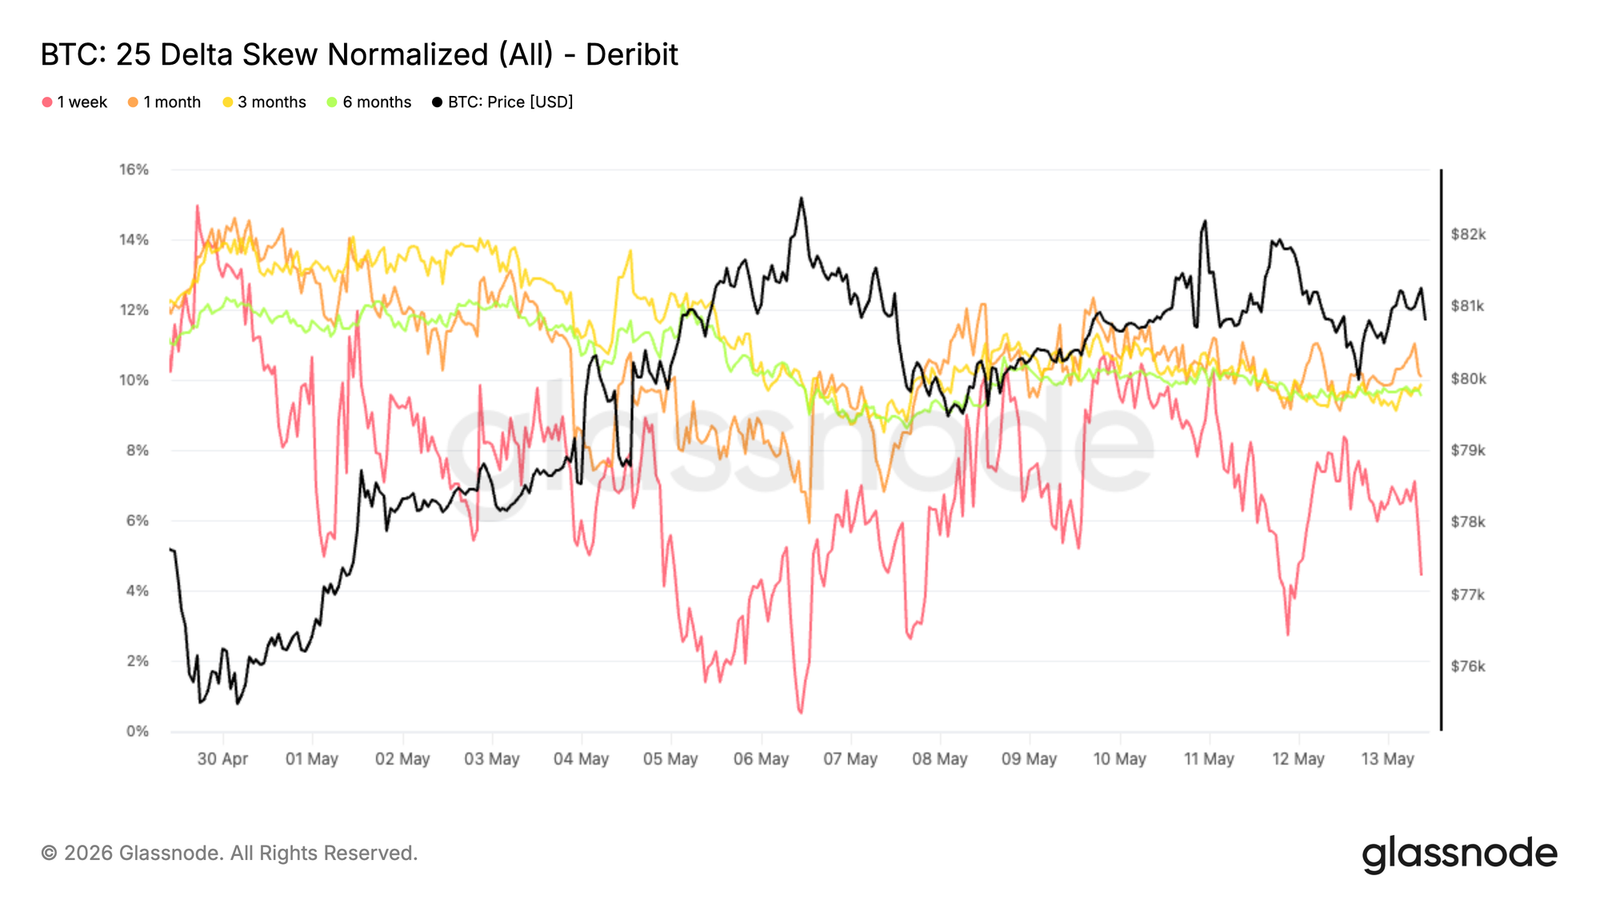
- Skew compression suggests reduced demand for downside hedges, with options structures around $80,000 becoming more balanced.
- Market maker positioning remains a key driver of short-term dynamics, with a large negative gamma cluster near $82,000 still capable of amplifying price moves if spot re-enters that zone.
Macro Insights
The macro backdrop remains a tug-of-war between slowing economic growth and sticky inflation. Recent US inflation data has come in stronger than expected, while the labor market has proven more resilient than many anticipated. Consequently, the market has pushed back expectations for rate cuts, keeping Treasury yields elevated and financial conditions relatively tight.
Liquidity remains a key driver for risk assets. Equities continue to grind higher, but the environment beneath the surface remains fragile as the market adjusts to a higher-for-longer interest rate reality. Meanwhile, strength in oil and commodities continues to fuel inflation expectations, particularly against a backdrop of ongoing geopolitical tensions.
For digital assets, the picture remains constructive but selective. Despite tighter liquidity conditions and a strong US dollar, Bitcoin has shown resilience, suggesting underlying demand remains intact. However, soft ETF inflows and high real yields imply that a more sustained move higher may require easier financial conditions or a new catalyst to reignite broader risk appetite.
On-Chain Insights
From Fear to Uncertainty
Against a macro backdrop of sticky inflation, high Treasury yields, and tighter financial conditions, Bitcoin continues to display relative resilience, suggesting underlying demand remains intact even as the broader risk environment remains unsettled. To assess the cycle's position structurally, the Relative Unrealized Loss—measuring the total dollar value of unrealized losses held by all investors as a percentage of market cap—provides a precise cyclical barometer. During the February flash crash, this metric peaked at 25% of market cap, a reading indicating significant stress but still far from the extreme levels recorded in previous bear cycles. After subsequently reclaiming $80,000, the metric has compressed to around 8%, a shift that has moved mainstream sentiment from fear to uncertainty rather than outright capitulation.
If $60,000 proves to be the cycle low, then this bear market would be the shallowest on record—registering fear but far from the broad washout that historically marks durable cycle bottoms.
Scale of Capital Inflows
As sentiment shifts from fear to uncertainty, the key question is whether the current rally is a typical bear market bounce or an early phase of a genuine bullish transition. The most direct measure is to observe net capital inflows, tracked via the 30-day net position change in Realized Cap, which monitors the monthly change in total capital stored on-chain. With the recent rally to $82,000, this metric has reached $2.8 billion per month, a positive reading explaining the constructive momentum of recent weeks.
However, context is crucial: during the early stages of each major upswing in the 2023-2025 bull market, this metric rapidly accelerated from roughly $2 billion to over $10 billion per month. While encouraging, the current reading remains well below that threshold, indicating that the capital inflows underpinning this recovery lack the conviction seen at similar inflection points in prior cycles.
Support and Resistance Through the Lens of Cost Basis
Despite a 37% rally from $60,000 to $82,000, capital inflows remain moderate and uncertainty persists. The Realized Price metric, segmented by holding period, offers a granular framework for identifying the most immediate support and resistance levels. This model tracks the average acquisition price of coins based on their holding duration, mapping behavioral anchors of different investor cohorts onto the price chart.
The momentum of the current rally is primarily driven by the accumulation wave of the past 30 days. The cost basis for this cohort currently sits around $76,900, forming the most immediate short-term support floor. Above, the cost basis for investors who accumulated during the November-to-February consolidation zone is concentrated near $86,900. As these holders approach breakeven and face increasing incentives to distribute, this represents the most likely near-term resistance zone.
Off-Chain Insights
Rebuilding ETF Demand
Inflows into US spot Bitcoin ETFs have turned decisively positive in recent weeks, with consistent inflows returning as Bitcoin reclaims the $80,000 level. After months of uneven demand and significant outflows in the first quarter, this latest shift indicates that institutional demand is beginning to re-emerge in a more meaningful way.
Importantly, the recovery in ETF demand has been sustained rather than driven by a single wave of allocation, suggesting institutions are steadily accumulating as market conditions improve. Inflow intensity has also accelerated alongside price, reinforcing the view that traditional capital is again supporting momentum rather than exiting during rallies.
Relative to earlier this year, the current structure shows a significant improvement in market dynamics. ETF inflows now act as a tailwind rather than a source of persistent selling pressure, removing one of the key headwinds that previously constrained recovery attempts. If sustained, continued institutional accumulation could provide the demand base needed for Bitcoin to challenge higher overhead supply zones in the coming weeks.
Coinbase Spot Buying Reaccelerates
Coinbase spot volume delta has turned sharply positive over the past two weeks, with aggressive buyer activity returning as Bitcoin reclaims the low $80,000s. This latest shift marks a stark contrast to the persistent selling pressure that characterized most of the first quarter, where negative volume continuously reinforced downward momentum.
Importantly, the recent move higher has been accompanied by repeated increases in positive spot buying volume, rather than isolated buying spikes, suggesting sustained demand is beginning to absorb overhead supply. The strengthening of Coinbase activity is also highly consistent with the recovery in ETF inflows, indicating that US-based and institutional buyers are re-engaging.
The current structure suggests that spot demand is once again acting as a supporting force for price, rather than a source of distribution. Continued strength in Coinbase buyer flow, especially when rising in tandem with ETF inflows, indicates improving market conviction and a healthier underlying demand profile for the latest rally.
Hyperliquid Traders Increasingly Bullish
Over the past few weeks, positioning on Hyperliquid has become increasingly biased towards longs, with net BTC exposure steadily rising as Bitcoin recovered to the low $80,000s. This shift marks a significant reversal from the persistent short bias that dominated most of the first quarter, when the market dropped to the low $60,000s.
Importantly, the recent increase in long exposure has been a gradual development rather than a surge from a single crowded position, indicating that traders are methodically rebuilding directional bullish exposure as market conditions improve. Net positioning is now approaching its strongest bullish bias since late 2025, reflecting growing confidence in upside continuation.
Sustained long positioning alongside the rising price action indicates improving trader sentiment and a more constructive speculative backdrop, although increasingly crowded long exposure could make the market more sensitive to short-term volatility and liquidation-driven pullbacks.
Implied Volatility Declines
Over the past week, Bitcoin implied volatility has trended lower, with the front month falling from 39% to 34.6%. Longer tenures followed suit, declining by approximately 1 to 2 volatility points across the curve.
This move reflects a general repricing lower across the term structure, as traders reduce their expectations for near-term realized volatility. The decline follows a recent volatility spike and has been accompanied by more controlled spot action, reinforcing the view that the market is returning to calmer conditions.
As implied volatility compresses, the cost of options across various tenors decreases, especially at the front end, which is most sensitive to short-term positioning and demand changes.
The current structure reflects the market pricing in fewer large moves ahead, with volatility supply continuing to outstrip demand across the curve.
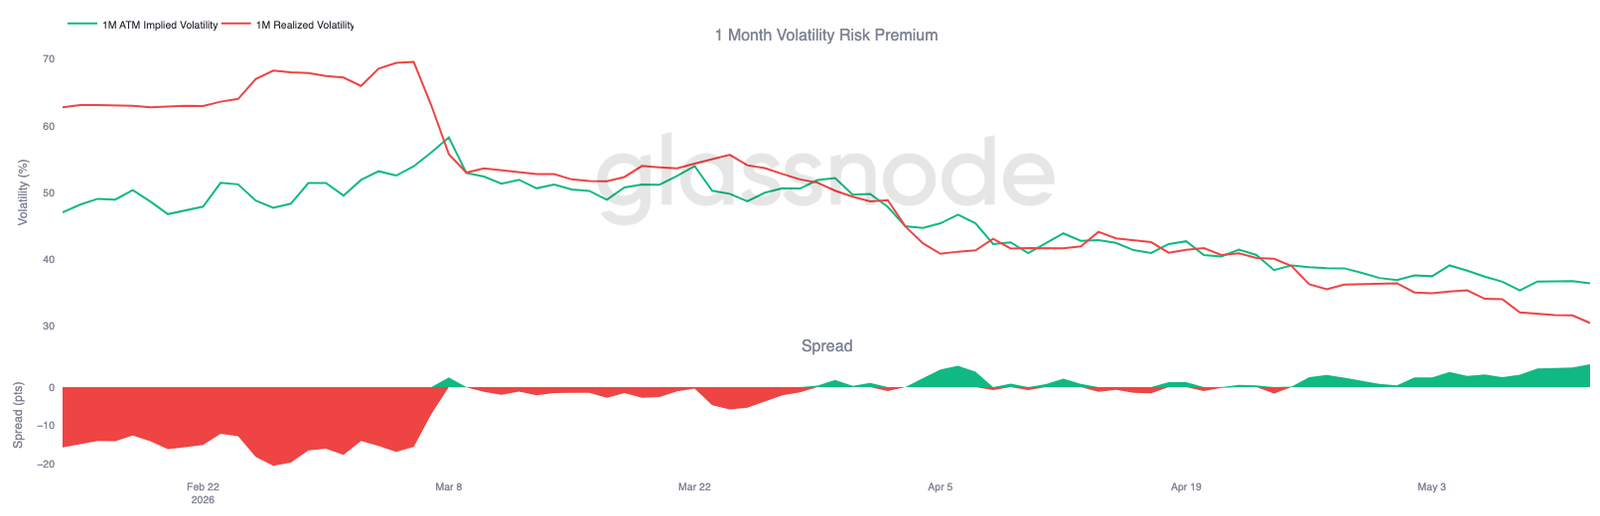
Volatility Risk Premium Remains Positive
While implied volatility continues to compress across all tenors, realized volatility has fallen more quickly. Bitcoin's 30-day realized volatility currently stands at 30.48%, steadily declining over the past few weeks as spot action remains relatively controlled.
Meanwhile, front-month implied volatility is still around 36.4%, meaning implieds remain above realized, maintaining a positive volatility risk premium. In other words, options continue to price in more volatility ahead than Bitcoin's recent spot moves have delivered.
The spread between implied and realized volatility has also been rebuilding over the past two to three weeks, recovering to around 6 volatility points after briefly compressing to parity in April. This suggests that despite the overall downward reset in volatility levels, options demand remains relatively high compared to realized volatility.
Therefore, while overall volatility continues to soften on both the implied and realized dimensions, hedging conditions remain favorable for volatility sellers.
Skew Compression Indicates Weakening Downside Hedging Demand
As volatility expectations continue to reset lower, skew is also normalizing across the curve. This move is most pronounced at the front end, where 1-week 25-delta skew compressed from around -10% to -4% over the past week. Longer tenures have softened in sympathy, with 1-month, 3-month, and 6-month tenures each losing roughly 1 to 2 points of put premium.
Notably, this compression occurs against a backdrop of Bitcoin consolidating around the $80,000 range with a less supportive macro environment. The options surface does not show increasing demand for downside protection; instead, it continues to reprice towards a more balanced structure.
This upward move reflects a steady decline in the premium of put options relative to calls, indicating that demand for downside protection across the curve is gradually waning rather than strengthening.
While skew across all tenures remains in bearish territory, the ongoing compression suggests downside hedging demand is slowly easing rather than intensifying.
Market Maker Gamma Keeps Spot Sensitive Around $82,000
Market maker positioning continues to create a reactive structure around the current price level. The largest concentration of negative gamma is located at the $82,000 strike, with an exposure of approximately $2.6 billion, while positive gamma accumulates near $85,000, approaching $1.8 billion.
With spot still trading below the negative gamma cluster at $82,000, a price retracement into that zone could trigger reactive market maker hedging flows, reinforcing momentum and amplifying price action. Further up, the concentration of positive gamma near $85,000 could act to dampen volatility.
Flows also reflect positional shifts. Over the past 7 days, put buying accounted for 71% of premium flow, reflecting high demand for downside protection during the recent consolidation. In the last 24 hours, 58% of flow came from put selling, suggesting that some hedges are being unwound.
This structure leaves the market increasingly sensitive to amplified hedging flows if spot re-enters the large negative gamma cluster near $82,000.
Conclusion
In summary, Bitcoin's recovery continues to strengthen beneath the surface. Spot-dominated demand, reignited ETF inflows, and improved speculative positioning have contributed to a more constructive market structure. The sharp compression in Relative Unrealized Loss, along with the stabilization of key on-chain profitability and liquidity metrics, suggests that the February decline is increasingly viewed as a cyclical reset rather than the beginning of a deeper bear market.
At the same time, the characteristics of this rally are distinctly different from the aggressive expansions seen during the 2023-2025 period. Capital inflows are recovering but remain well below previous breakout thresholds, while volatility compression and calmer derivative positioning point to a market that is gradually rebuilding confidence rather than entering a euphoric phase. This makes the current uptrend look more like a structurally supported recovery than a fully confirmed momentum breakout.
With Bitcoin now re-entering the dense overhead supply zone between $82,000 and $87,000, the market is moving into territory where price discovery becomes increasingly important. Sustaining a hold above this zone will likely require stronger spot participation and deeper capital rotation to absorb the remaining overhead supply. Until then, the broader structure continues to improve, but conviction appears to be rebuilding rather than fully restored.


